99 (imaging) problems
Posted by Nestor Saiz, on 17 July 2015
Last week, the SDB hosted what may well have been its highest annual meeting – at 8000 feet – in Snowbird, Utah. The atmosphere was fantastic, the talks were phenomenal, and the scenery was just obscene. It was an all-around great meeting, topped with a choir of singing PIs after the conference dinner. Couldn’t get better. If you missed it you can always catch up with what happened at #2015SDB.
On Sunday, Mary Dickinson moderated a workshop on imaging and quantitative biology where we realized many of us are faced with a number of common issues we are yet to resolve. A very useful discussion ensued with some ideas on how to solve them, so I thought it would be good to continue that conversation here where anyone interested can share information, ideas and resources. I would like it to be an open forum for anyone to contribute questions, and solutions and also to correct inaccuracies and dispel misconceptions. I will keep the post updated with a summary of suggestions and any consensus we might reach, so stay tuned…
Two of the problems raised at the SDB workshop had to do with
(1) quantification of fluorescence in whole-mount images and
(2) data sharing and public access.
Fluorescence quantitation really is a combination of several problems, since many variables can affect the resulting image: from sample fixation to antibody performance and acquisition parameters (if dealing with fixed specimens), and many others. For these and other reasons, many take fluorescence quantitation with a grain of salt. Nonetheless, if done carefully some of us believe it can be very informative. On the other hand, data gathered from fluorescent reporters (such as GFP or GFP fusions) is not affected by antibody, or other sample processing-related factors, and should therefore be much more straight forward to analyze. I do hope the experts will weigh in on some of these issues in the comments section. For instance: to what extent the use of photomultipliers (PMTs) in some confocal microscopes can undermine the results? Is there a reliable way to calibrate the microscopes prior to each imaging session in order to obtain comparable results?
For now, I just want to discuss one specific issue we, in the Hadjantonakis lab, have been trying to get around for some time: the intensity decay along the Z-axis, or Z-associated fluorescence decay (#callitwhatyouwant) in confocal images. When taking optical sections along the Z-axis in a confocal microscope, the further away from the lens the slice is, the dimmer the signal becomes (see Figure 1A, B). This is mainly due to the distance from the objective and the scattering of light through the sample. This is not a problem for image presentation; however, when comparing intensity between cell types, the differences due to cell position can be larger than real differences in expression, thus complicating the analysis.
# Fit a linear model (lm) to the corresponding fluorescence channel over Z
>lm(log(channel)~Z, data = dataframe)

# Output will yield two coefficients
# (Intercept)   Z
# 5.23416     -0.02233

# Plot corrected values (requires ggplot2 package)
>qplot(Z, log(channel)+Z*0.02233, data = dataframe)
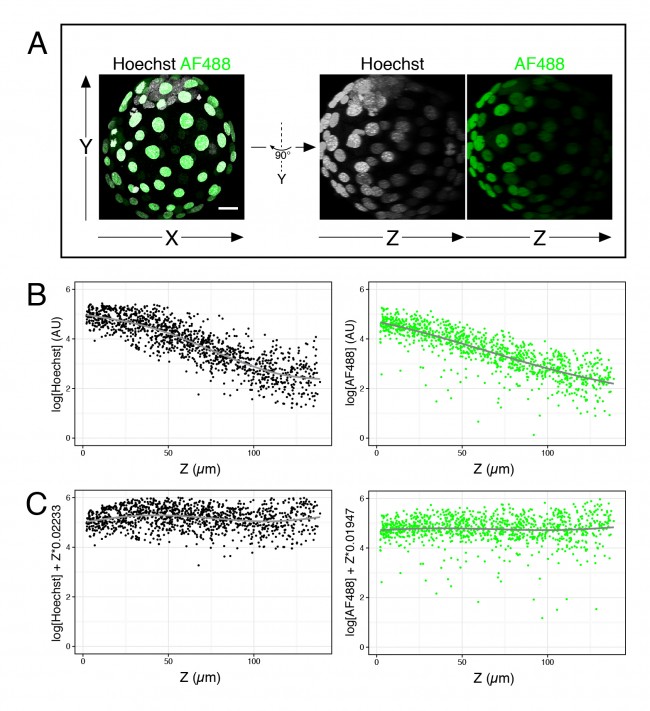
- Figure 1. Fluorescence decay along the Z-axis. (A) Example of 4 days old mouse embryo with nuclei labeled with Hoechst and outer cells labeled with an AlexaFluor 488 secondary antibody. (B) Plots of the logarithm of Hoechst and AF488 values over Z for many embryos like the one shown in (A). (C) Same data as in (B), after correction of each value.
Another issue raised was that of data sharing and public access to raw data post-publication. While genomic data is made available on public repositories, imaging data is not routinely so. With increasingly large datasets being generated from image quantitation, we need to make them – and the code used for analysis – publicly available alongside the article. This is important for reproducibility of the data, to avoid the file drawer problem and for other groups to possibly address new questions. Moreover, for many of us novices, having your code and analysis made available is not only good from a transparency standpoint, but also may earn you feedback from others on how to improve it.
We therefore discussed about (a) where to store the data and (b) potential standards to share image metadata, acquisition parameters, etc. Regarding repositories, Katherine Brown, from Development, suggested Dryad and Figshare. While Dryad seems to be preferred by publishers, Figshare also allows the sharing of unpublished (and perhaps unpublishable) data. Both services allow permanent storage of large volumes of data that can be continuously updated and facilitate citations by providing a DOI. Code may be stored in standard Git repositories such as GitHub.
Whereas there may not be a single storage solution for everybody, it would be important to set some standards for the presentation and organization of data and metadata. Someone at the workshop even suggested a standardized file nomenclature. Metadata is often stored in the microscope file (but not always in TIFFs), so sharing the raw images would address that problem. I personally find it useful to save experimental details and results in tables with consistent headers so that they can be melted or cross-referenced when needed. Sharing these could be one way to make experimental details available.
I think the take home message is that we will all benefit from discussing these issues and sharing ideas, and we may even reach a consensus on how to proceed while it is relatively early in the game. Therefore, do get involved, and please engage anyone who you think may have something to contribute to the discussion! I look forward to getting tips and ideas and perhaps some concrete solution on how to move forward!
UPDATE: I just realized Katherine recently wrote a post on this second issue, please feel free to comment on either!
 (7 votes)
Great Post Nestor :)
I also believe we should actively dicuss data quantification. We also normalized with DAPI and I do agree is not the best option ever.
We tend to adjust ourselves to the way quantification has been previously acepted but I’d rather vote for STANDARDS in quantification.
I do agree that data quantification has to be freely available too