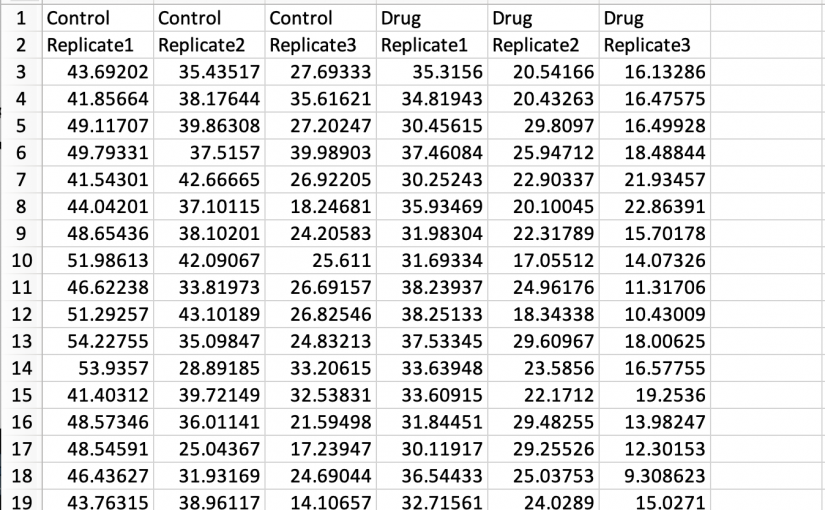
Converting spreadsheets to tidy data – Part 2
The superplot was recently proposed as a data visualization strategy that improves the communication of experimental results (Lord et al, 2020). To simplify the visualization of data with a superplot, I created a web tool that is named SuperPlotsOfData (Goedhart, 2020). The superplot tutorial for R , the tutorial for Python and the SuperPlotsOfData web app use the … Continue reading Converting spreadsheets to tidy data – Part 2
0 Comments
