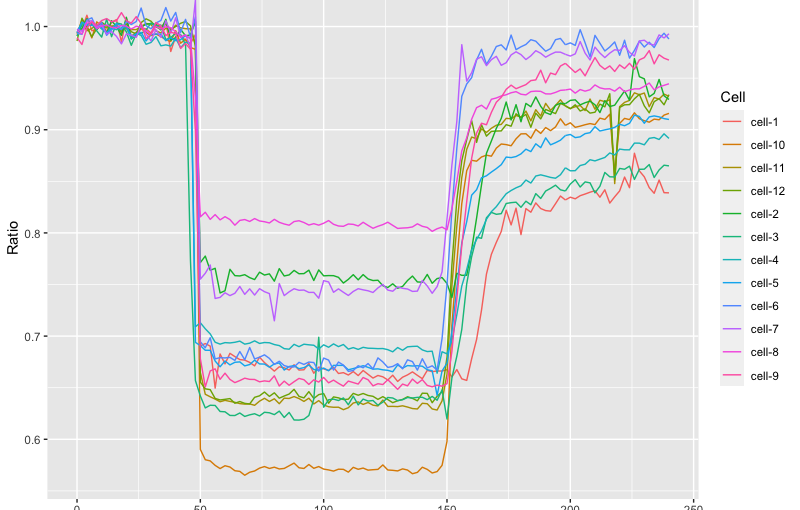
Dynamic display of data with animated plots
Data from time-lapse experiments is often displayed in a graph or plot, to visualize the dynamics of biological systems (Goedhart, 2020). Ironically, the perception of the dynamics is largely lost in a static plot. That’s where animated plots come in. Animated plots are a great way to display the dynamics of the underlying data. Below, I … Continue reading Dynamic display of data with animated plots
0 Comments
