From Image to Insight – Morphogenesis Meets Data Science
Posted by Jonas Hartmann, on 26 September 2020
A wave of innovations is advancing data-driven computational analysis and machine learning – time for developmental biologists to hop on the surf board! This post, inspired by our recent data-driven work on lateral line morphogenesis, provides a brief primer on key concepts and terms.
written by Jonas Hartmann & Darren Gilmour
From machine translation to self-driving cars and from deep fakes to high-speed trading, data-driven technologies are taking the world by storm, fueled by a torrent of funding from the tech industry. This has led to the rise of data science, a new and loosely defined interdisciplinary field that combines aspects of computer science, statistics and machine learning to extract information or generate predictions from large and otherwise inscrutable datasets.
Meanwhile in biology, it has never been easier to generate large and inscrutable datasets. New omics techniques and new microscopes paired with increased automation provide the means to digitize every aspect of a biological system, from single molecules to whole embryos. Crunching this data deluge and converting it into scientific understanding is simultaneously one of the biggest opportunities and one of the biggest challenges in modern biology – and data science is poised to become a powerful tool in meeting this challenge.
But not all data are created equal. Certain formats, such as counts or sequences, lend themselves more readily to the application of data science techniques. Others, including multi-dimensional images, require several layered steps of processing and analysis to tease apart the rich information encoded within them. Furthermore, much of the recent progress in machine learning is founded on big data, specifically on datasets with thousands or tens of thousands of samples, a scale that is hard if not impossible to achieve for many biological techniques. In short, datasets can be thought to fall onto a spectrum from big data (low information/sample ratio) to rich data (high information/sample ratio) – and when it comes to data-driven inference, big data has taken center stage among data scientists over the past years.
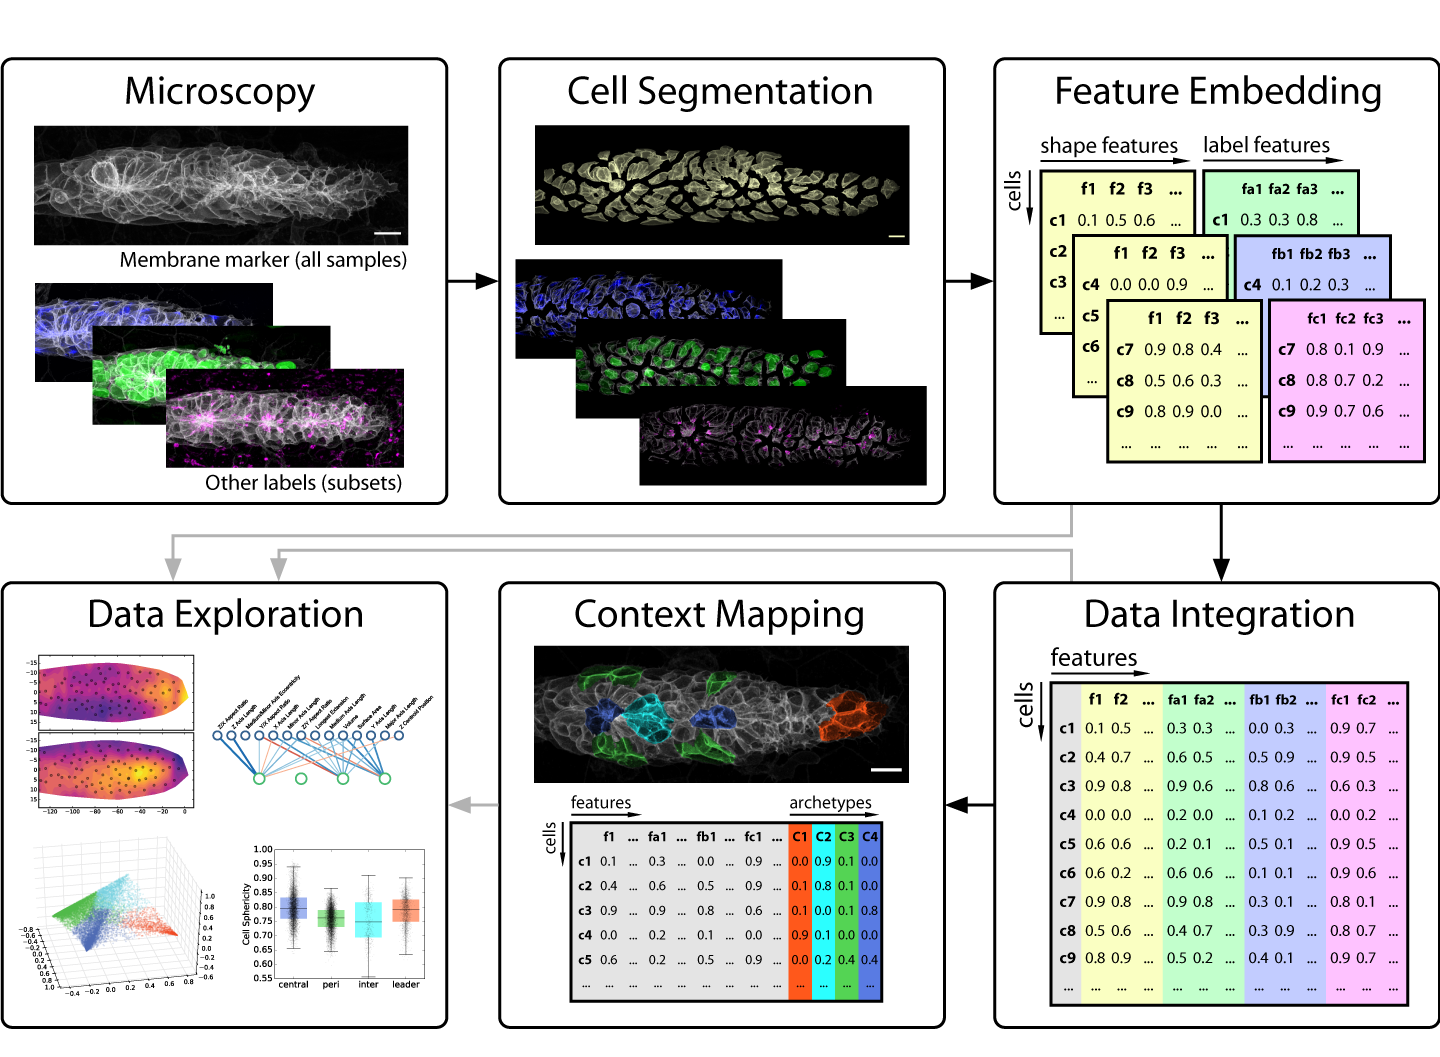
This brings us to developmental biology and more specifically to one of its key data sources: in vivo microscopy. Since high throughput remains a rare luxury in most imaging settings, developmental microscopists very much operate in the realm of rich data. This presents a major challenge for anyone looking to employ data science to disentangle the complexity of embryogenesis. Nevertheless, exciting progress is under way! For instance, many microscopists will be aware of the solutions machine learning is delivering for image analysis problems such as segmentation and tracking [1,2]. But as we learned in our work on the morphogenesis of the zebrafish lateral line primordium [3], segmentation is only the first step on the journey from image to insight (figure 1) – so our focus in this post is on what comes after a decent segmentation has been achieved.
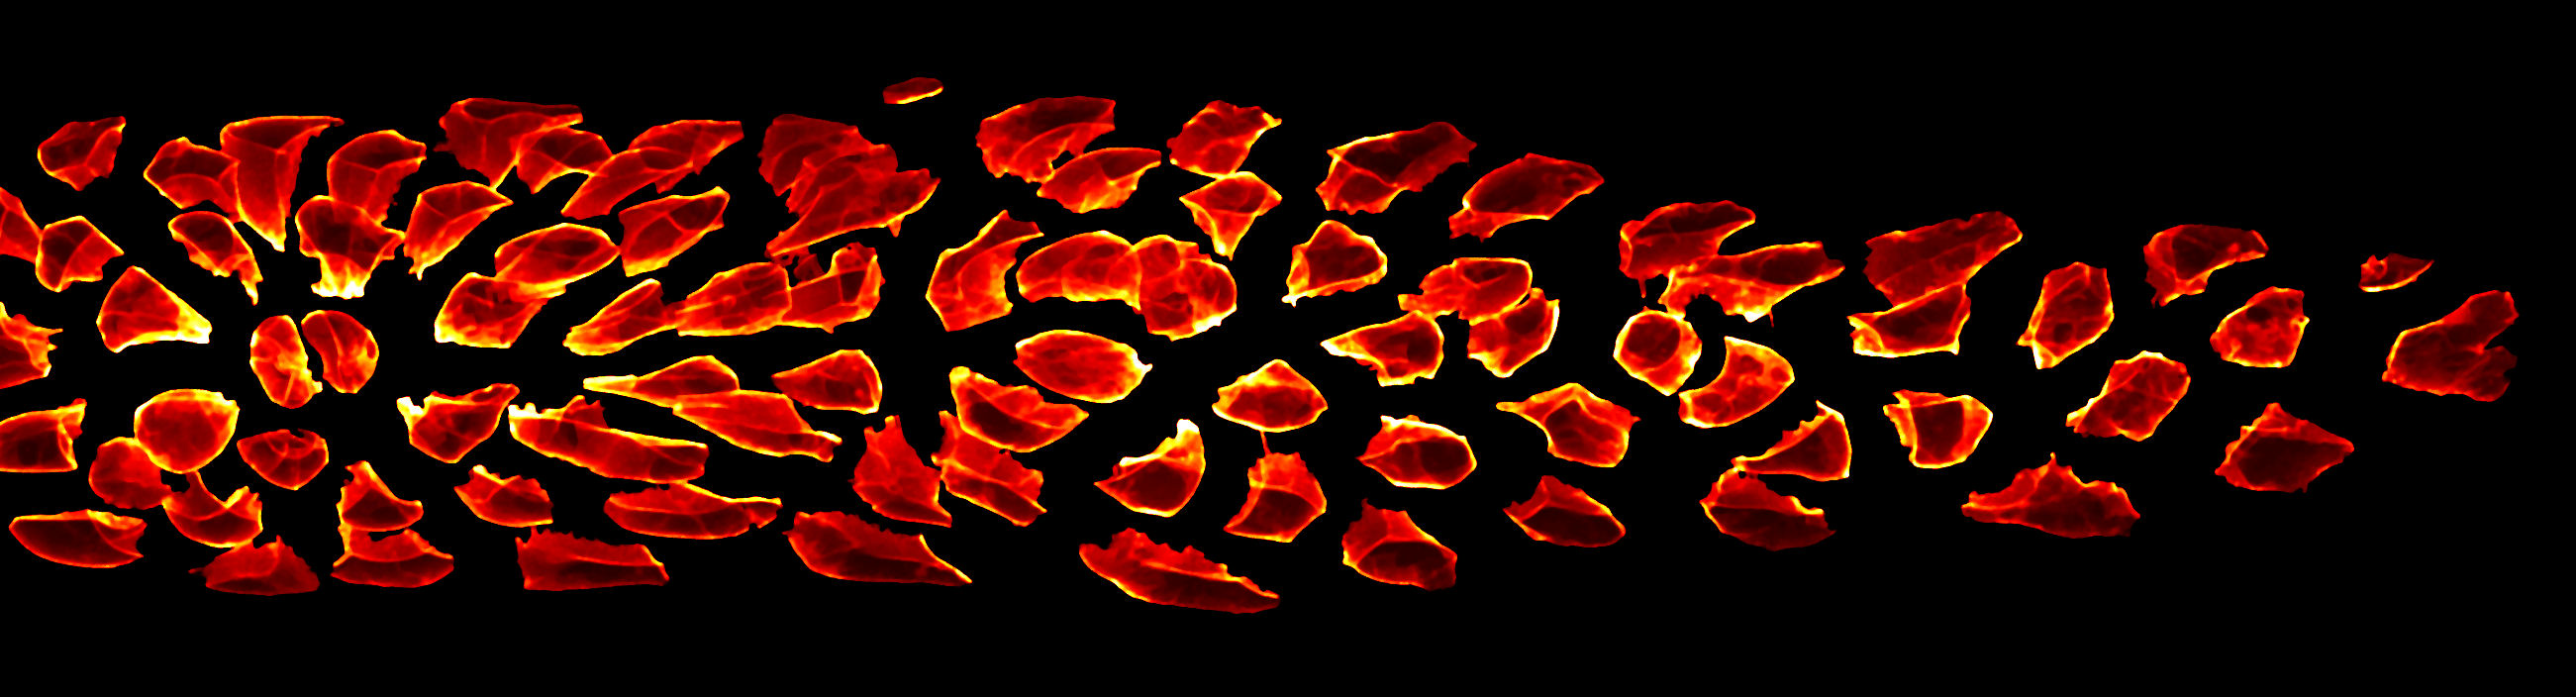
For those not familiar with the lateral line primordium: it is a developmental tissue of a hundred or so cells that migrate as a cohesive group along the flank of the developing embryo, assembling and occasionally depositing rosette-shaped clusters of cells, which go on to form the lateral line sensory organs [4]. The need for tight coordination between collective cell migration and rosette morphogenesis make the lateral line primordium an ideal system to study the interplay between multiple developmental processes, especially since the transparency of zebrafish embryos greatly facilitates high-quality live imaging. With this context in mind, let’s jump into the data science.
From Images to Numbers
Images, especially those produced by 3-5D microscopy of live embryos, are a prototypical example of rich data, as the obtainable number of samples is limited but each sample contains a wealth of information across multiple scales. By giving us both the (relative) abundance and the location of labeled components, images indirectly encode object counts, object shapes, contact interfaces between objects, textures, gradients, colocalization, and much more – and all of this potentially as dynamical measurements over time! Unfortunately, this information is not directly accessible to most modern data science methods, so exploring it in a data-driven fashion is difficult.
The key problem to solve is thus to go from images that encode all this rich information at once to numbers that encode the same information in a more explicit, disentangled fashion. In data science, such descriptive sets of numbers typically take the form of a feature space, which is a 2D array with a row for each sample and a column for each measure, also called a feature. The “space” in “feature space” reflects the notion that each sample’s feature values can be understood as a vector in an -dimensional space, where is the number of features. For microscopy data, features can be extracted to describe an entire image, regions of interest (e.g. different areas of a tissue) or fully segmented objects of interest (e.g. cells, nuclei, vesicles, filaments, etc.).
Strategies for feature extraction generally fall into one of two groups: feature engineering is the manual implementation of various measurements that could be of interest (e.g. volume, surface area, aspect ratios, etc.), whereas feature embedding is the use of an automated computational approach to generate features. The latter is also referred to as latent feature extraction, as implementations often look for variations across the entire dataset and then allocate features that capture this variation, thus uncovering “hidden” (latent) features that underlie the variability in the data. The advantage of feature embedding is that it is unbiased (or, more accurately; less biased), so it can capture interesting phenomena independent of the researcher’s prior assumptions. The disadvantage is that latent features may not correspond to obvious biological properties, so they can be harder to interpret.
In our recent paper, we use point clouds and clustering on those point clouds to bring 3D images of segmented cells into a format that allows us to use a simple Principal Component Analysis (PCA) to derive latent features. We use this approach primarily to analyze cell morphology based on the distribution of a membrane marker in 3D space, but it also works for other markers.
Over the past few years, feature engineering has become less common in data science, as deep neural networks can work directly with raw data; they essentially learn their own internal feature embedding strategy. This can also be used explicitly for latent feature extraction via neural network architectures called autoencoders (see this blog post for a short intro). The downside of this approach is that it usually requires big data to work reliably, so classical feature engineering and feature embedding strategies remain important tools for data-driven analysis of rich data.
A key limitation of the feature space data structure is that it doesn’t readily encode different organizational scales. For instance, it is not straightforward to meaningfully combine data on the tissue scale (a tissue x features array) with data at the cellular scale (cells x features) or below (e.g. protrusions x features) in a single analysis. Since exploring data across multiple scales is central to many biological questions, this is an area where technological innovation on the data science side is required to better accommodate biological applications.
From Numbers to Ideas
So what’s the point of all this work to convert raw image data into a tidy feature space? In short, it’s the wealth of computational tools that are available to operate on and visualize feature spaces to discover interesting patterns that lead to new hypotheses.
A common first step is dimensionality reduction, which essentially amounts to combining features that encode the same information and removing features that mostly contain noise (although this is a very pragmatic way of thinking about it). This is most commonly achieved with PCA. The point of dimensionality reduction is twofold: First, the remaining features are likely of high importance; to understand them is to understand the majority of variation in the entire dataset. Second, many of the tools discussed below struggle with very high-dimensional feature spaces, a problem known as the curse of dimensionality. This reflects our earlier discussion on big data versus rich data; most methods need many more samples than features to work well.
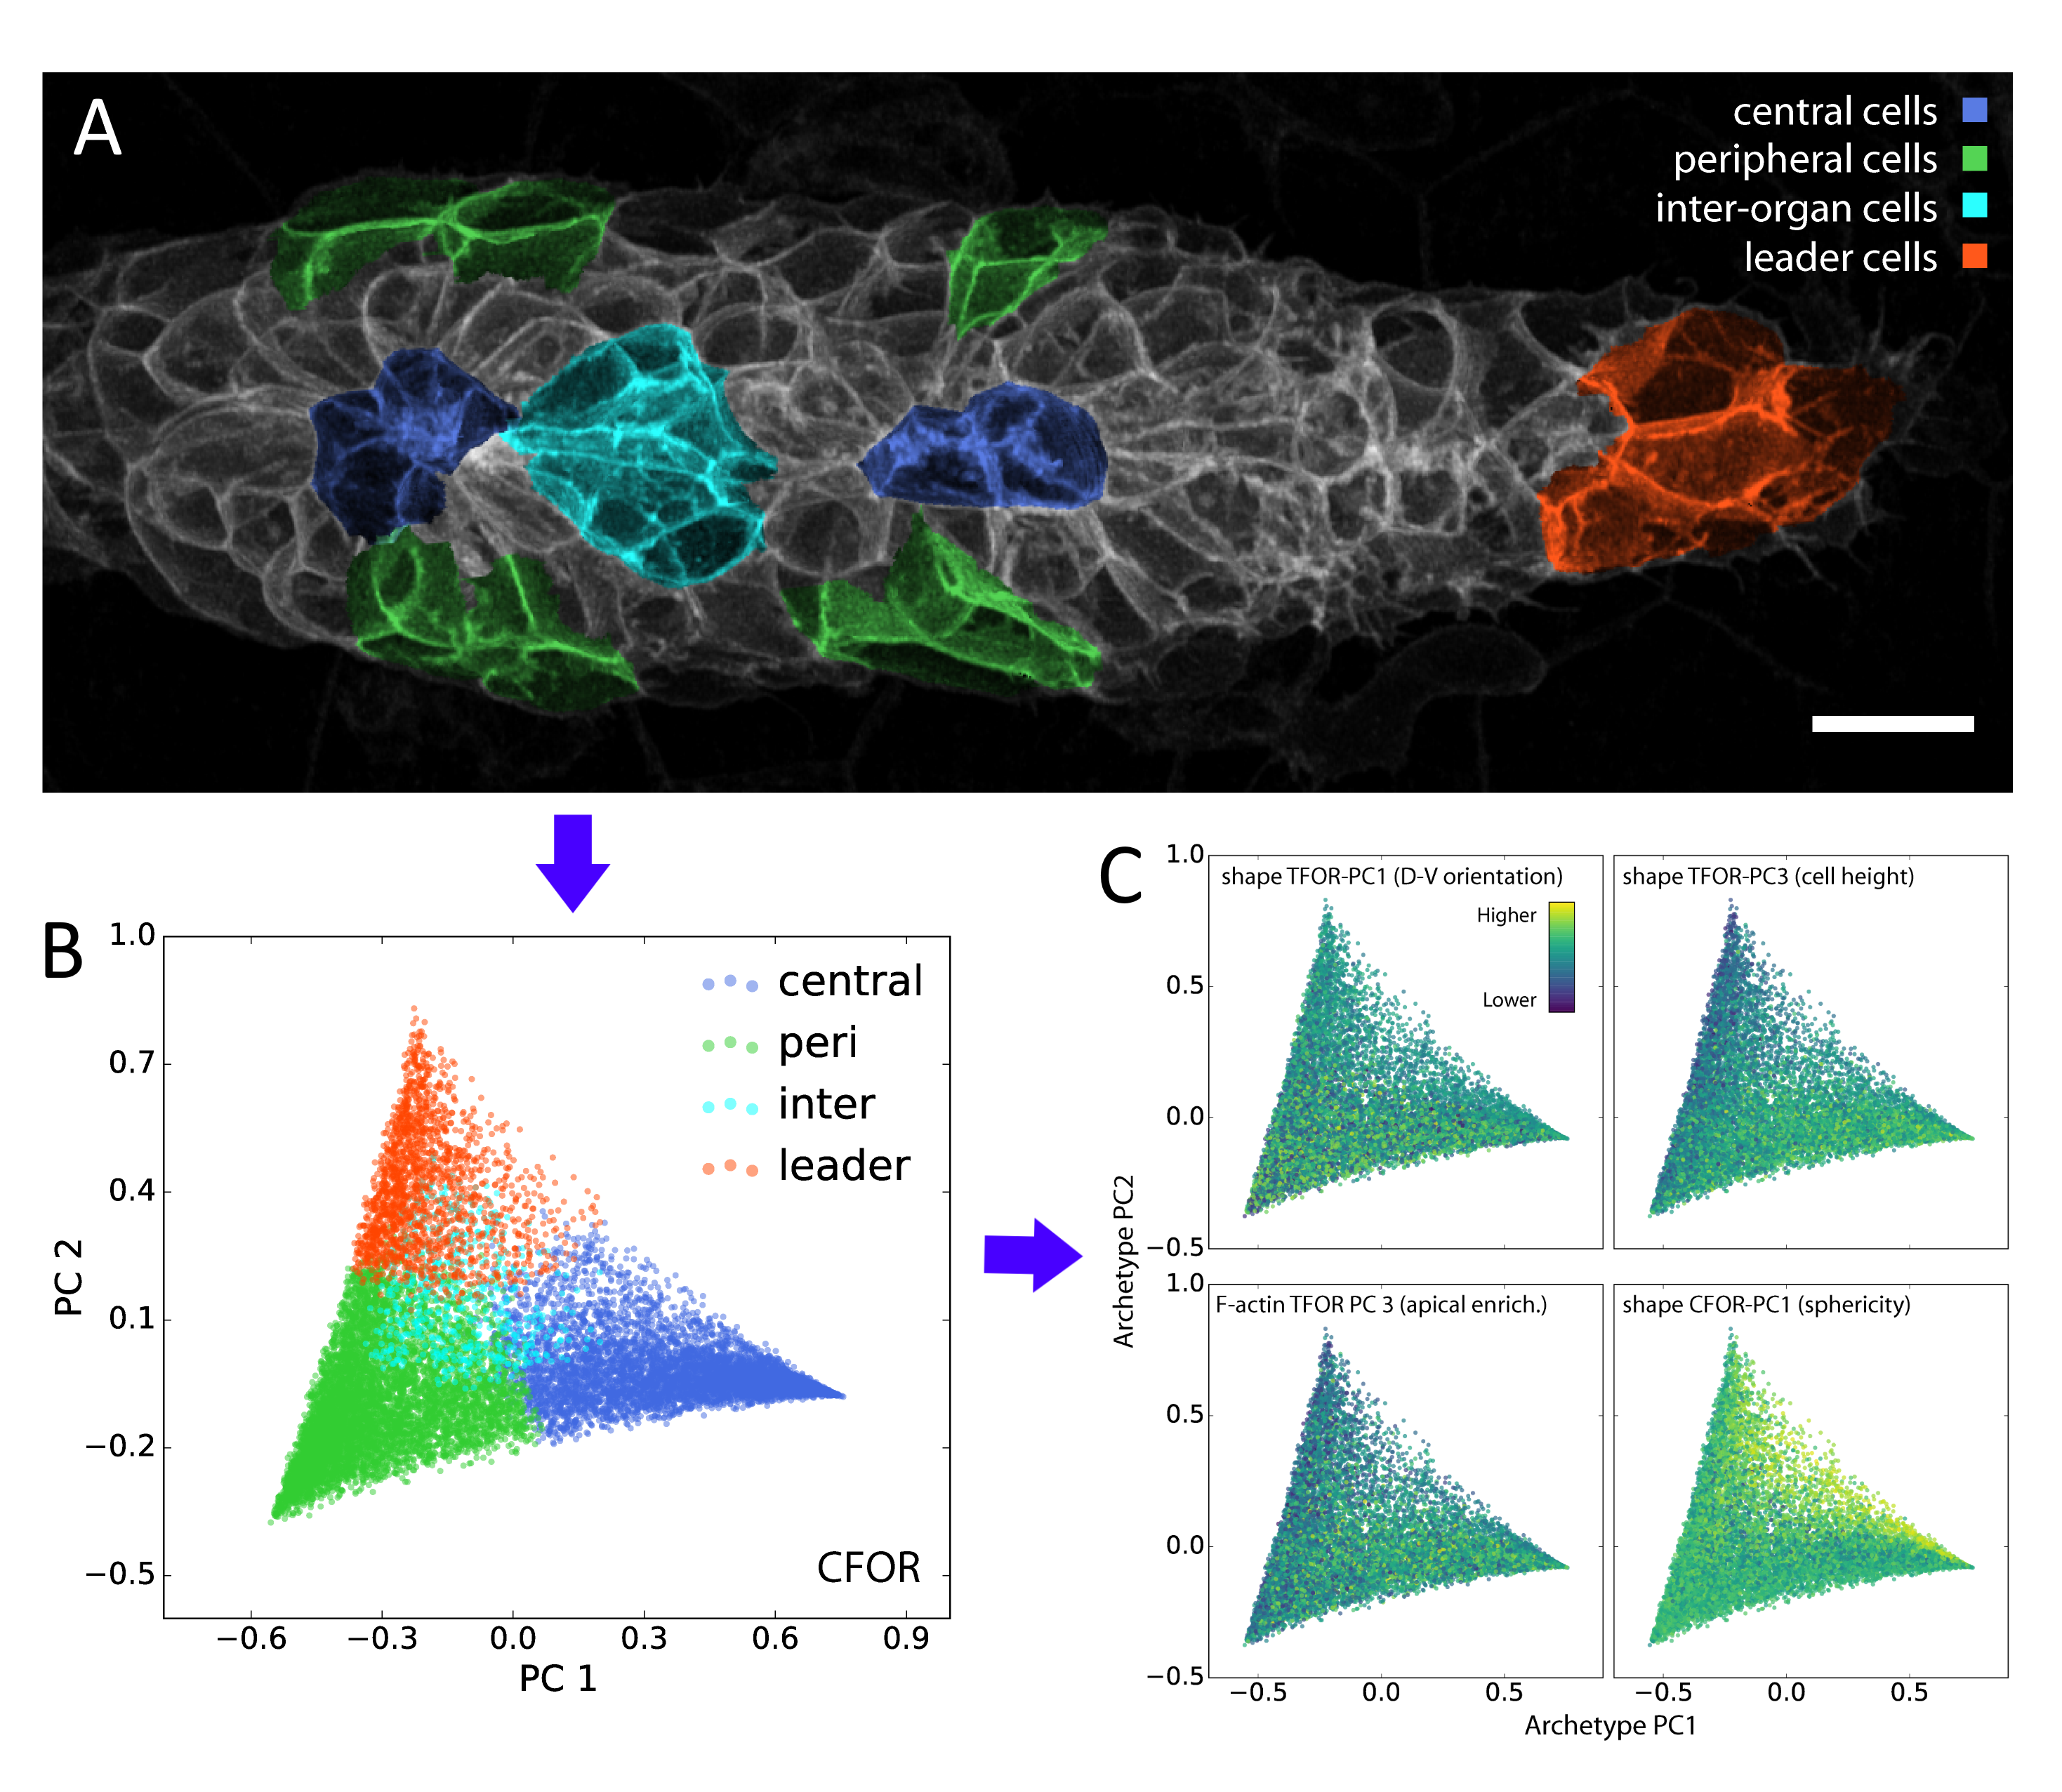
In our study, we performed dimensionality reduction and discovered that one of the most important remaining features relates to cell sphericity. We then mapped this key feature back onto the spatial organization of the lateral line primordium – averaged across all our samples – and found that it shows an unexpected central stripe pattern along the tissue. Given the intrinsic connection between sphericity and surface tension, this led us to the hypothesis that cell surface mechanics might regulate the relative location of cells within the migrating primordium.
Dimensionality reduction and related tools such as clustering (i.e. the identification of distinct subgroups among samples) are so-called unsupervised methods, as they work with a single input dataset. By contrast, supervised methods use both an input feature space and a target feature (also called the ground truth) and aim to learn the relationship between them. These algorithms are trained using a training set, for which both the input features and the target are known, for instance based on manual annotation of a subset of the data. Once trained, they can predict the target feature for new samples, based only on their input features.
A classifier is a supervised algorithm that can be trained to predict which of two or more groups a cell belongs to, given its features. We used this approach to classify cells into specific morphological archetypes, chosen by us to reflect our prior understanding of the tissue’s biology. This helped us make sense of the data from a biological perspective (more on this below).
A regressor predicts a continuous measure rather than a binary or categorical group label. We employed regressors to learn the relationship between shape features and features extracted from other channels, such as the distribution of vesicles or mRNA expression levels (measured by smFISH). Interestingly, regressors can be used as a means of integrating multiple different experiments (e.g. different smFISH stainings) based on reference features common to all experiments (e.g. cell morphology). By training a regressor to predict the experiment-specific results from the reference features, those specific results can be overlaid onto any dataset for which the same references are available. This enables the creation of an integrated dataset, often referred to as an atlas. Such atlases can be built across feature spaces but also directly across images, using neural networks as image-to-image regressors. An impressive example of which is given by the Allen Integrated Cell [5].
Although these data-driven techniques are powerful, unsolved challenges remain. One such challenge is the translation between how humans understand data and how computers understand data. For instance, it is difficult to include expert knowledge into a deep learning algorithm. Conversely, it can be hard to interpret the results produced by an algorithm in a biologically meaningful way. We used our classification of cells into different morphological archetypes to visualize and analyze our entire dataset from a more interpretable perspective, an approach we call context-guided visualization (figure 2).
The Future of Data-Driven Developmental Biology
It’s important to stress that data science techniques, although interesting and useful in a multitude of ways, cannot and should not replace “traditional” science. To complete the full cycle of science, the hypotheses extracted from the data need to be tested with specifically designed experiments, which is something we are currently pursuing for the observations we made in our data-driven analysis of the lateral line primordium.
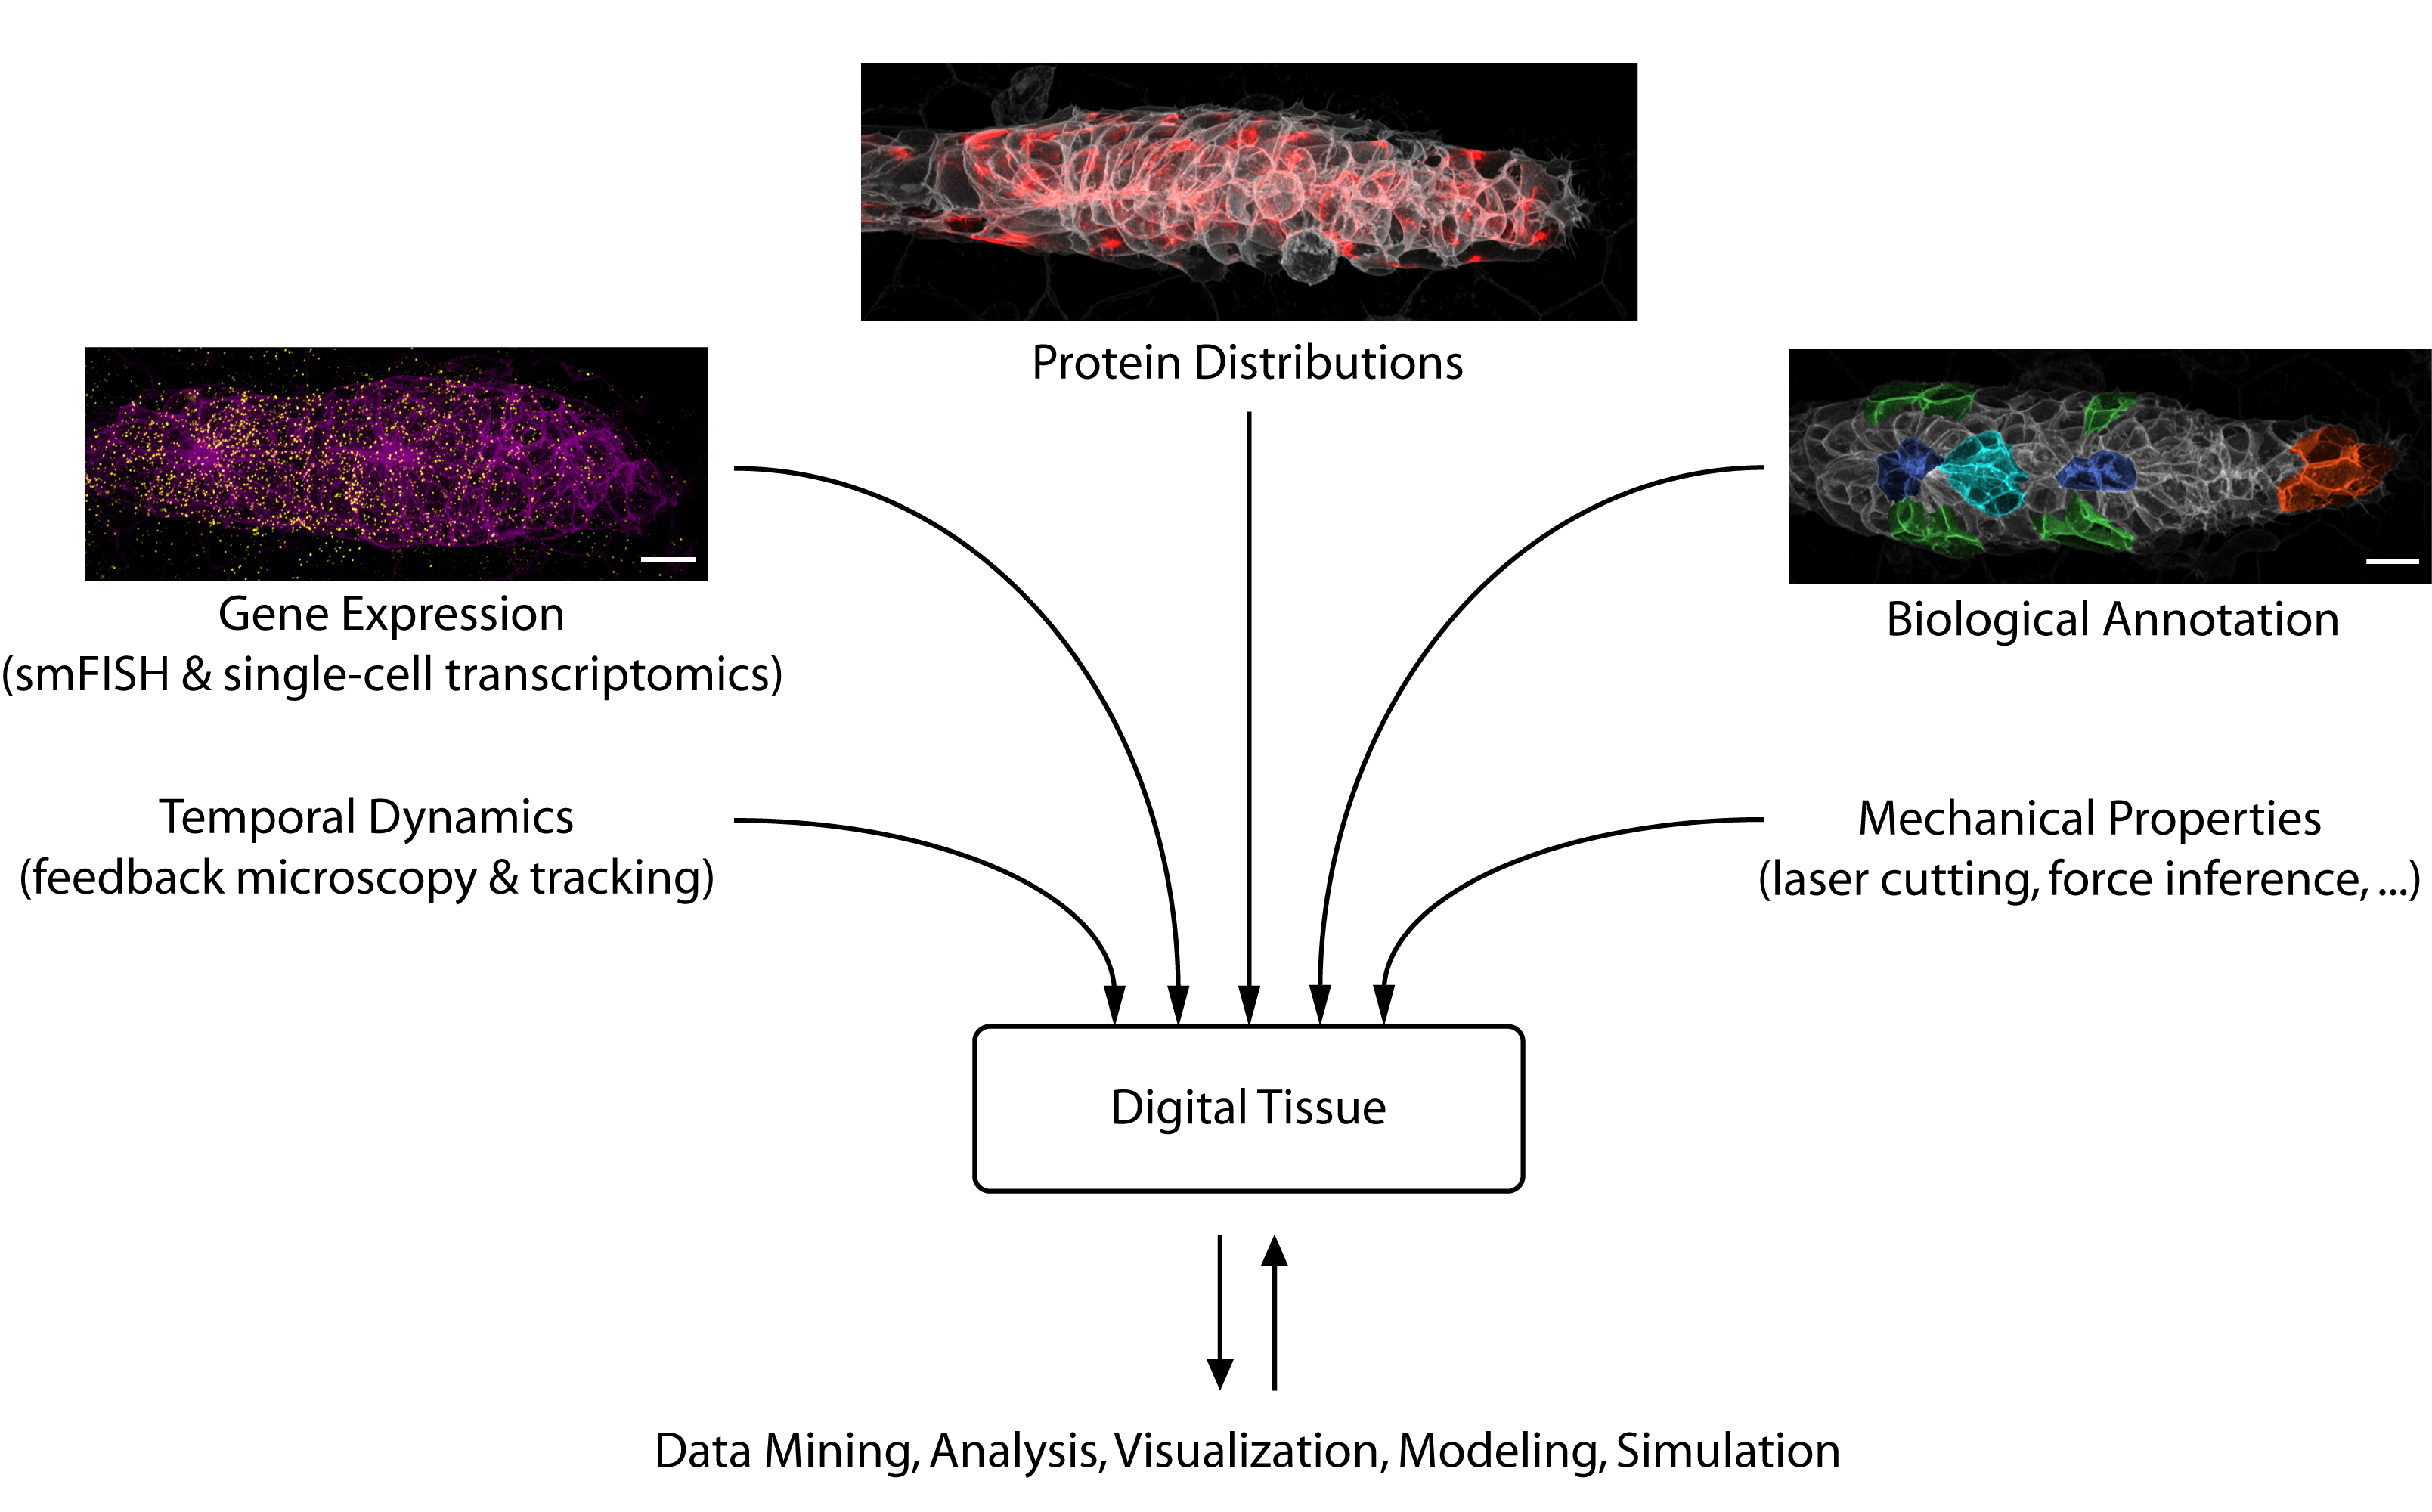
Looking toward the future, we see considerable potential for data science to accelerate developmental biology. Besides solving challenging image analysis problems (such as single-cell segmentation), data-driven methods can serve as “hypothesis generators” that allow us to comb through the complexity and messiness of cell and tissue biology. Eventually, large databases could be constructed that interlink different types of information into “digital tissues” (figure 3) or even “digital embryos”, which can be mined for interesting patterns and relationships. Early examples of such large-scale atlases are already starting to come online [6].
But data-driven developmental biology has a long way to go. As we have pointed out, biology is uniquely complicated in its dynamic and multi-scale nature, which plays to some of the weaknesses of current data-driven tools. Thus, there is a need for technical work to build biology-specific data science platforms and to adapt methods from other data-driven fields to the peculiarities of biology. Perhaps even more importantly, biologists need to receive the training required to understand and employ these techniques in their own work. Fortunately, data literacy training is on the rise in schools and universities, computer programming is easier to learn than ever and the relevant computational tools are being packaged more and more accessibly. Slowly but surely, data science will thus find its way into the developmental biology toolbox.
References
- Moen E, Bannon D, Kudo T, Graf W, Covert M, Van Valen D: Deep learning for cellular image analysis. Nature Methods 2019, 16:1233–1246.
- Berg S, Kutra D, Kroeger T, Straehle CN, Kausler BX, Haubold C, Schiegg M, Ales J, Beier T, Rudy M, et al.: ilastik: interactive machine learning for (bio)image analysis. Nat Methods 2019, 16:1226–1232.
- Hartmann J, Wong M, Gallo E, Gilmour D: An image-based data-driven analysis of cellular architecture in a developing tissue. eLife 2020, 9:e55913.
- Ghysen A, Dambly-Chaudiere C: The lateral line microcosmos. Genes & Development 2007, 21:2118–2130.
- Ounkomol C, Seshamani S, Maleckar MM, Collman F, Johnson GR: Label-free prediction of three-dimensional fluorescence images from transmitted-light microscopy. Nat Methods 2018, 15:917–920.
- Vergara HM, Pape C, Meechan KI, Zinchenko V, Genoud C, Wanner AA, Titze B, Templin RM, Bertucci PY, Simakov O, et al.: Whole-body integration of gene expression and single-cell morphology. bioRxiv 2020, doi:10.1101/2020.02.26.961037.
 (5 votes)
If you are a biologist and would like to dip your feet in image analysis and data science (perhaps in preparation for taking a deep dive), the following links may be of interest to you. They are all based on python, as python is easy to learn and broadly applicable!
General python:
– For beginners with no programming experience: https://swcarpentry.github.io/python-novice-gapminder
– For those with a little bit of experience looking to learn more based on a practical application (data analysis on arthritis inflammation): https://swcarpentry.github.io/python-novice-inflammation
Image analysis:
– General introduction: https://datacarpentry.org/image-processing
– Biology-focused introduction: https://github.com/WhoIsJack/python-bioimage-analysis-tutorial
Data science:
– Collection of tutorials: https://scikit-learn.org/stable/tutorial/index.html
(With thanks to Toby Hodges from the Carpentries for distilling the many great materials online down to these key starting points.)