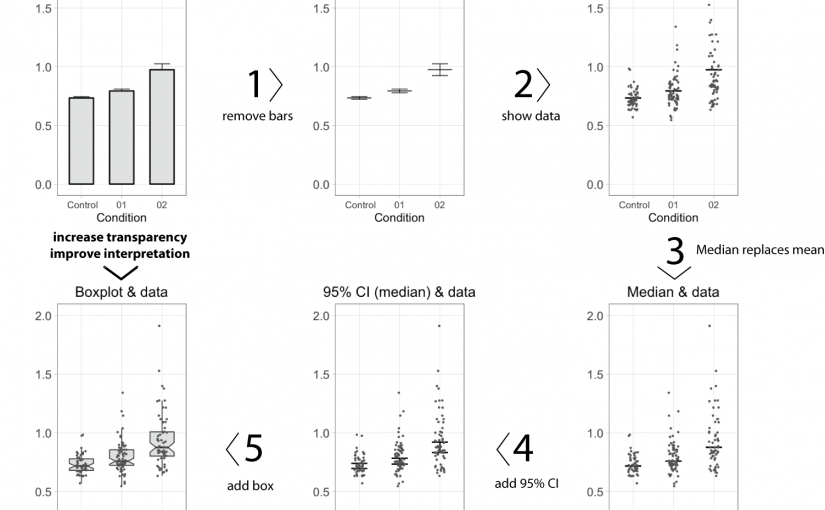
Introduction Graphs (or charts or plots) are often used for the display and summary of data. They are essential tools for the communication of results in presentations or manuscripts. One particular type of graph, the bar graph, is often used to quantitatively compare (multiple) conditions. The earliest known example of a bar graph, dates from … Continue reading Leaving the bar in five steps
2 Comments