A tribute to parrots
Posted by Joachim Goedhart, on 5 April 2018
In a previous blog, I have disgraced parrots by associating them with P-values and discrediting them for their mechanic repetition. Nevertheless, I admire the vivid colours of these multifaceted birds. Here, I want to make it up by dedicating a pseudo-colour look-up table (LUT) to parrots.
The images produced by fluorescence microscopy are best displayed in grayscale for optimal contrast, using a linear relation between gray-level and pixel intensity (footnote 1). However, the number of gray levels that can be distinguished by humans is orders of magnitude smaller than the number of colours that can be discerned. Therefore, pseudo-colours (also often named false colours) can be used to achieve better contrast and convey a finer level of detail (Sheppard et al., 1968), at the cost of loosing the relation between intensities in the image and the actual pixel value. Thus, the choice between grayscale representation and pseudo-colour will depend on the information that is visualised.
A monochrome digital image can be converted into a pseudo-colour image by replacing each pixel value with a colour (Fink, 1976). The conversion is defined by a so-called look-up table (LUT). The LUT contains 256 RGB codes that define a colour for each of the pixel values between 0 and 255. The combinations are basically endless. A collection of LUTs for cartography, technical illustration and design is available here and the popular image processing software ImageJ/FIJI comes with a set of LUTs.
The LUT that is applied to an image largely depends on the information that one wants to visualise. Since the LUTs are critical as to the level of detail that can be discerned, careful selection is important. Here, I highlight different LUTs in the context of fluorescence images. Besides fluorescence intensity, several other parameters can be encoded by colour. Examples are (i) temporal encoding (figure 1 left), (ii) depth encoding (figure 1 right, and see several other examples here), and (iii) encoding of a spectroscopic parameter, e.g. fluorescence lifetime (Joosen et al., 2014).
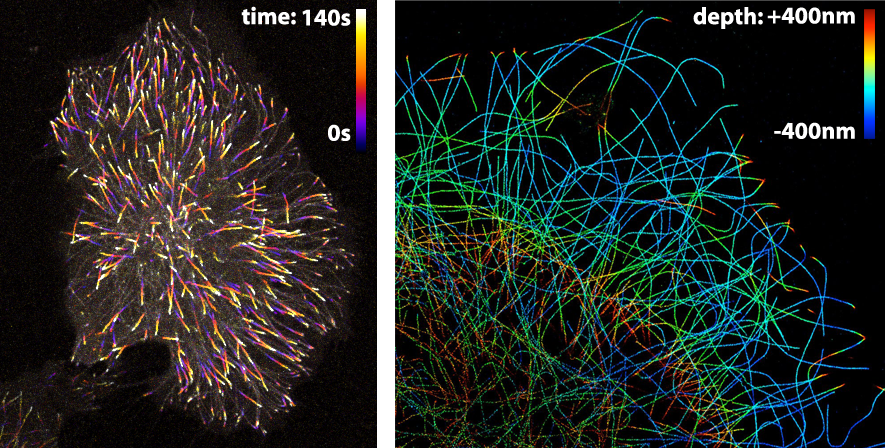
Figure 1: Pseudo-colours are used (in the left panel) to encode time to show the dynamics of microtubule plus ends or (in the right panel) to encode depth in a 3D STORM image of microtubules. Image credits: Timelapse movie of EB3-mNeonGreen by Anna Chertkova, 3D STORM image by Christophe Leterrier.
Here, I will give examples of pseudo-coloured images that were obtained by FRET ratio-imaging. In FRET ratio-imaging the response of a biosensor is monitored by emission ratio-imaging. Both the spatial differences and the changes over time can be of interest. The spatial differences are usually presented with pseudo coloured maps of the FRET ratio. Movies of these FRET maps are generated to depict the ratio changes over time.
The ‘Fire’ LUT that comes with ImageJ works well for temporal colour coding (figure 1, left panel). A variant of the Fire LUT was generated and named ‘MorgenStemning’. This LUT is colourblind friendly and has a linear increase in luminance (Geissbuehler and Lasser, 2013). Similarly, several “perceptually uniform” colour palettes were generated that are also colourblind friendly. These LUTs, ‘Inferno’, ‘Viridis’, ‘Magma’ & ‘Plasma’, are described here. The Inferno LUT is a good choice, since it starts with black at zero intensity. This LUT does, however, not use white for maximal intensity, thereby not providing maximal contrast.
Some of the LUTs that we previously used are the ‘royal’ LUT of ImageJ (Unen et al., 2015) and a pseudocolor LUT that is part of MetaMorph software (Reinhard, 2016). Since I was not entirely satisfied with the existing LUTs, I designed a new LUT (footnote 2). The basic features are that it starts with black and ends with white to achieve maximal contrast between the minimal and maximal pixel values. The false colours that correspond with lower half of the pixel values does not have a red component to get a cyan colour which blends into bright green. For higher pixels values the false colours turn from green via orange and red to white. As the colours in the LUTs reminded me of parrots, I call this LUT ‘parrot’. Figure 2 shows how the parrot LUT compares to other LUTs. The parrot LUT is colour-blind-friendly (footnote 3), but it is not perceptually uniform and is suboptimal in this respect.
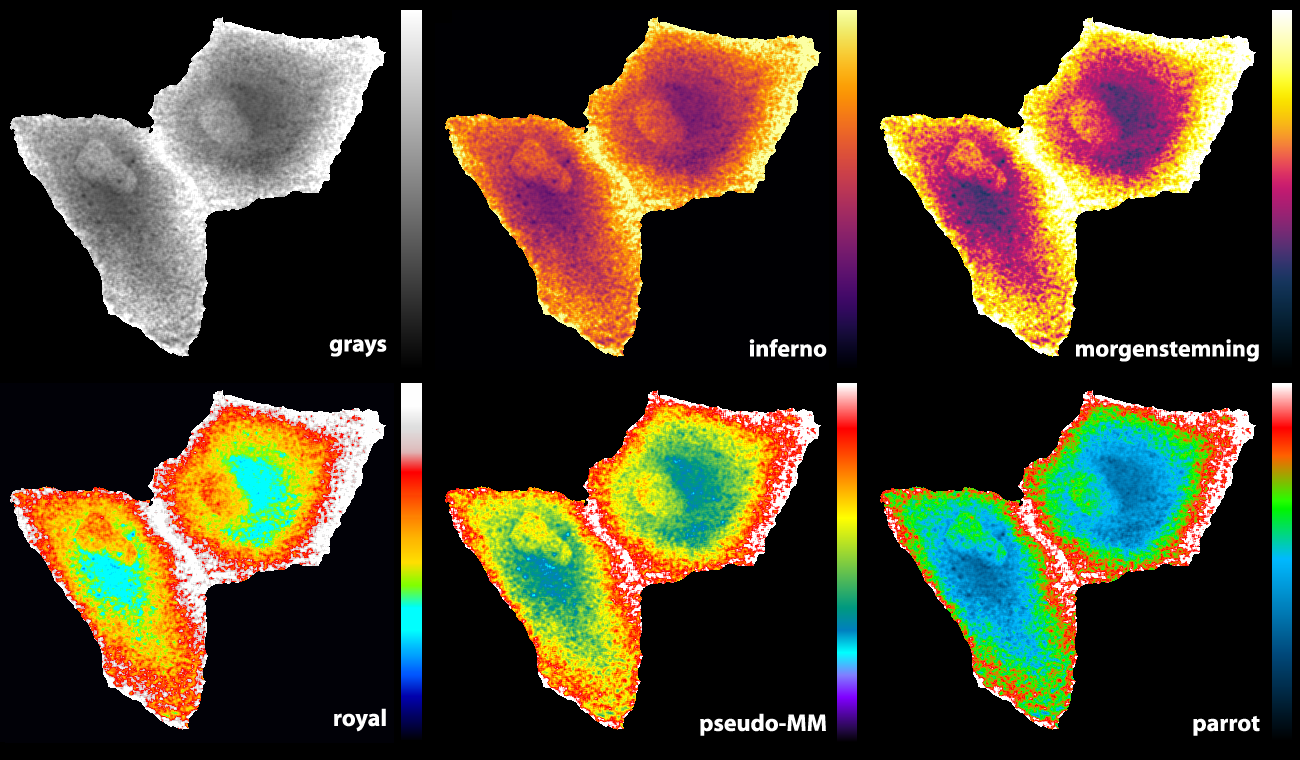
Figure 2: An overview of different LUTs applied to the same grayscale image that displays Rho GTPase activity in endothelial cells (Reinhard, 2017). The image and LUTs are available here.
Final words
The choice of a LUT is often based on a qualitative assessment of how it visualises the information. By trying a number of LUTS, the LUT that best conveys the information can be selected. Therefore, it useful to have a broad panel of LUTs to choose from and the parrot LUT is just another option. I encourage designing and sharing of LUTs (either as supplemental data to go with a paper or on data sharing platforms – footnote 4) to increase the number of options and the chances of finding the right LUT.
Acknowledgments: Thanks to Jakobus van Unen for tracing back the origin of the ‘pseudo-MM’ LUT to metamorph and to Marten Postma for making the LUT editor available.
Footnotes
Footnote 1: Achieving a true linear relationship between pixel value and displayed grayscale value may be impossible and irrelevant.
Footnote 2: The parrot LUT was created with a MatLab based LUT editor that was generated by Marten Postma
Footnote 3: I have a colour vision deficiency that prevents me from distinguishing blue from purple and bright green from yellow. This is the main reason to remove most of the red component and only have a limited band with a green/yellow component. Since I designed it, it is intrinsically colour-blind friendly. However, as there are several types of colour vision deficiency it may not work for everyone.
Footnote 4: The LUTs and related material described in this blog are available at Zenodo (Doi: 10.5281/zenodo.1211690).
.
 (7 votes)