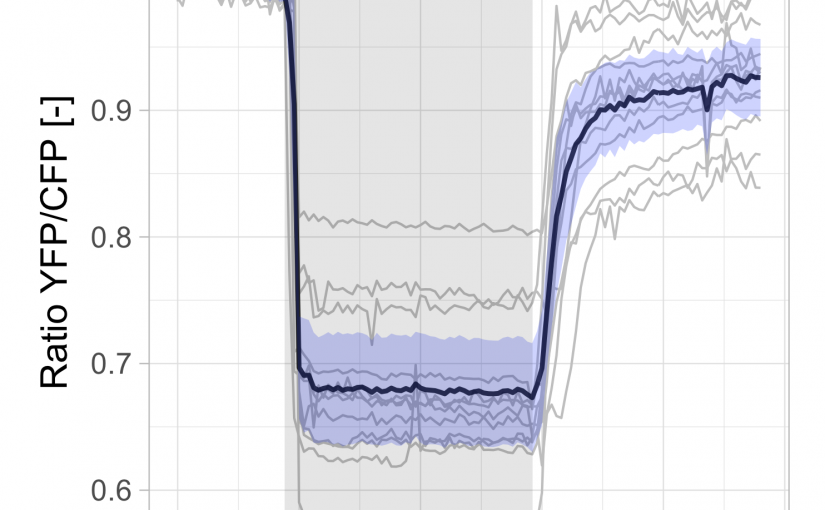
Visualizing data with R/ggplot2 – It’s about time
The visualization of temporal data by line graphs has been documented and popularized by William Playfair in the 18th century (Aigner et al, 2011; Beniger and Robyn, 1978). Today, time-dependent changes are still depicted by line graphs and ideally accompanied by a measure of uncertainty (Marx, 2013). Below, I provide a ‘walk-through’ for generating such a … Continue reading Visualizing data with R/ggplot2 – It’s about time
1 Comment
