How to
This collection features helpful posts on a wide range of topics, from academic writing and reviewing to data visualisation and statistical analysis.
Recent posts
Color-blind people are your audience too!
Posted by Helena Jambor, on 27 April 2017
Or, please stop mixing green/red Color is a key aspect of graphic design, but for many years was not relevant for scientific figures that were largely black and white. Falling …Leaving the bar in five steps
Posted by Joachim Goedhart, on 24 March 2017
Introduction Graphs (or charts or plots) are often used for the display and summary of data. They are essential tools for the communication of results in presentations or manuscripts. One …#BarBarPlots!
Posted by Helena Jambor, on 31 August 2016
(or: how to avoid misleading representations of statistical data) Recently, a kickstarter project raised more than 3000€ in one month to campaign for banning the wrong usage of bar …
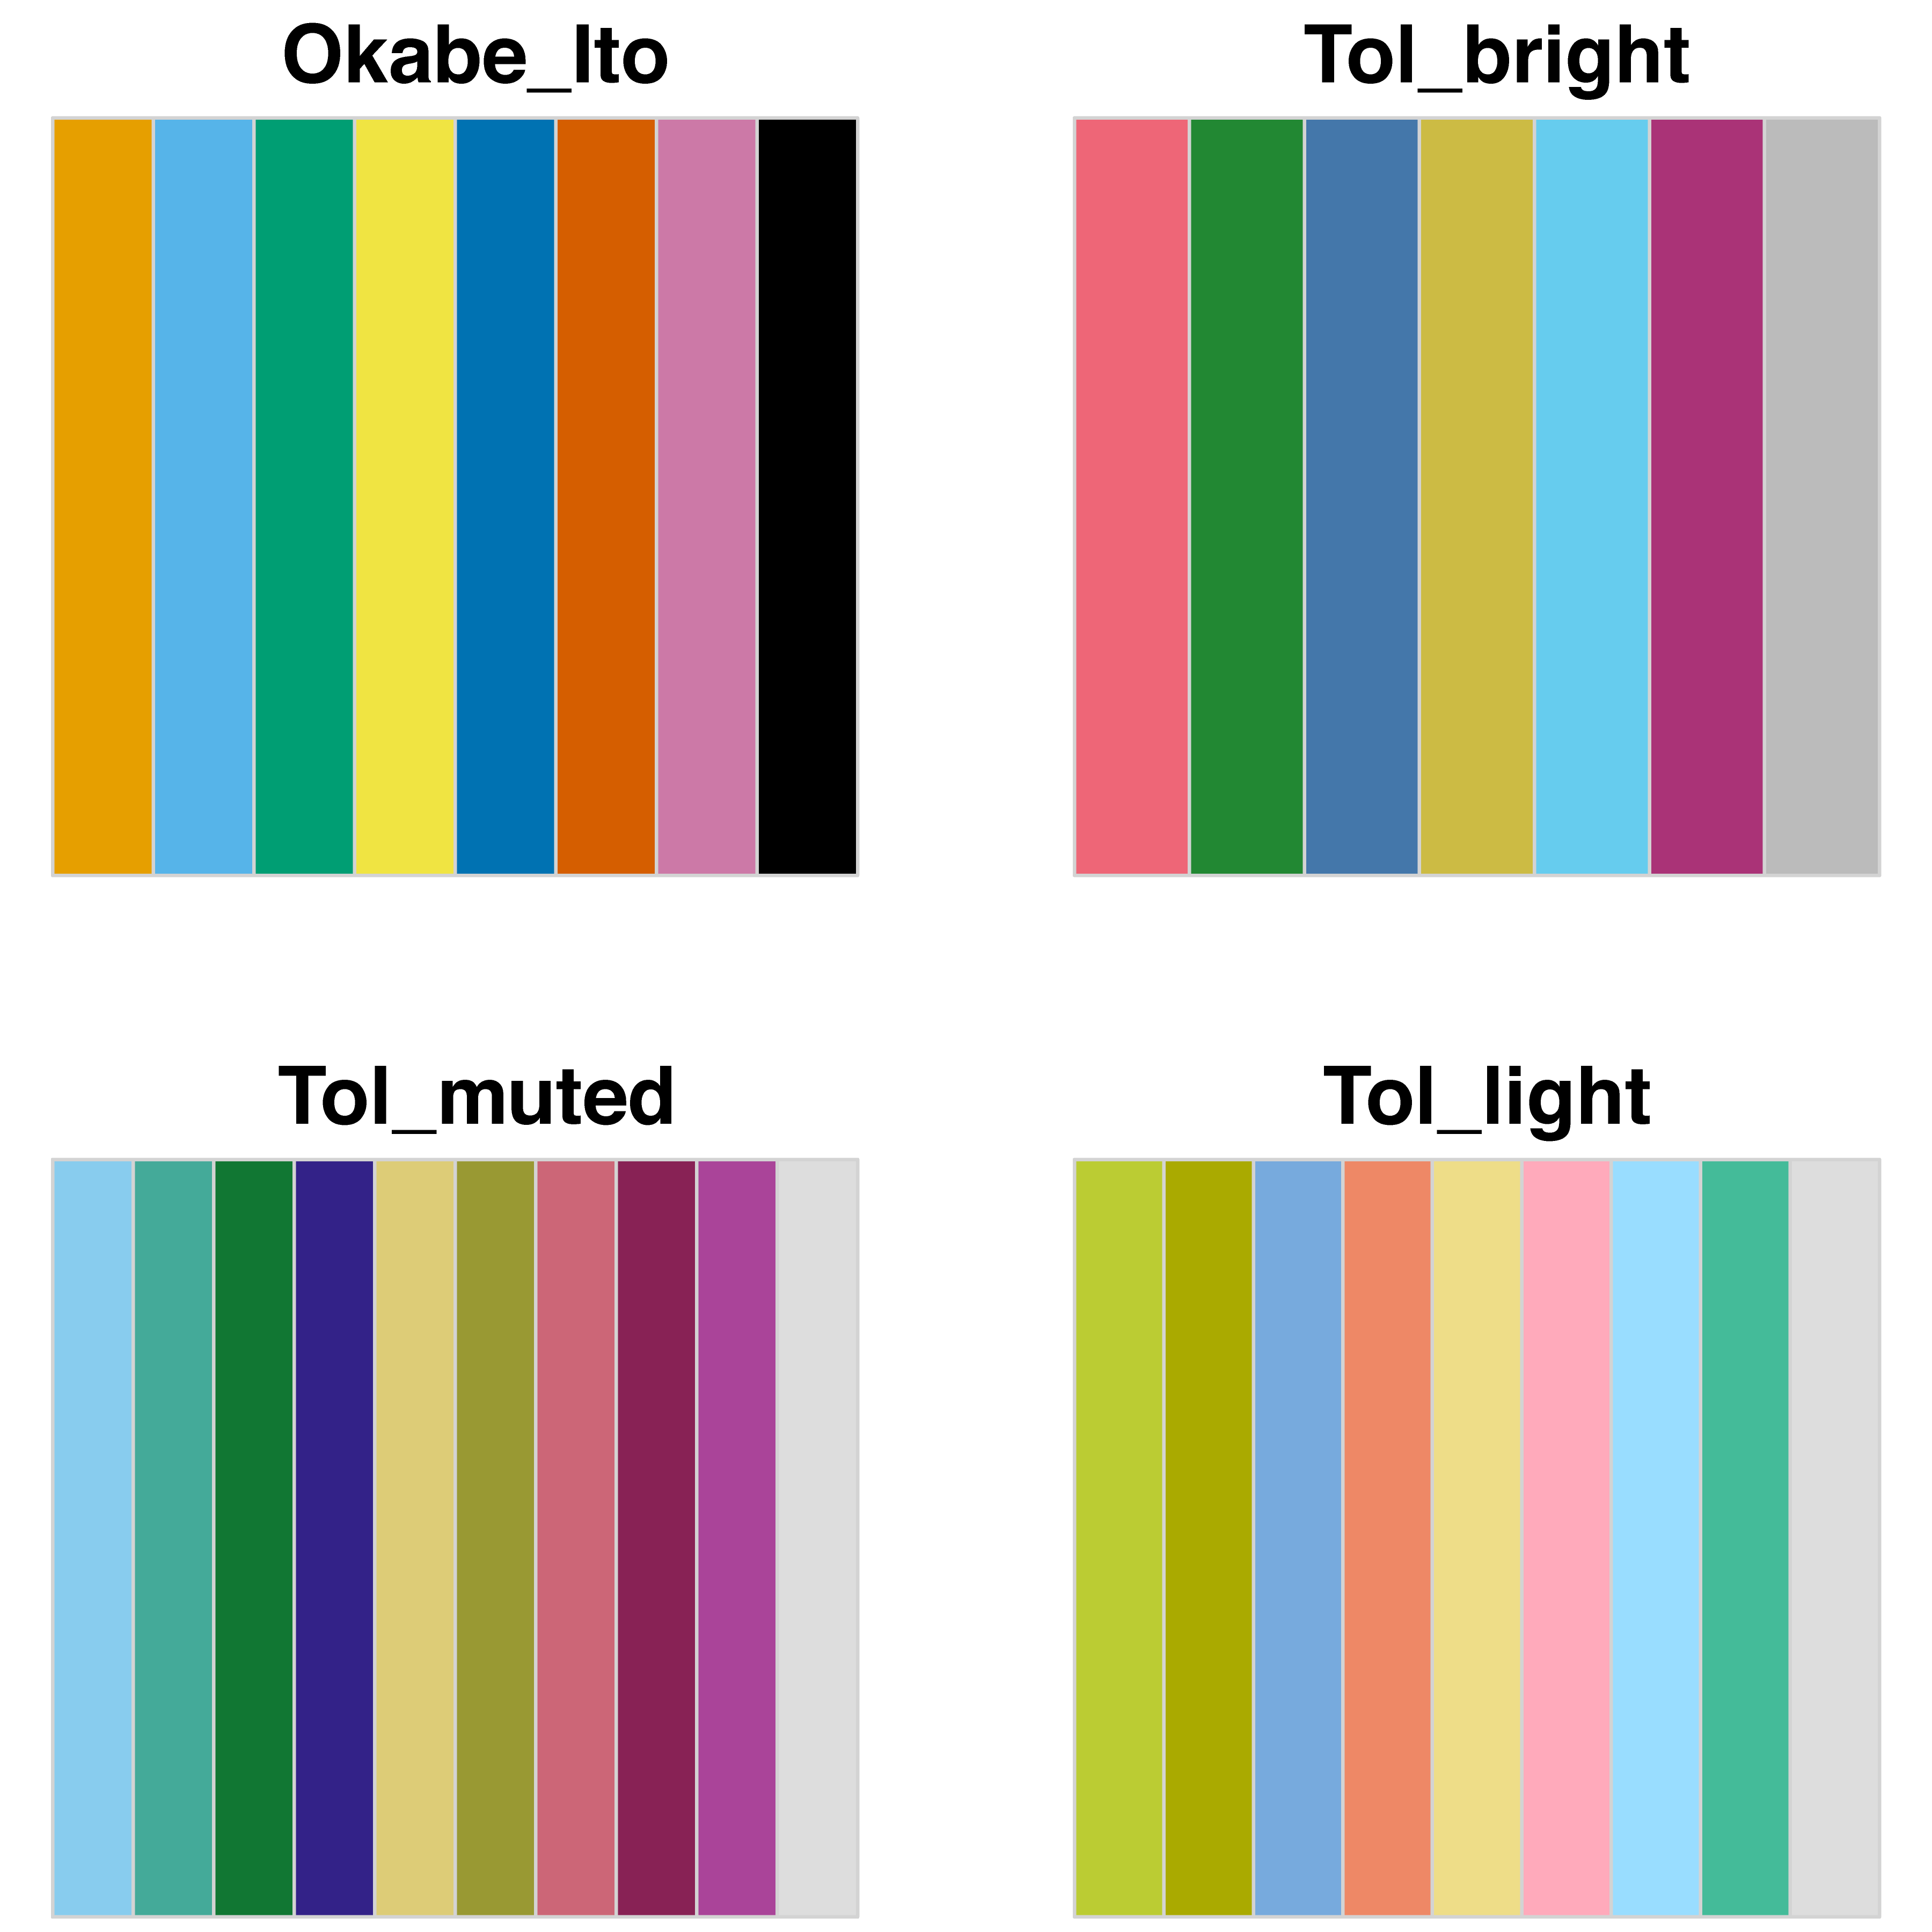
How to make colour blind friendly palettes, from regular contributor Jochim Goedhart.
Do you have a ‘how to’ you’d like us to commission? Or one you’d like to write yourself and share with the community?
Resources
Our Resources page contains a host of useful links for researchers, from advocacy and outreach to scientific databases.
Our full archive going back to 2010 is filterable by category, tag and date.

