A better bar
Posted by Joachim Goedhart, on 18 April 2018
After leaving the bar, what are we to do? I propose to move on to a better bar (and I hope that you will not be disappointed when you find out that I’m actually referring to an interval).
In a previous blog I advocated the transparent presentation and reporting of data in graphs. It was highlighted that 95% confidence intervals (95%CI) are the preferred indicator of uncertainty (Gardner and Altman, 1986; Cumming 2013).The 95%CI of the median can be indicated by notches in boxplots (Krzywinski and Altman, 2014). The calculation of this 95%CI is based on the interquartile range (McGill et al., 1978). However, this definition does not allow for asymmetric confidence intervals and may therefore not be ideal when samples sizes are moderate and distributions are non-normal or skewed. Here, I will discuss another method for calculating and visualising the 95%CI for the median, which is based on bootstrapping. The analysis and visualization is done using the open source software environment R & ggplot2 and the scripts are available here.
Asymmetry & the median
In our work, the distribution of measured values rarely adheres to a normal distribution. Skewed, or asymmetric distributions are commonly encountered. It has been put forward that the normal (or Gaussian) distribution is the exception rather than the norm (Wilcox, 2017). Moreover, when sample sizes are small, it is virtually impossible to determine whether it adheres to normality. In case of asymmetric distributions, the median is better measure of centrality (i.e. the typical or representative value of a sample) than the mean (Wilcox and Rousselet, 2017). As a consequence, it makes more sense to display medians instead of means when experimental data is visualised (footnote 1).
Bootstrap & the median
The bootstrap is a computational method that generates a large number of samples based on the existing experimental sample, instead of performing additional measurements (footnote 2). The bootstrap approach is a robust and versatile method that was introduced and popularized by Efron and colleagues (Efron, 1979; Efron and Tibshirani, 1986). It has been demonstrated to work (surprisingly) well. Its main powerful feature is that it can be used to derive statistics that are impossible to calculate directly. More details on bootstrapping can be found here and here). A brief description of the procedure follows. Suppose you have done a measurement and obtained a sample of 20 values. A random value is drawn from this experimental sample, and this is done 19 more times, to obtain a bootstrap sample (footnote 3). This procedure of resampling can be performed multiple times (usually somewhere between 1,000 and 10,000 times). The statistic of interest can be determined from each of the bootstrap samples. Figure 1 illustrates the bootstrap process for resampling the median 1000x (an animated version is available here).
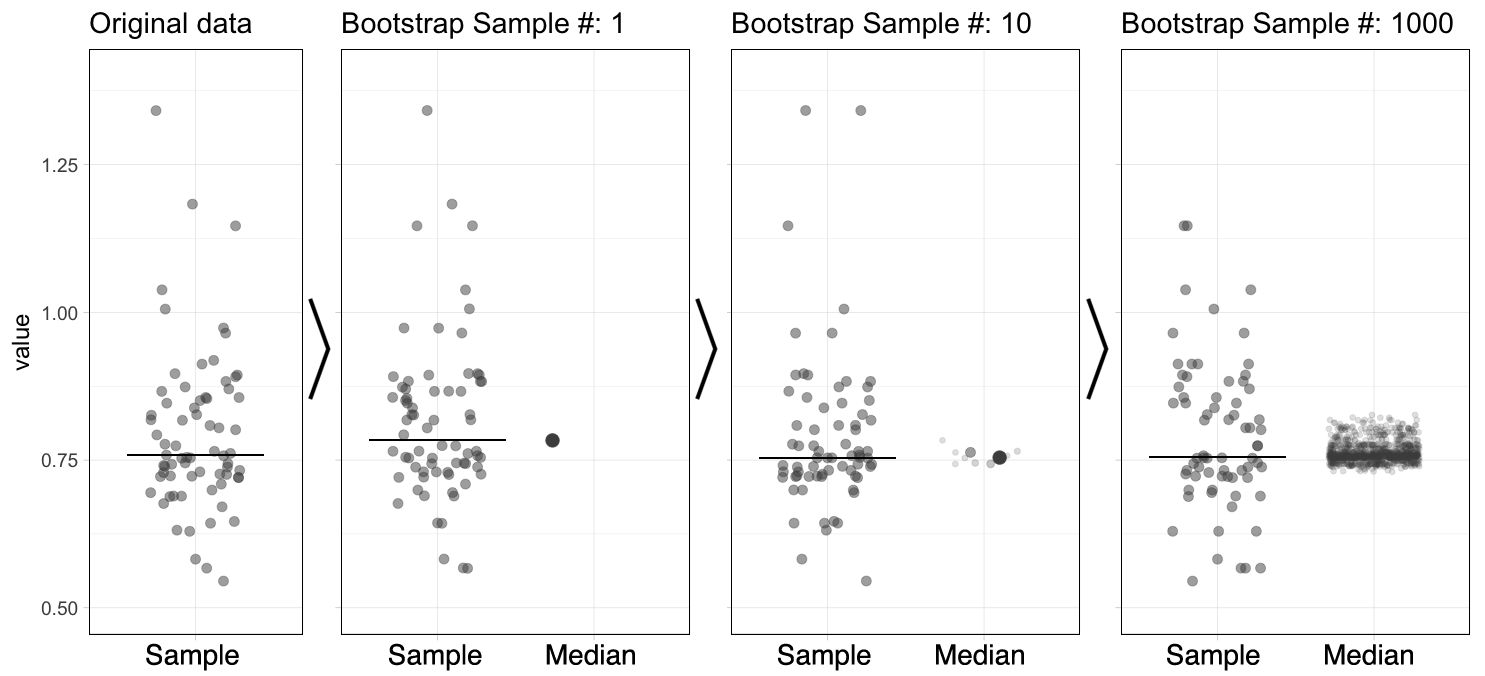
Figure 1: The principle of bootstrapping. The original data (left panel) is resampled to generate a bootstrap sample and the median is determined. This process is repeated many times (1000x in this example) to generate a collection of new median values. The median of the sample is indicated by the horizontal line and this new value is added to the collection of medians (indicated with the large dot). An animated version of this figure as well as R scripts to generate these figures are available.
Confidence & the median
The 95%CI is supposed to capture the statistic of interest 95% of the time, if the sampling was repeated multiple times. Repeated sampling is exactly what the bootstrap procedure is all about. Therefore, we can use the bootstrapped samples of the median to derive the 95%CI of the median (Wood, 2004). To this end, we rank the 1000 median values that were obtained by resampling from low to high. The 95%CI is now defined by the middle 95% of these values (footnote 4). In case of 1000 bootstrapped samples we use the 25th value and the 975th value of the ranked medians as the limits of the confidence interval. Figure 2 shows the histogram of the sampling distributions and the limits of the 95%CI as vertical lines.
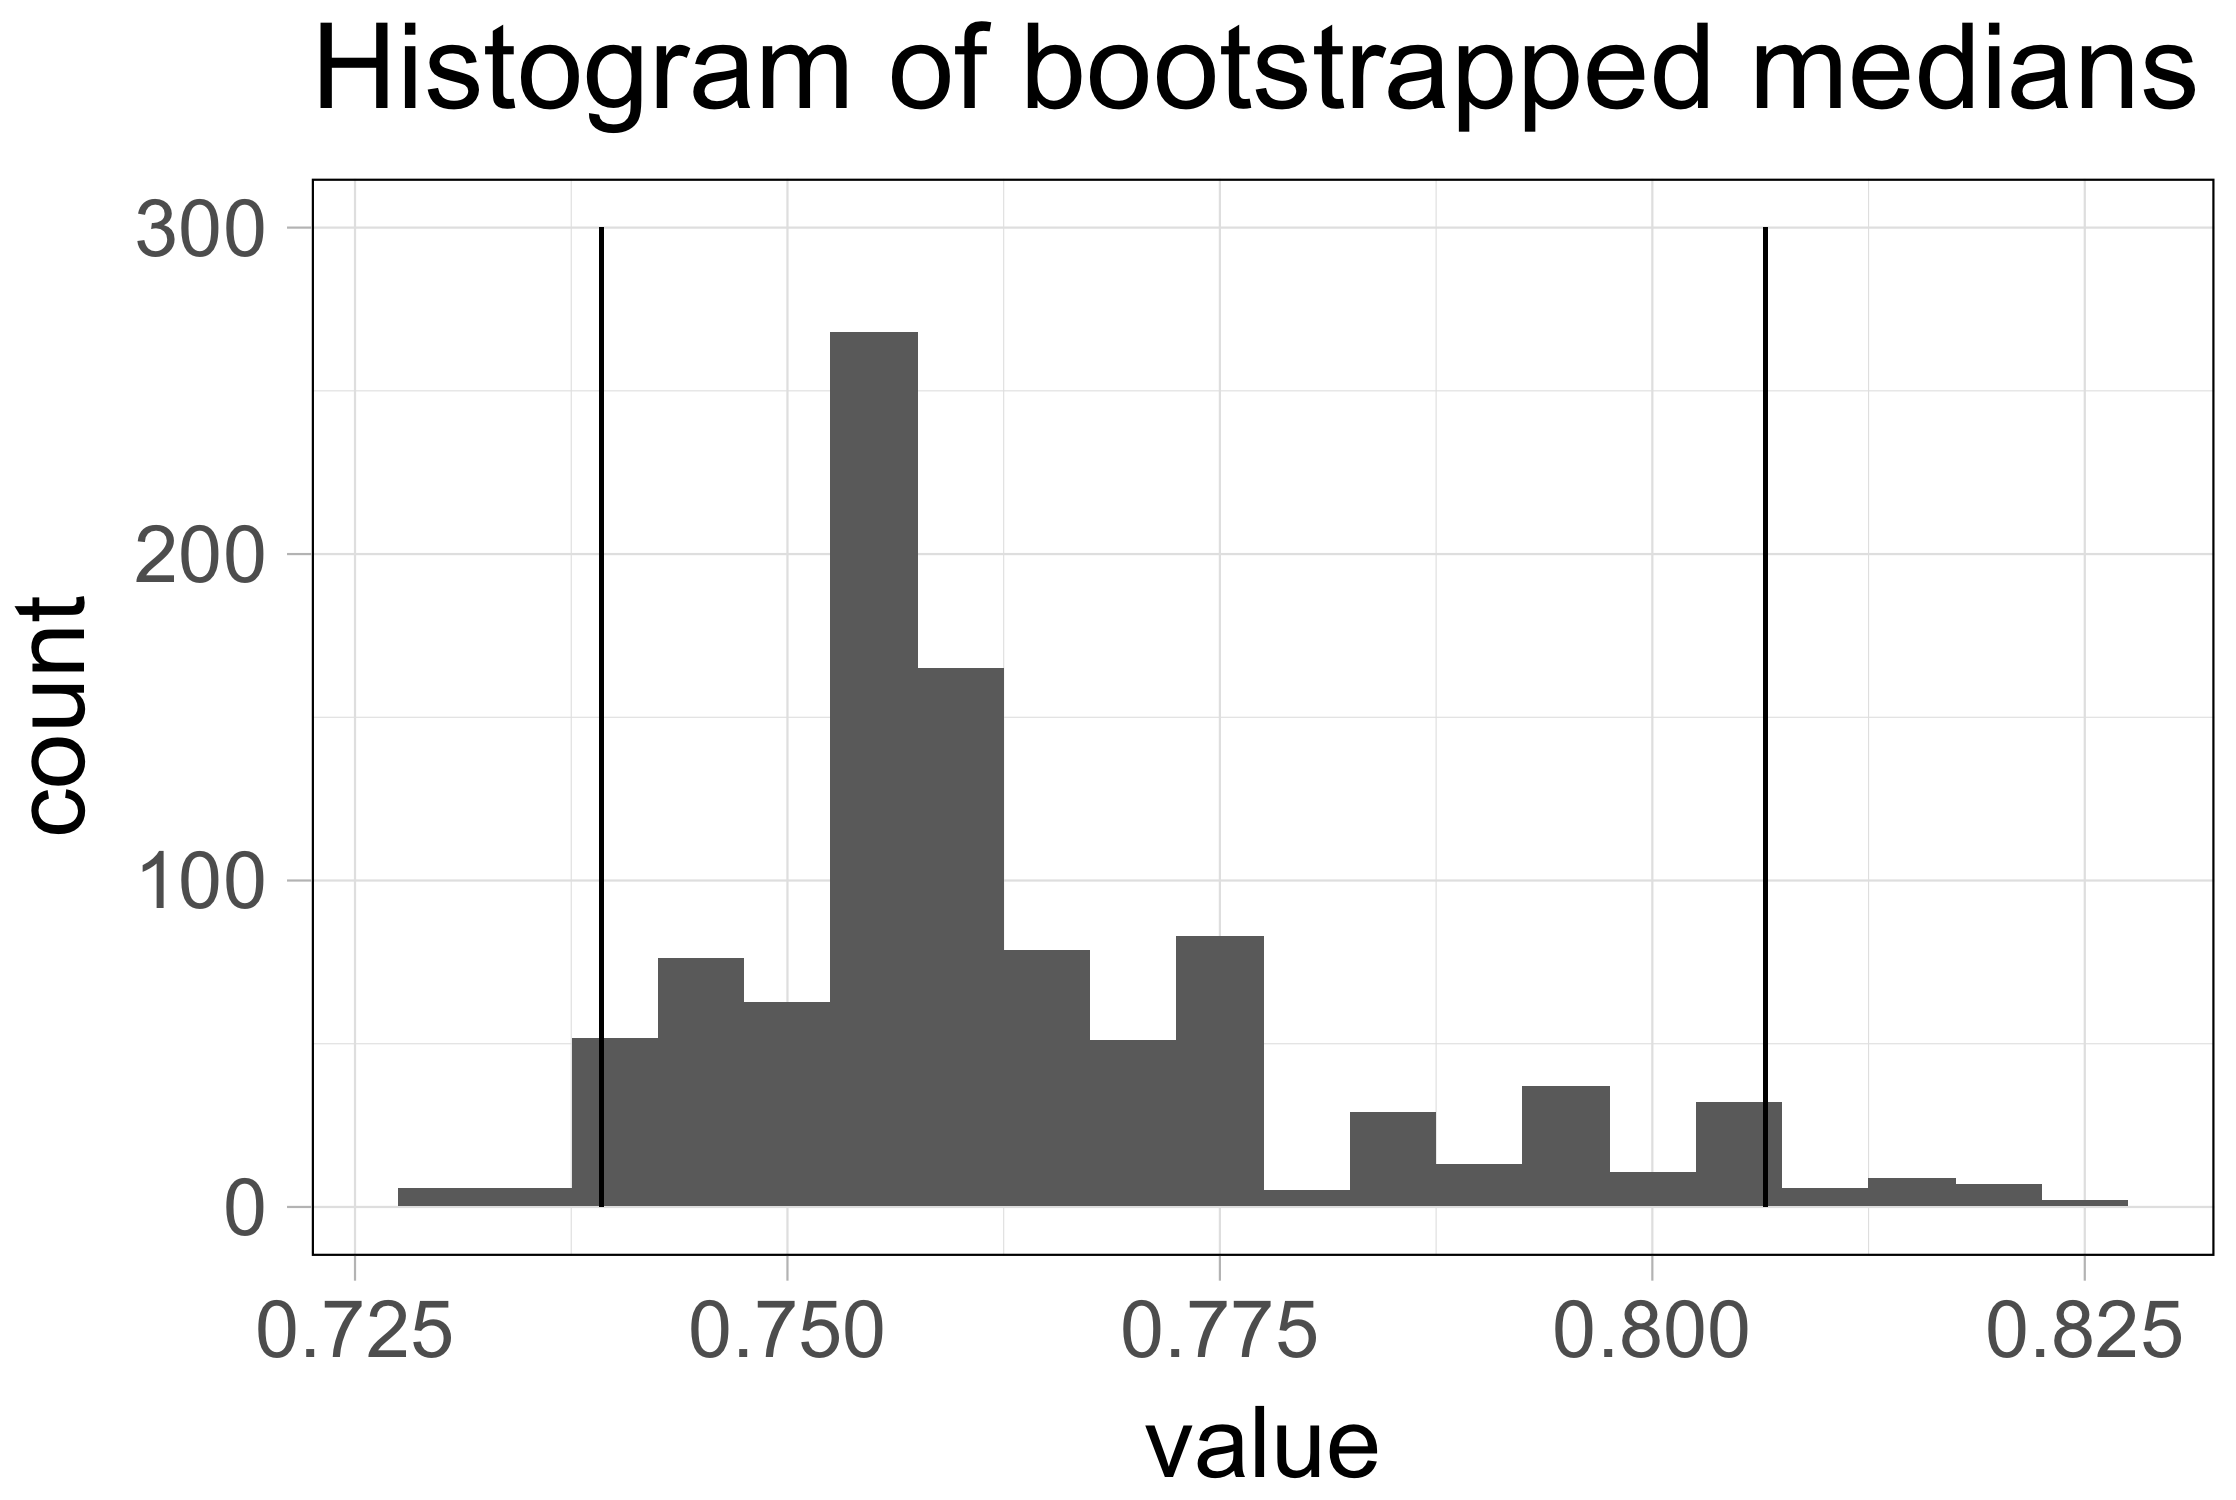
Figure 2: The distribution of 1000 median values obtained by bootstrapping (same data as used in figure 1). The vertical lines indicate the limits of the 95% confidence interval [0.74, 0.81].
Let’s get back to where it all started, i.e. better bars intervals. As an example I compare the data shown in a previous blog with the 95%CI determined as for boxplot notches and the 95%CI calculated by the percentile bootstrap (figure 3). The medians and the confidence intervals are shown below as grey bars (the raw data is left out of the plot to draw attention to the 95%CIs). The main difference between the two methods is the asymmetry of the confidence interval that was determined by bootstrapping which better reflects the underlying data.
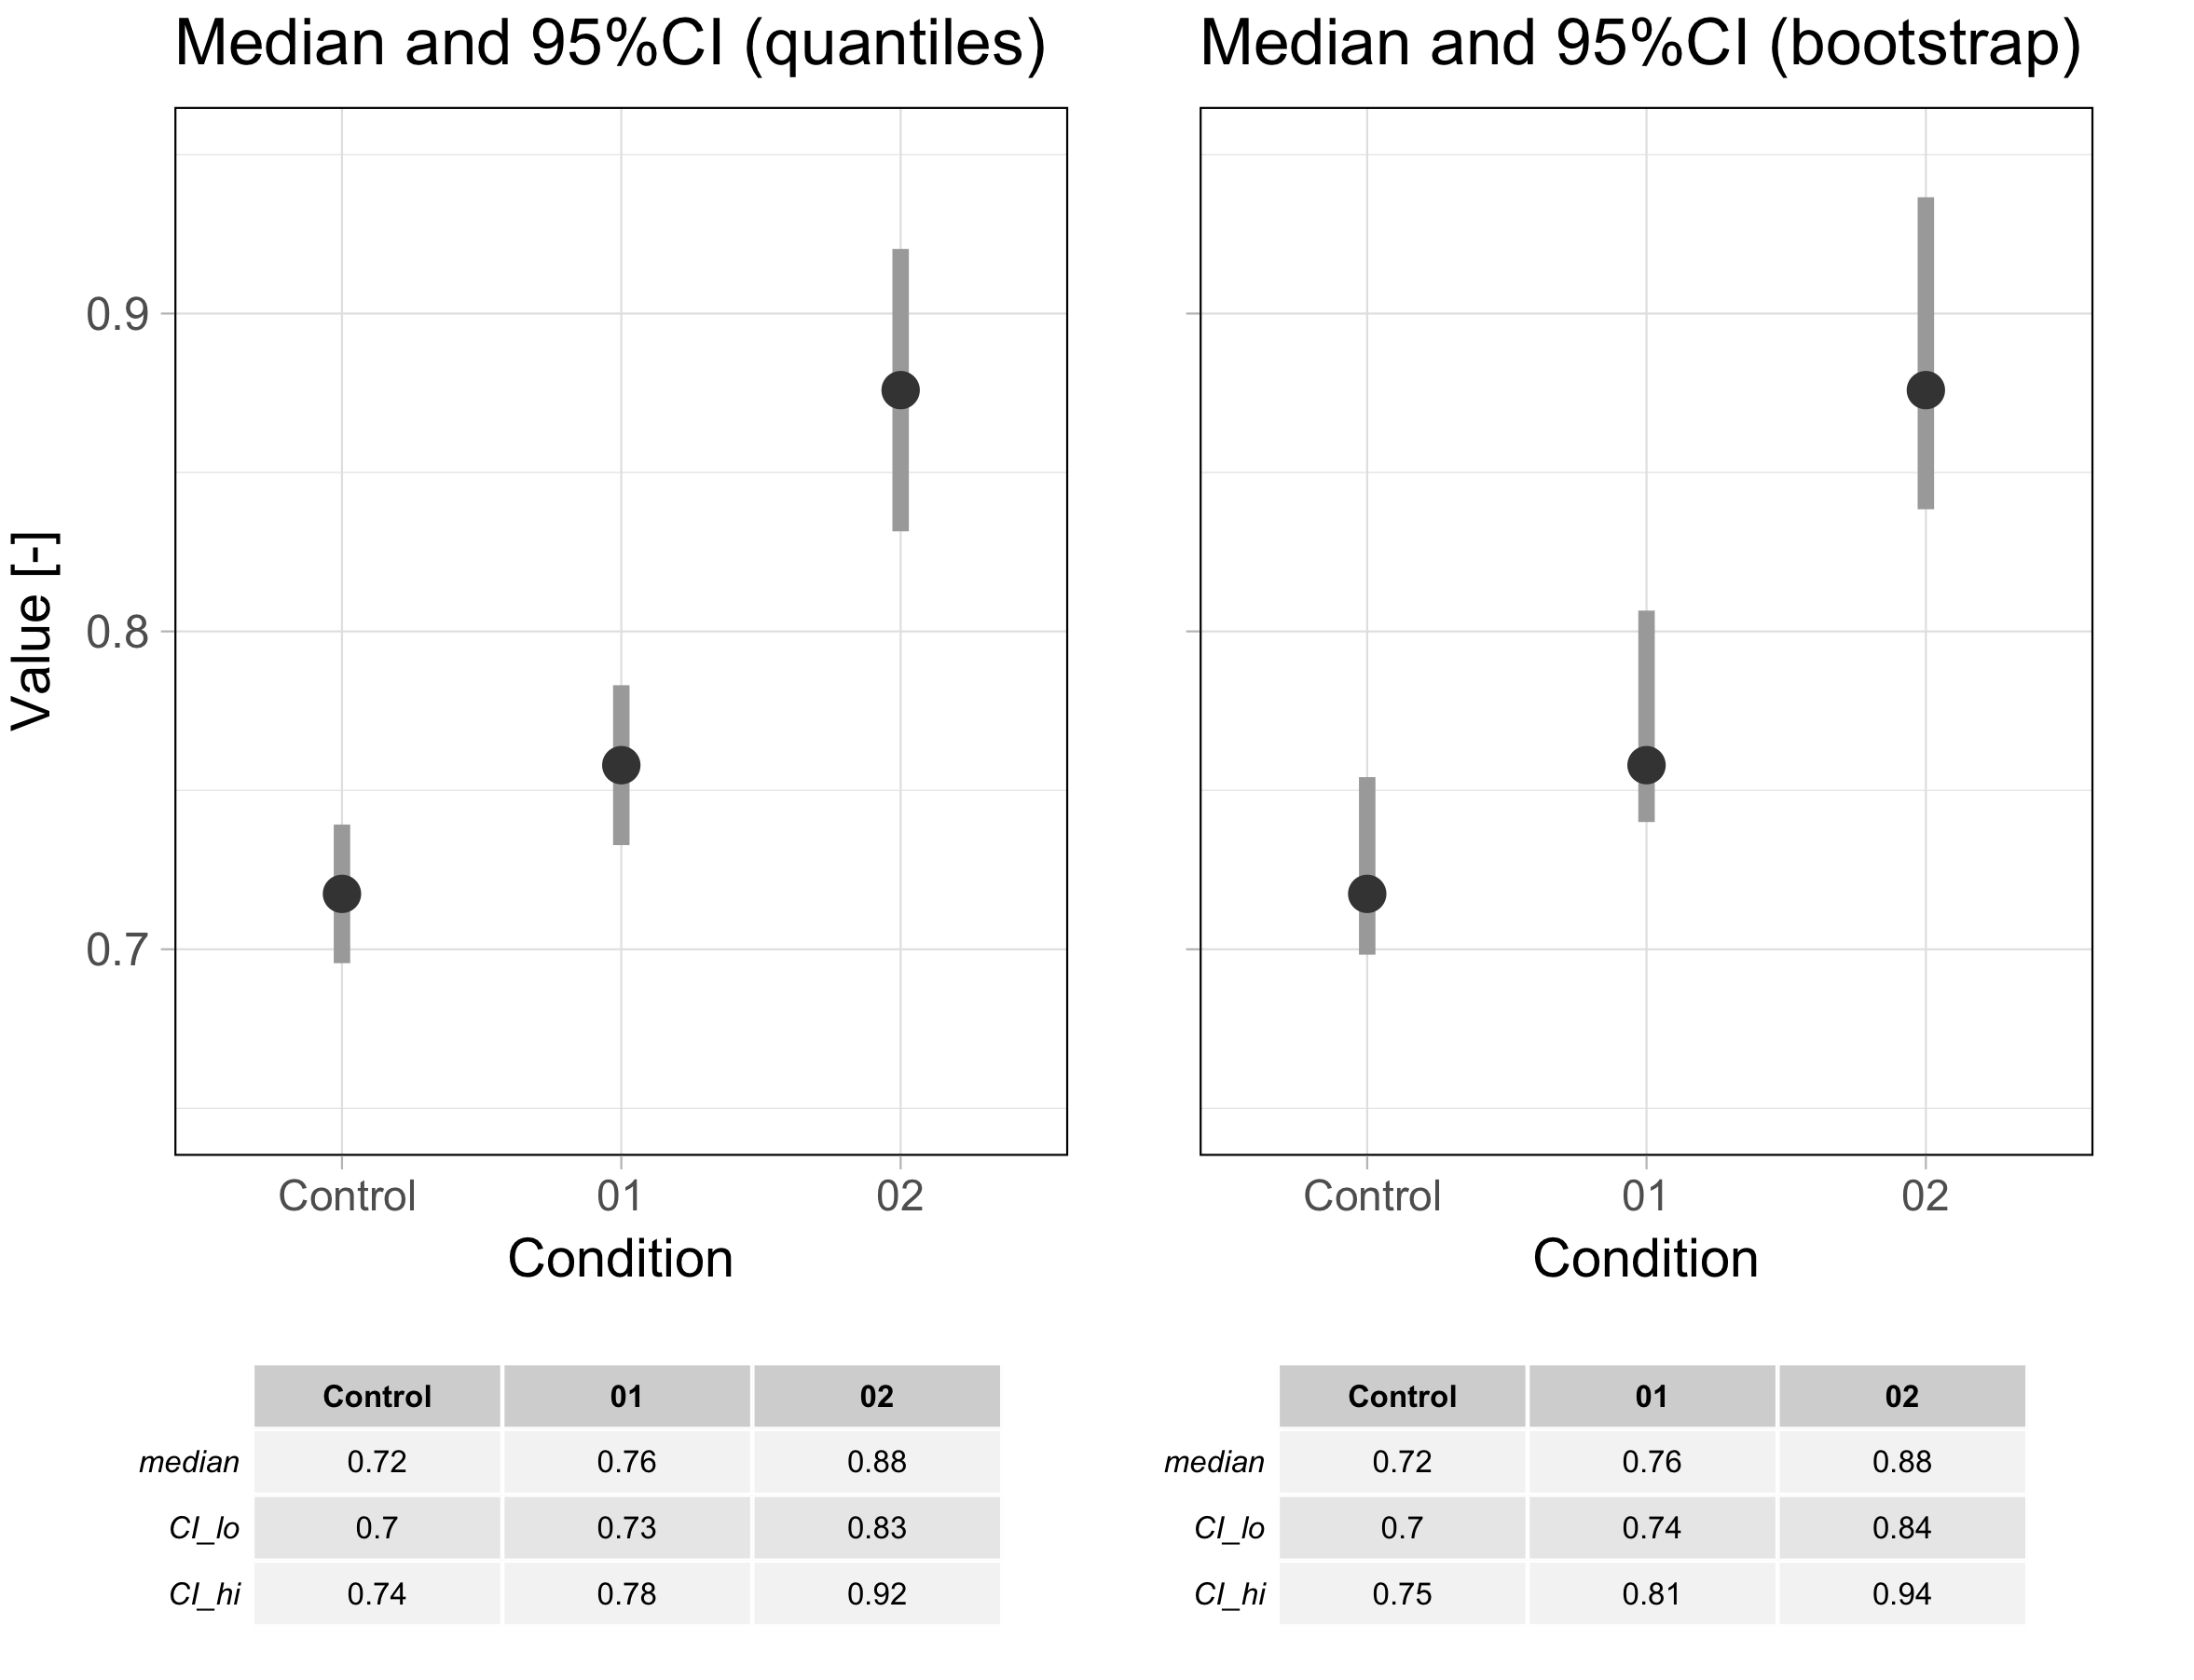
Figure 3: Comparison of the 95% confidence interval (indicated with a grey bar) as defined for boxplot notches (left) and determined by boostrapping (right). An R script to produce this figure is available here.
Final Words
The percentile bootstrap method for calculating confidence intervals for the median is “not bad”, but improved bootstrap methods are described (Hesterberg, 2015). There is also another way to determine a 95%CI of the median based on work by Hettmansperger and Sheather which is implemented in R (Wilcox and Rousselet, 2017).
Which of the methods for calculating the 95%CI works best for your data needs to be judged on a case-by-case basis. Only if the distribution of the population values is known, the best 95%CI can be identified by performing simulations. However, since the properties of the population distribution are usually unknown, a firm conclusion on the most accurate 95%CI is not possible. To conclude, I like the percentile bootstrap method for calculation of the 95%CI for the median since it is relatively accurate, intuitive and it allows for asymmetric intervals.
Shout-outs to:
–Peter Kamerman for the code on his blog that was used to calculate the 95%CI by bootstrap: https://www.painblogr.org/2017-10-18-purrring-through-bootstraps.
–Guillaume Rousselet for explaining the basics of robust methods and for sharing his insights on robust statistics in numerous blogs.
–Marten Postma for introducing me to bootstrap methods.
Footnotes
Footnote 1: The median is not a cure-all and has some issues of its own. Another robust measure of centrality for non-gaussian distributions is the trimmed mean. The accompanying R scripts can be modified to determine the 95%CI of a trimmed mean via the percentile bootstrap.
Footnote 2: To experimentalists, the bootstrap approach may seem like cheating. It is important to realize that the bootstrap method does not increase the number of datapoints. Instead, it is based on the concept that the existing sample represents the population and therefore can be resampled to obtain new samples that also represent the population that was originally sampled.
Footnote 3: In bootstrapping the resampling is performed with replacement, which means that the same value can be drawn multiple times.
Footnote 4: Since the confidence interval is based on the middle 95% of the distribution and the limits of the interval are based on ‘percentiles’ this procedure is also known as the percentile bootstrap.
 (3 votes)
2 thoughts on “A better bar”
Leave a Reply
Get involved
Create an account or log in to post your story on the Node.
Sign up for emails
Subscribe to our mailing lists.
Good idea. Bootstrapping is often a good solution, also to this issue.
But your suggested bootstrap interval will be somewhat “skewed” if you choose the 25th and 975th value among 1000. That would result in 24 values below the lower limit and 25 values higher than the upper limit.
Thanks for the comment. You raise an important issue that I really hadn’t thought about.
To calculate the 2.5th and 97.5th percentile I used the R function ‘quantile’ which has several options to calculate the percentile values (https://www.rdocumentation.org/packages/stats/versions/3.4.3/topics/quantile).
I use the default option that seems to work fine, but it something to consider.