Let’s move to 4D-biology: building the embryonic inner ear!
Posted by Cristina Pujades, on 26 January 2017
Comment on Distribution of neurosensory progenitor pools during inner ear morphogenesis unveiled by cell lineage reconstruction, eLife 2017; 6:e22268
Sylvia Dyballa and Cristina Pujades
Department of Experimental and Health Sciences, Universitat Pompeu Fabra, Barcelona, Spain
Reconstructing the lineage relationships and dynamic event histories of individual cells within their native context is central to understanding how the wide diversity of cell types develops during the construction of an organ. This is a long-standing challenge in biology, because up to now most efforts have been devoted to understand the genetic requirements for cell specification.
The inner ear is an attractive model to take on this challenge as it contains a manageable number of cell types, which develop rapidly on an organized schedule to generate the functional units of the mature organ – the sensory patches, containing supporting cells and hair cells innervated by the sensory neurons (Video 1).
Video 1: Innervated sensory patches in the embryonic inner ear. Animation of an embryo displaying the sensory patches with differentiated cellular neurosensory elements in green at 48hpf. Differentiated hair cells are innervated by sensory neurons of the SAG, which shows the typical segregation into anterior and posterior portion alongside with the segregated projections to the hindbrain.
During the last decades we learnt how neuronal vs. sensory specification was achieved, which signals from the surrounding tissues regionalized the otic vesicle along axes, and that the gradual restriction of cell fates over time was due to a multistep process. However, how sensory and neuronal progenitors behave throughout patterning, proliferation, and morphogenesis remained elusive, and it was difficult to reconcile some of the phenotypes observed in the signaling targeted mutants (Raft and Groves, 2015), due to the limited comprehension of how developmental gene regulatory networks are integrated. We thought that in vivo cellular data could address how patterns are achieved while the cells proliferate and the tissue undergoes morphogenesis, which may affect cell positioning and exposure to signals, and therefore cell specification. We were inspired by the pioneer work of Julien Lewis, who was able to foresee how things would work through in principle simple observations (Haddon and Lewis, 1996).
After a while trying to understand how the different progenitor pools were spatially organized within the otic vesicle using classical technics, it became clear to us that only imaging the whole developing inner ear and going from developed structures backwards in time to founder cells would help us to unveil the answer.
As you can imagine, this turned out to be a bit more complex than expected. It could only be accomplished through high resolution in vivo imaging, and considering that the otic vesicle undergoes extensive morphogenesis at the same time cells specify and proliferate it constituted a major challenge. It required simultaneously tracing the lineages while resolving the kinetics of cell proliferation and fate behavior. Recent developments in 4D-microscopy and cell tracking tools were being developed, but that was something that a small group could not afford to dream about. However, we were lucky enough to learn about the efforts of the lab of a former colleague, Nadine Peyrieras, in developing original methodologies and tools for the in vivo multiscale and multimodal observation of biological processes (Olivier et al., 2010; BioEmergences). After discussing with Nadine, we were excited because we felt we could participate in filling the void between gene regulatory networks and tissue architecture.
Our goal was to address two important questions: i) how neurons and hair cells are specified within similar domains of the otic epithelium; and ii) how from a simple otic epithelium this complex 3D-structure (the embryonic inner ear) is generated with the precise allocation of the neurosensory elements. We undertook this task without being conscious of the enormous effort and all the troubles we had to face, and combined high-resolution imaging with genetic tools using zebrafish embryos. It started our long journey in learning how to image for long periods of time using the best fluorophors, how to use new platforms for image processing, how to write in different programming languages (we became fans of coursera), and most importantly we had to change our prefigured ideas of how things work. Finally, we could record cell lineage information and observe at every time the spatial context of the cells within the whole otic vesicle! This period was very fruitful, and we realized how powerful these tools are and that we can use imaging for discovery.
Video 2: Early organization of neuroblasts within the SAG. Tg[cldnb:lynGFP]Tg[Brn3c:GFP] embryos injected with H2B-mCherry mRNA were imaged, and reconstructed cell centers were color-coded according to their location/identity (see legend). The projection view video (large panel) simultaneously displays the topological organization of cell groups selection and tissue architecture as a projection of the GFP channel (plasma membranes in grey) in x,y,z-axes. The distinct visualization modes displayed on the right hand side allow for a detailed 3D-visualization of data during the analyses. Orthogonal views are used to validate cell tracking, the oblique slice view allows orienting the orthoplane along the embryonic axes, and the rendering view permits to display validated cell centers in the context of the whole image volume.
These experiments led to understand the remodeling of the neuronal progenitor domain upon neuroblast delamination (Figure 1), and revealed that the order and place of neuroblasts’ delamination from the otic epithelium prefigure their position within the statoacoustic ganglion (SAG) (Video 3). Up to date, we knew neuroblasts were exiting the otic epithelium by a process called delamination, and they formed the SAG beneath, but we could not imagine the impact that delamination and morphogenesis had in the spatiotemporal distribution of neurosensory cell progenitor pools. By following the individual progenitors we unveiled that approximately 25% of the cells of the otic vesicle delaminate within few hours, and that the homeostasis of the system was maintained, most probably due to the proliferative capacity of the non-sensory epithelium. The developmental strategy used by distinct progenitor populations differed: neuronal specification is concomitant with proliferation (before/after delamination), while hair cell specification and differentiation lead to postmitotic cells indicating that the final number of sensory cells relies on the control of the progenitor pool.
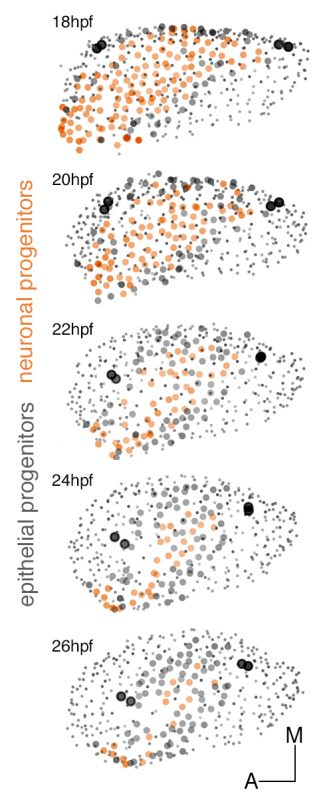
Figure 1: Dynamic map of neuronal progenitors (orange circles) and their epithelial neighboring cells (grey circles) in the context of the whole otic vesicle (grey dots) over time. Color intensity of cell centers depicts the position of cells along the dorsoventral axis of the otic vesicle. The map was built after following the lineages from 18hpf to 26hpf of all encircled cells. Note how neuroblast delamination impacts on the size and position of the progenitor domain (orange circles) over time.
Video 3: The order and place of delamination foreshadows their location within the SAG. A cohort of 144 delaminated neuroblasts was analyzed for time and place of delamination. Reconstructed cell centers were color-coded according to four delamination intervals: 18-20hpf white, 20-22hpf yellow, 22-24hpf orange, 24-30hpf red, or for position along the anteroposterior (AP) axis in the otic epithelium and followed from 18hpf to 30hpf. Note that neuroblasts exit randomly from the delamination domain; those delaminating earlier are located more medially in the SAG than the later delaminating ones prefiguring the gradient of differentiation (middle panel). The relative position of neuroblasts along the AP is maintained from the otic epithelium to the SAG (right hand side panel). Reconstructed cell centers were displayed as colored dots together with the corresponding volume rendering images (plasma membranes in grey).
Moreover, we provide the dynamic map of neurosensory progenitors based on in vivo cell lineage studies (Video 4) supplying a global and temporal perspective to previous otic neurosensory lineages analyses, which were mainly focused on the spatial dynamics of gene expression (Durruthy-Durruthy et al., 2014).
Video 4: Maps of neuroblasts and posterior macula hair cell progenitors in the whole otic vesicle. The neuronal progenitors (orange) and the posterior macula hair cell progenitors (blue) are plotted in the context of the whole otic vesicle (grey dots) at 24hpf. Tether cells are shown as black circles. The animation displays a rotation of otic vesicles around the anteroposterior axis. Note that the two progenitor domains are adjacent, and neuroblasts are located more ventrally while sensory progenitors are more medially.
We are very enthusiastic with this paper because the information about cellular/population dynamics and lineage relationships of neurosensory elements in the inner ear enables us to understand the proportions of the system and provide the cellular data to complement the well-described gene regulatory networks involved in neurosensory specification. We are convinced that for the understanding of how the developmental gene regulatory networks function during tissue degeneration and regeneration, as well as in normal patterning, we need to move forward into 4D-imaging and put previous knowledge in the context of the dynamics of the system.
References
Durruthy-Durruthy, R., Gottlieb, A., Hartman, B. H., Waldhaus, J., Laske, R. D., Altman, R. and Heller, S. (2014). Reconstruction of the mouse otocyst and early neuroblast lineage at single-cell resolution. Cell 157, 964–978.
Dyballa, S., Savy, T., Germann, P., Mikula, K., Remesikova, M., Špir, R., Zecca, A., Peyriéras, N. and Pujades, C. (2017). Distribution of neurosensory progenitor pools during inner ear morphogenesis unveiled by cell lineage reconstruction. Elife 6: e22268.
Haddon, C. and Lewis, J. (1996). Early ear development in the embryo of the zebrafish, Danio rerio. J. Comp. Neurol. 365, 113–128.
Olivier, N., Luengo-Oroz, M. A., Duloquin, L., Faure, E., Savy, T., Veilleux, I., Solinas, X., Debarre, D., Bourgine, P., Santos, A., et al. (2010). Cell Lineage Reconstruction of Early Zebrafish Embryos Using Label-Free Nonlinear Microscopy. Science 329, 967–971.
Raft, S. and Groves, A. K. (2015). Segregating neural and mechanosensory fates in the developing ear: patterning, signaling, and transcriptional control. Cell Tissue Res 359, 315–332.
 (2 votes)
Get involved
Create an account or log in to post your story on the Node.
Sign up for emails
Subscribe to our mailing lists.
Read the latest Development issue
Most-read posts in June
- From Posters to Parades: Inside Woodstock.Bio² & Night Science Conference by Natanella Eliaz
- Visualizing with Vibes: Potential and Pitfalls by Joachim Goedhart
- Cellular Worlds – An Art Exhibition Inspired by Microscopic Universes
- On the Shape of Life: meeting report, SFBD meeting 2025 by Girish Kale
- #DanioDigest (May 2025) by Kevin Thiessen
- Squishing jellies!! by Yamini Ravichandran
- Lab meeting with the Silveira Lab
- SciArt profile: Henning Falk