Prevent p-value parroting
Posted by Joachim Goedhart, on 1 February 2018
Recently, Nature published my correspondence “Dispense with redundant P values”. It highlights my concern that p-values are often calculated because “everybody does it”. This reminded me of the mechanical repetition that parrots are well-known for (footnote 1). Parroting of p-value reporting should stop and I suggest to only present a p-value in a figure if it is necessary for interpretation.
During the editing process of my contribution a specific example of a redundant p-value was removed. The reasoning was that it seemed unfair to single out only one paper. I agreed and I would like to stress that parroting of p-value reporting is not restricted to a specific paper, a specific issue of Nature or to some specific journal. It’s just that I found it very ironic that in the same issue of Nature that proposes “Five ways to fix statistics” (Leek et al., 2017) there are several clear examples of figures (in different papers) with meaningless p-values.
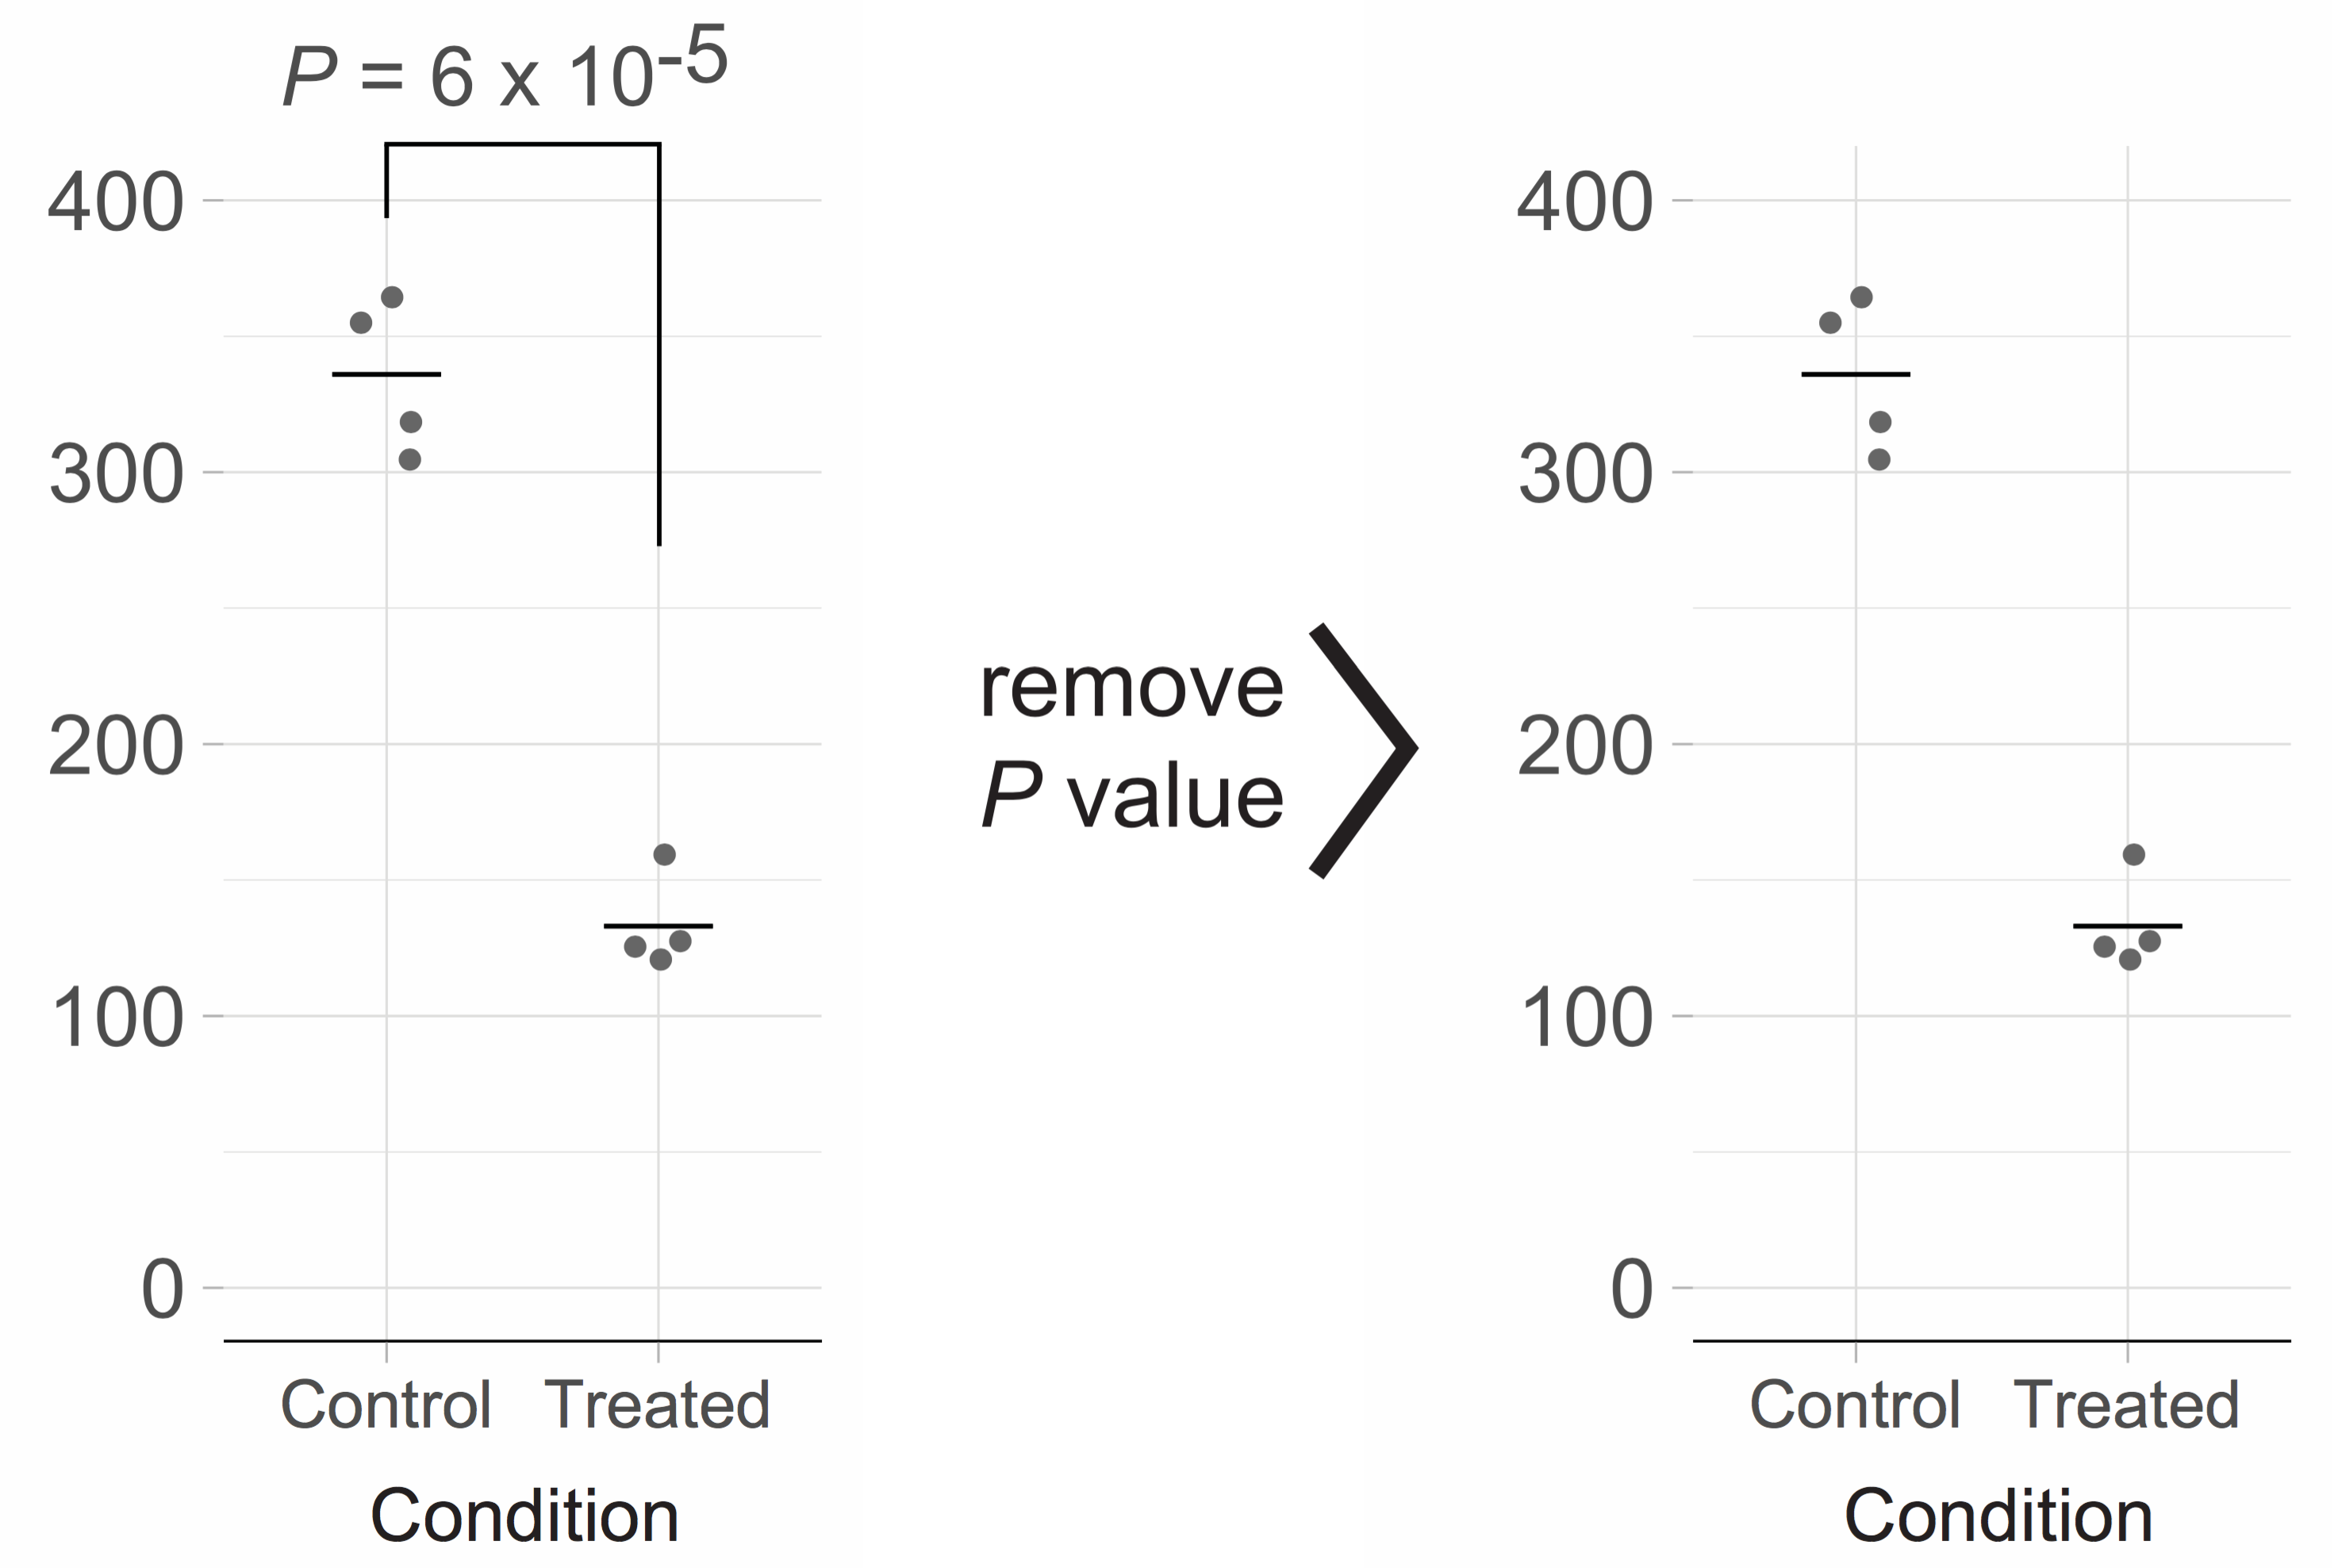
Since I am convinced that an example will clarify my point, I have extracted the data (see footnote 2) from one of the papers in the aforementioned issue (without disclosing the nature of the paper). I performed a t-test (two-tailed, unequal variances) as described in the paper and reproduced the p-value (footnote 3). The resulting figure is shown below on the left and closely mimics the figure of the original paper.
Clearly, there is a large difference between the ’Control’ and ‘Treated’ condition, reflecting a large effect of the treatment. To reach that conclusion, there is no need for a p-value. Moreover, the p-value does not convey any relevant information for interpretation of the figure. As such, the p-value qualifies as chartjunk (E.R. Tufte, 1983) and should be omitted. This will generate a cleaner figure (shown above on the right) that emphasizes the data.
The problems with p-values are larger than their meaningless use in figures whenever the effects are large. The way that p-values are defined has some confusing backward logic (footnote 4). Consequently, p-values are often misinterpreted (Greenland et al., 2016, Lakens, 2017) or misused as a ‘measure of credibility’ (Goodman, 2016). The misconception that p-values represent the strength of evidence is reinforced by catogerizing p-values, e.g. by using increasing number of asterisks (e.g. * P < 0.05; ** P < 0.01; *** P < 0.001). P-values cannot be used as a rating system (Wasserstein and Lazar, 2016) and categories should be avoided at all times.
To avoid the unnecessary, and at times misleading, use of p-values, the mechanical repetition of current practices should stop. Whether p-values are important for the interpretation of the figure should be a central question. Before that question can be answered, the correct definition of a p-value needs to be thoroughly understood. In addition, the correct interpretation and common misconceptions (Greenland et al., 2016) of p-values should be considered. I hope that careful reflection on the meaning of p-values will decrease their use and improve figures.
Acknowledgments: I am indebted to Marten Postma for the many discussions about statistical concepts and applied statistics, that have increased my understanding of the topic.
Footnotes
Footnote 1: The original title of my correspondence was “Prevent p-value parroting”. This title was changed to “Dispense with redundant P values” by Nature after I returned the proofs and without consulting me.
Footnote 2: The raw data that I extracted is listed below in csv format:
Condition,Value
Control,305
Control,318
Control,355
Control,364
Treated,160
Treated,125
Treated,120
Treated,127
Footnote 3: This is an example of yet another questionable practice, i.e. calculating a p-value for a dataset with only a couple of datapoints per condition. Ironically, several examples can be found in the aforementioned issue while this matter has also been addressed previously by David Vaux (2012) in Nature (and by many others as well).
Footnote 4: The p-value is the probability of the observed data (or more extreme values), assuming that the null-hypothesis (there is zero difference between the two conditions) is true.


 (19 votes)