Data mining with Manteia
Posted by otassy, on 15 November 2013
Following the publication in Nucleic Acids Research of my new database that I developed in Olivier Pourquié’s lab, I would like to introduce you to Manteia http://manteia.igbmc.fr/. This database contains a lot of information (genomic, regulation, interaction, phenotype, disease etc …) for animal models (mouse, chicken, zebrafish) and man. These data are all formatted so they can be used together. In a same species, this makes it possible to ask complex questions by combining different types of data, but you can also use data from different species in order to supplement them or make predictions.
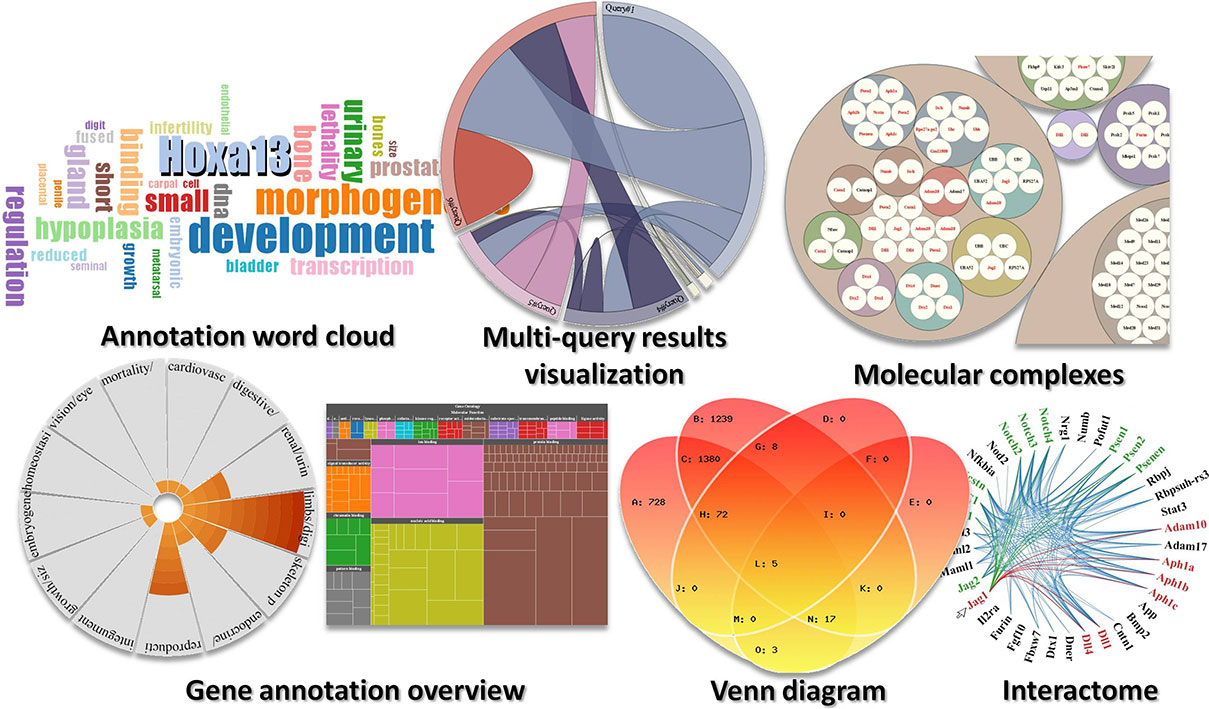
Mining huge complex datasets usually requires computer skills that few biologists have. However the user interface available for most public databases is too basic to really give a biologist the freedom to study all these data as a whole and make new discoveries. This is why I have developed new easy to use data mining and visualization tools for Manteia. One of these tools is called Refine. It allows to break down a complex biological question into multiple simple queries. For example, to identify candidate genes potentially involved in human muscle diseases using mouse phenotype data while taking into account a linkage analysis, one will select the genes corresponding to the chromosome region of interest using a tool called “chromosome location”, then from the result page one will search for their mouse orthologs using the “orthology” tool to finally find the genes involved in muscle phenotypes using “phenotype” or involved in myogenesis using “gene ontology “. The whole process takes a few seconds and gives the researchers the freedom to test different strategies to refine their list of candidates.
Another search tool is called “Query Builder “. This tool uses a simple interface to create complex queries such as: “I am looking for genes belonging to the Wnt signaling pathway and involved in somitogenesis but not in myogenesis” using Boolean operators (and, or, not). Several independent queries can be addressed at the same time. This is particularly useful when one is looking for genes that could explain a patient’s clinical features. In this case a query will be designed for each feature and the system will order the genes by relevance without discarding those that do not correspond to all of the symptoms. Every datasets can be used together to create a query. Whether to make predictions, test hypotheses or analyze experimental results.
Manteia is not limited to the selection of genes based on their annotation. Datasets can be analyzed statistically to see if they tend to be involved in the same biological functions, in the same signaling pathways, if they come from the same chromosomal regions etc. … this is particularly useful for analyzing deregulated genes from microarray or RNA seq experiments. These statistical tools can also be used to see which annotations are correlated to check, for example, if the genes involved in a biological process or a disease belong to the same signaling pathway.
There are a lot more things you can do with this system. Feel free to read the article (http://nar.oxfordjournals.org/cgi/content/full/gkt807?ijkey=8NMUhzVEjkVGdGw&keytype=ref) and watch our tutorial videos to learn more about Manteia. The release of the paper is not the end but the beginning of the project. Feel free to give your impressions on this database, make suggestions to improve the user experience or suggest new data to be entered in the system.
Enjoy. http://manteia.igbmc.fr/
 A few examples of data visualization tools from Manteia


 (8 votes)