Protocols for data visualization
Posted by Joachim Goedhart, on 27 October 2022
Scientists are familiar with protocols that describe in a step-by-step fashion how an experiment is performed. But they are usually less familiar with code or scripts for handling data. Yet, experimental protocols and computer instructions have a similar structure and purpose. Therefore, it should be within reach for experimental scientists to add coding skills to their toolkit. This is a very valuable skill to have as it enables automated, reproducible data processing and visualization. To lower the barrier for using R and the ggplot2 package for data visualization, I have written a book that is available online: https://joachimgoedhart.github.io/DataViz-protocols/
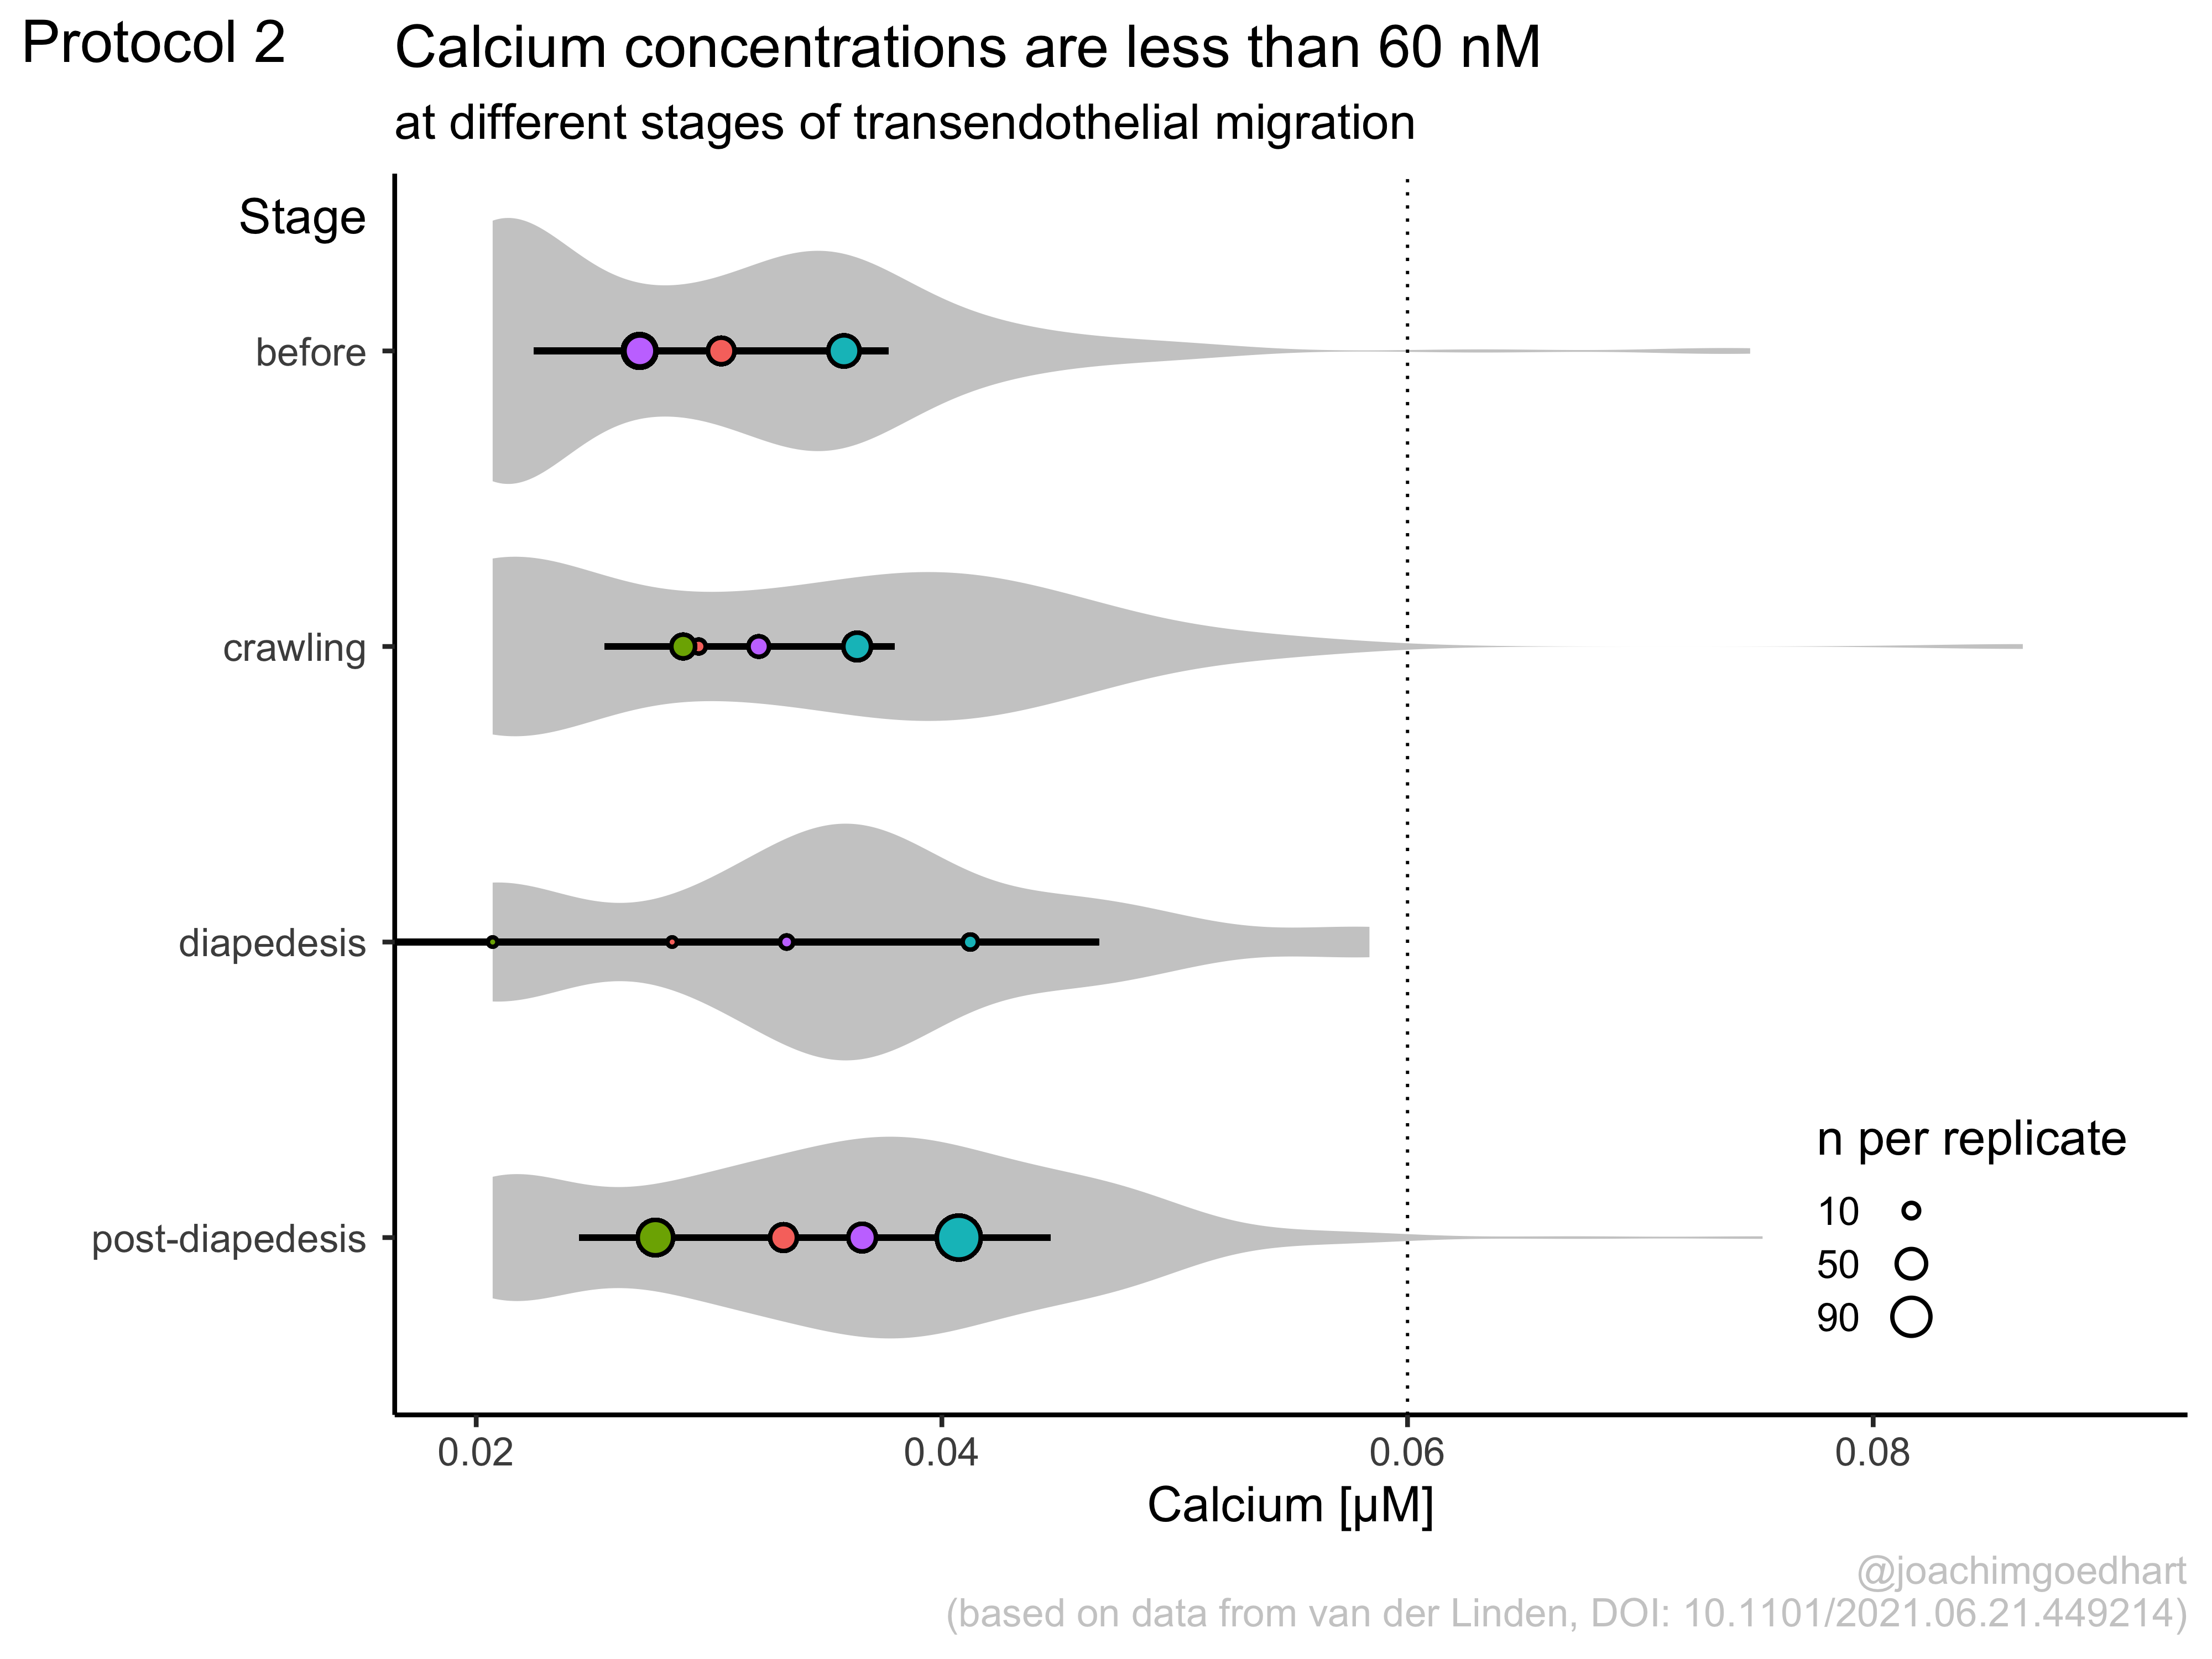
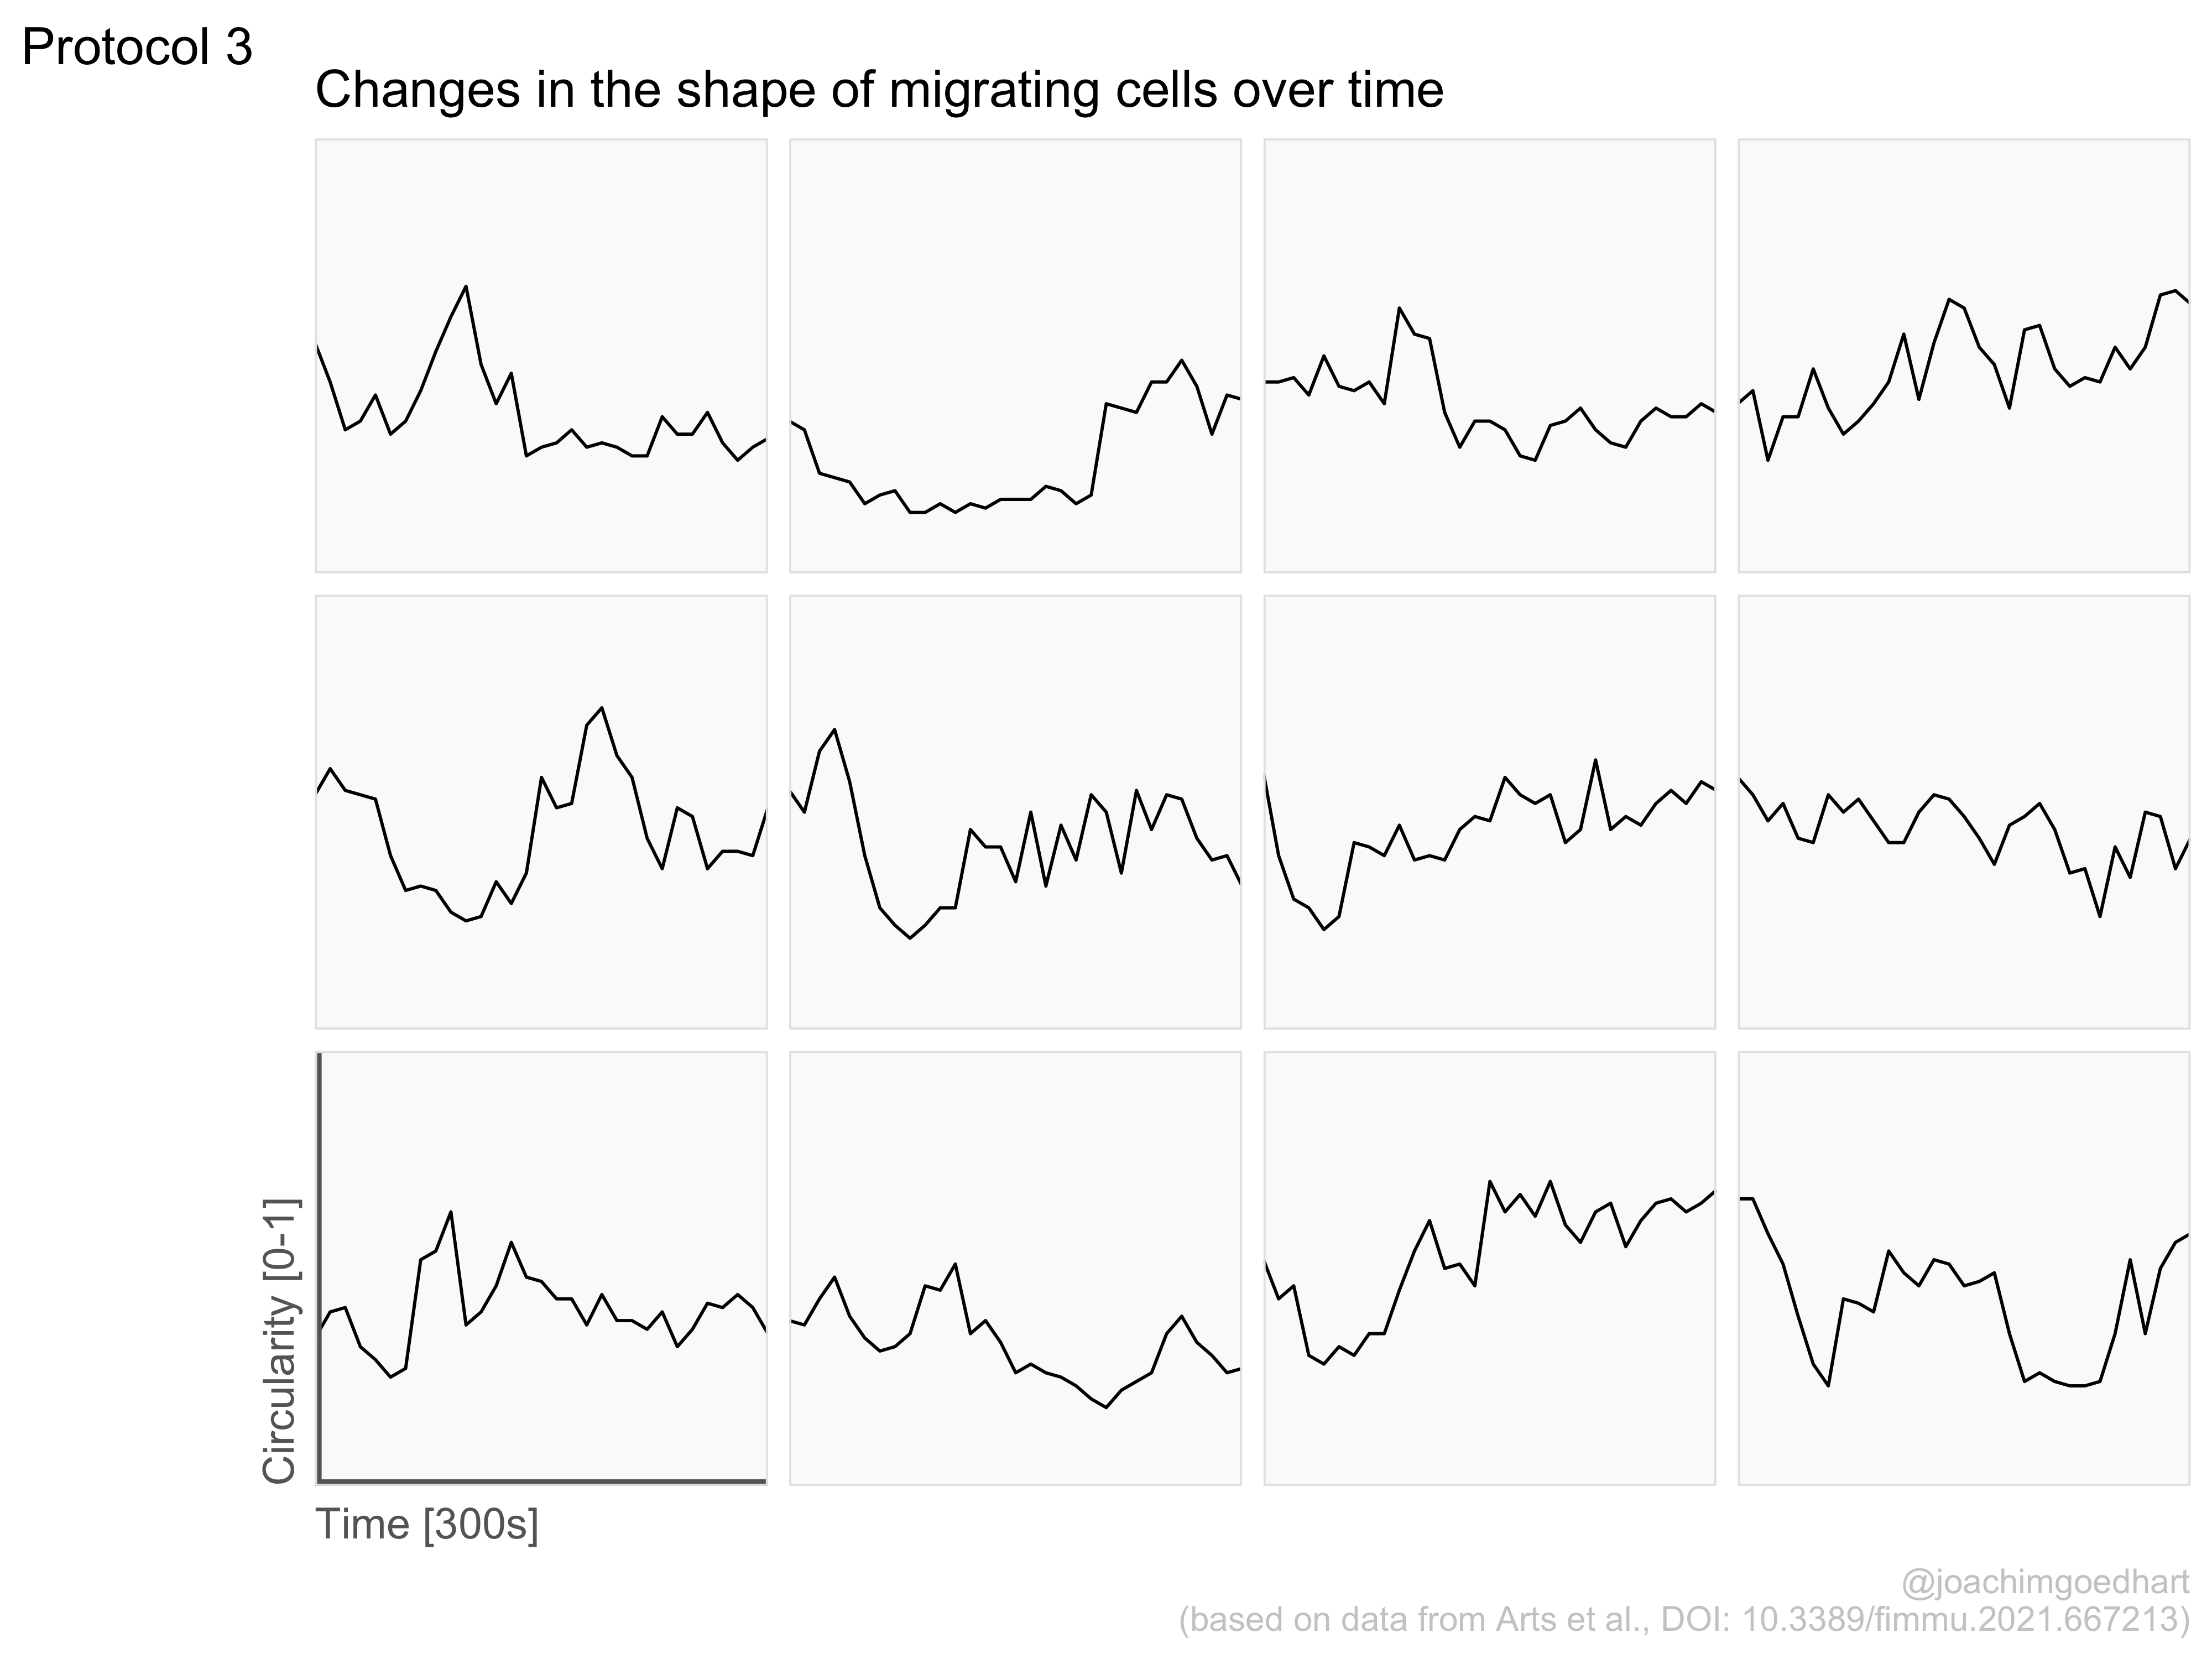
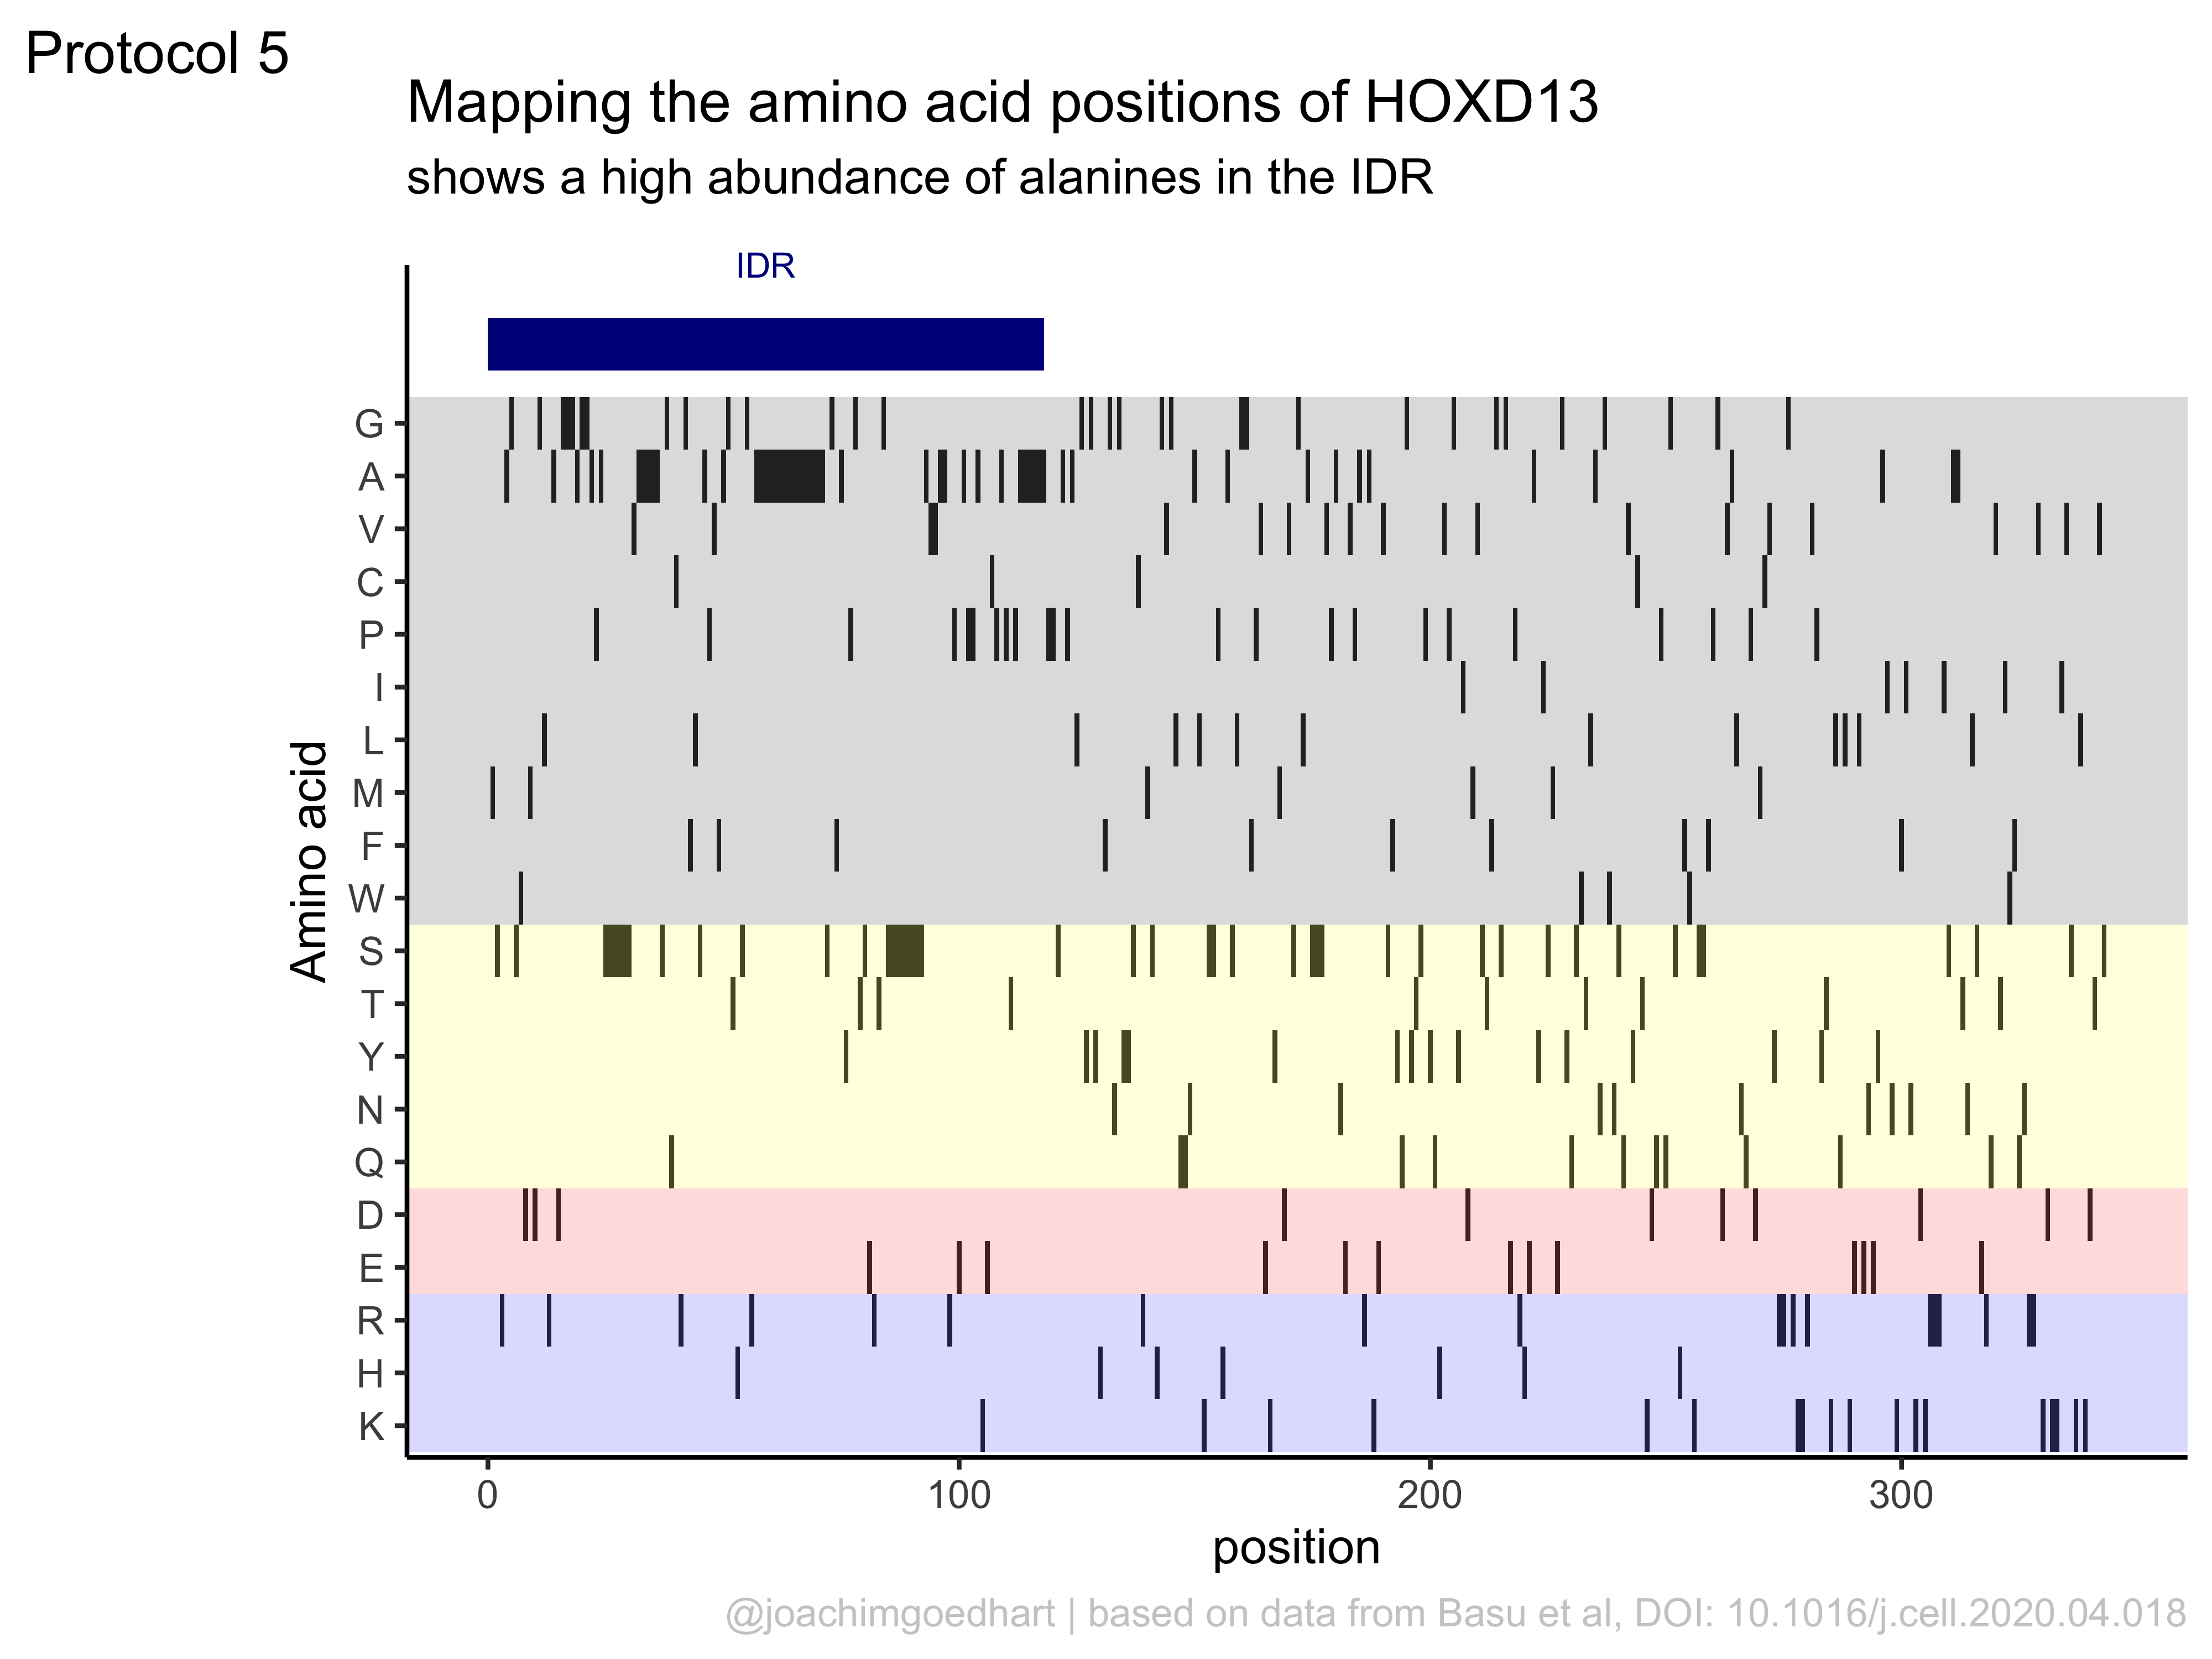
In my opinion, the best part of the book is the section with full, dedicated dataViz protocols. Examples of the output of three protocols is shown below. The protocols use realistic experimental data and provide step-by-step instructions that readers can reproduce or repurpose for their own use.
The book is work in progress, so this is not a final version as it will be updated. Especially the chapter with dataViz protocols will be extended. I will announce the addition of new protocols on twitter. I hope that the book is useful and that it provides a solid foundation for anyone that wants to use R for the analysis and visualization of scientific data that comes from a wetlab. I look forward to seeing the results on twitter (and please tag me: @joachimgoedhart), in meetings, in preprints or in peer reviewed publications.
Looking back
Previously, I have authored a number of blogs on the Node that provide step-by-step instructions on how to do data wrangling or plotting in R. The first blog was about the conversion of ‘spreadsheet’ type data into tidy data. I wrote this blog because I had a hard time understanding the tidy format. Blogging about it helped me to understand the concept and I thought it would also serve others who want to learn R. I continued to post step-by-step guides whenever I figured out something new (to me) and the enthusiastic responses from colleagues were very rewarding.
At that time, however, I lacked an important skill which is called ‘literate programming’. This approach to programming combines styled text with chunks of code. It is a great way to explain and show what code is doing in a step-by-step way. After I learned literate programming in R with Rmarkdown, I decided to convert the blogs into this format. From there on, it was a logical step to compile the different topics into a book.
Looking forward
The advantage of Rmarkdown as the framework is that it is easy to maintain, edit and update. Using Rmarkdown, new protocols can be written independently and added to the book as individual chapters. At this moment, there are 12 complete protocols and I’m preparing another 8. I take inspiration from nice data visualizations that I see and I also do remakes of figures that we have published. If you have any ideas for a remake of a plot or if you have seen a nice dataViz which could use a protocol, please let me know! Also, I welcome any feedback on any aspect of the book.
 (2 votes)
One thought on “Protocols for data visualization”
Leave a Reply
Get involved
Create an account or log in to post your story on the Node.
Sign up for emails
Subscribe to our mailing lists.
Thanks so much for sharing your learning experience with all of us!