Visualizing with Vibes: Potential and Pitfalls
Posted by Joachim Goedhart, on 2 June 2025
Anyone—regardless of coding skills—should be able to generate a publication-quality plot of their data in minutes. That was the main motivation to develop a series of web apps to make state-of-the-art data visualization more accessible (huygens.science.uva.nl). But who cares, the same result can be achieved with generative AI (genAI) based tools, right?
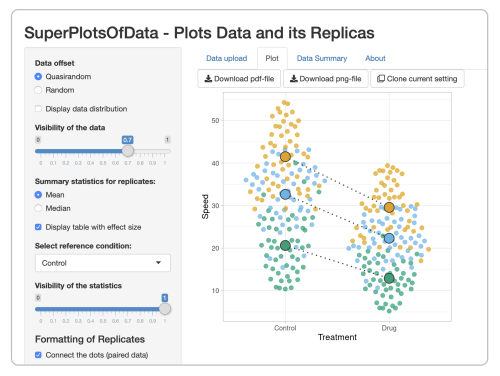
Before discussing what genAI can bring us for coding a plot, I briefly explain how the web apps work, so we can compare it with genAI later on. The data visualisation produced by the web app (the output) is coded in R and uses the {ggplot2} package. Another R-package, {shiny}, is used to create a graphical user interface (GUI). This GUI enables the user to optimize the data visualization by modifying the (invisible) code, through sliders, buttons, drop-down menus, and text fields. The process of creating a data visualization in a web app is highly interactive. By using a web app, the user can focus on what the data visualization should look like, without dealing with the code.

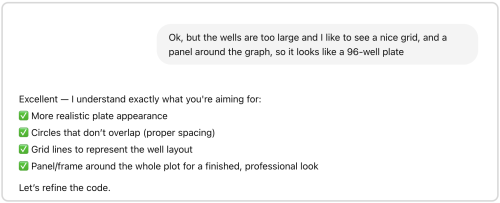
By design, the web apps are somewhat limited in their options, so I started an online resource with dataViz protocols as well. My hope was that this resource would lower the barrier for people that wanted more control than what is possible in the web app and therefore would be motivated to learn R&ggplot2. But now, there is genAI. Coding can be done, rapidly and interactively, with websites that spit out code based on Large Language Models. Instead of focusing on the code and the technicalities that are required to build a data visualization, the user can focus on what the data visualization should look like (do you see the parallels with web apps?). This approach is aptly called vibe coding.

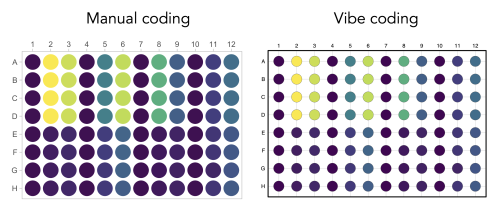
In a previous blog, I described that vibe coding “felt like I gained some kind of superpower”. But not everything is hunky-dory. It has been nicely documented by Mine Çetinkaya-Rundel that the AI-tool, besides the required changes, makes changes that are not explained and may be difficult to understand. I had exactly the same experience when I tried to vibe code a data valisualization that I had previously manually crafted (protocol 8 in the dataViz protocols book). In the end, the result (see below) is pretty neat, but it took several iterations (prompts), including some debugging of errors. I also noticed that understanding some of the basics (loading packages, knowing where to place the input data, how a plot is built using the {ggplot2} package) is needed to get the code to work. Worse yet, if the code seems to work but actually makes mistakes that are hard to spot things can go really wrong. For instance when doing some calculation for statistics that are difficult to understand or verify.

Are web apps still relevant when the same result can be obtained with vibe coding? Both the web apps and the genAI tools can be considered as a black box and allow the use to focus on the output. The genAI based tools offer great flexibility, but a strong point of the web apps is their predictable outcome, delivering a fully reproducible data visualization. The underlying code is available and the web apps are documented in (peer-reviewed) papers that can be cited. A practical advantage of web apps is that there is no need to install software or specific packages to run them. So I think there is still a future for the web apps. At the same time, I encourage experimenting with genAI as vibe coding offers new and exciting opportunities for data analysis and visualization. This will require at least a basic understanding of the coding language and sanity checks. Altogether, these are exciting times as the options for generating publication-quality data visualizations are expanding!


 (2 votes)