When real life becomes equations: Control of Epiblast and Primitive Endoderm specification during mouse preimplantation development.
Posted by Sylvain Bessonnard, on 23 September 2014
During mouse preimplantation development, the zygote divides and forms three distinct lineages: one embryonic called the Epiblast (Epi) and two extraembryonic called trophectoderm (TE) and Primitive Endoderm (PrE). The first cell fate decision occurs at the morula stage (from 16-cell to 32-cell) between TE and the Inner Cell Mass (ICM) and the second cell fate decision occurs within the ICM that gives rise to the Epi and the PrE in a salt-and-pepper organization during blastocyst formation(Artus and Chazaud, 2014). The complete specification of these three lineages is crucial for correct developmental progression. Moreover, the ICM represents the stem cell niche of Embryonic Stem Cells (ES cells) derived in 1981(Evans and Kaufman, 1981; Martin, 1981). Studying ES cells specification in vivo is important for their better use in regenerative medicine.
Previous research shows that Gata6 and Nanog are key transcription factors for the Epi/PrE cell fate specification. Whereas these two markers are co-expressed in all ICM cells at morula stage, their expression becomes mutually exclusive, asynchronously leading to intermingled Gata6-positive PrE cells and Nanog-positive Epi cells (Figure 1). Moreover, the Fgf/RTK signaling is sufficient and necessary to modulate the salt-and-pepper organisation by controlling Gata6 and Nanog expression (Artus and Chazaud, 2014).
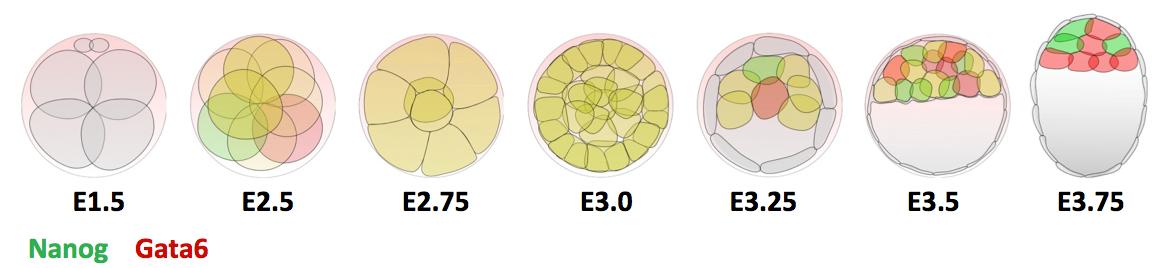
Figure 1 : Expression profile of Gata6 and Nanog during preimplantation development.
We re-examined the role of Gata6 and showed that this transcription factor is required for PrE specification (Figure 2). The PrE defects cannot be rescued by Fgf4 administration, meaning that the cells need Gata6 function to be able to respond to the Fgf signal. These series of experiments also showed that, like in vitro, Nanog expression can be inhibited by the RTK pathway independently of Gata6 function, suggesting a direct repression. Interestingly, by examining Gata6 heterozygotes we also show that the amount of Gata6 is important not only to determine the Epi/PrE ratio but also to regulate the timing of Epi specification and determination. Some of these findings were also reported by Schrode and collaborators (Schrode et al., 2014).

Figure 2: E3.75 immunofluorescence against Cdx2 (blue), Nanog (green) and Gata6 (red).
All these observations suggest that Nanog, Gata6 and the Fgf4/Fgfr pathway act as a regulatory network to specify Epi and PrE cells. Despite progress in understanding the basic principles of stem cell niches, other techniques are required to define the dynamic spatio-temporal induction of salt-and-pepper. One alternative approach is mathematical modeling, based on the translation of biological interactions into mathematical equations. The main feature is to follow the dynamics of factors through time in a defined context.
We developed a fruitful collaboration with the Theoretical Chronobiology Laboratory (ULB, Brussels- Belgium). The aim was to develop a mathematical model based on the regulatory network, using published data combined with our results on the analysis of Gata6 mutants (also described in this publication). The model is defined by a set of differential equations. Three of them represent three variables corresponding to the level of intracellular proteins: Gata6, Nanog and Fgfr2. A fourth one represents the activity of Fgfr/Erk signaling, which depends on the extracellular concentration of Fgf4, the fifth variable of the system (Figure 3).
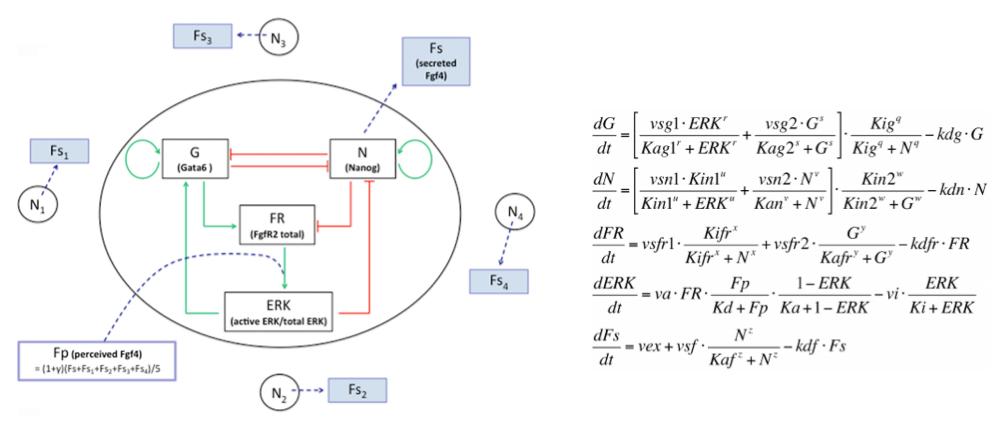
Figure 3: Representation of the regulatory network and its corresponding equations.
The model uncovers three stable steady states (tristability): an ICM-like state where Gata6 and Nanog are co-expressed, a PrE-like state where only Gata6 is expressed and an Epi-like state where only Nanog is expressed.
Simulations show that the model is sufficient to observe Epi and PrE cell specification and resume in vivo findings: 1/ Epi and PrE cells are organized in a salt-and-pepper manner, 2/ this organization is obtained by an asynchronous mechanism, 3/ Epi cells are specified earlier compared to PrE cells and 4/ Epi/PrE ratios obtained fit with in vivo results. The model also recapitulates cell behaviours in the different mutants (Nanog-/-, Gata6-/-, Gata6-/+) (Frankenberg et al, 2011; Bessonnard et al, 2014).
After reaching the ICM state, a subset of cells favours Nanog expression and acquire the Epi-like state. In response to Nanog, cells secrete Fgf4 and modify their local concentration in the neighboring intercellular space. The local increase of Fgf4 is sufficient to push neighboring cells to favour Gata6 expression and reach the PrE-like state. Interestingly, simulations show that only one Nanog-expressing cell could be sufficient to induce the salt and pepper pattern.
The heterogeneity of Fgf4 distribution is crucial to resume the salt-and-pepper organization. It is inherent to the mechanism and causes the asynchrony in cell specification. Thus the model mathematically explains the in vivo observation in which Fgf4 mutants cultured in presence of recombinant Fgf4 cannot restore the salt and pepper pattern and act in a binary fashion (Kang et al., 2013; Krawchuk et al., 2013).
Even if we do not know how one or few cells favour Nanog expression, the following steps of the model are deterministic. Several hypotheses on how Nanog expression is promoted are proposed. The model suggests that it is the consequence of a pErk decrease, following the diminution and dilution of an early Fgf4 expression that was observed by Guo and collaborators (Guo et al., 2010). Alternatively, differences in pErk or Nanog expression could be influenced by cell position (Morris et al., 2010) or stochastically induced (Ohnishi et al., 2014; Yamanaka et al., 2010). More experiments will be required to answer this highly debated question.
In conclusion, this close collaboration enabled us to propose new insights for the salt-and-pepper induction in vivo that will be also useful for stem cell research. More generally, our study is a good example to show that experimental biology and mathematical modeling can synergize to provide insightful results and hypotheses.
Acknowledgments: I thank Dr. Claire Chazaud, Dr. Prudence Donovan and Pr. Albert Goldbeter for reading the article.
Artus, J., & Chazaud, C. (2014). A close look at the mammalian blastocyst: epiblast and primitive endoderm formation Cellular and Molecular Life Sciences, 71 (17), 3327-3338 DOI: 10.1007/s00018-014-1630-3
Bessonnard, S., De Mot, L., Gonze, D., Barriol, M., Dennis, C., Goldbeter, A., Dupont, G., & Chazaud, C. (2014). Gata6, Nanog and Erk signaling control cell fate in the inner cell mass through a tristable regulatory network Development, 141 (19), 3637-3648 DOI: 10.1242/dev.109678
Evans, M., & Kaufman, M. (1981). Establishment in culture of pluripotential cells from mouse embryos Nature, 292 (5819), 154-156 DOI: 10.1038/292154a0
Frankenberg, S., Gerbe, F., Bessonnard, S., Belville, C., Pouchin, P., Bardot, O., & Chazaud, C. (2011). Primitive Endoderm Differentiates via a Three-Step Mechanism Involving Nanog and RTK Signaling Developmental Cell, 21 (6), 1005-1013 DOI: 10.1016/j.devcel.2011.10.019
Guo, G., Huss, M., Tong, G., Wang, C., Li Sun, L., Clarke, N., & Robson, P. (2010). Resolution of Cell Fate Decisions Revealed by Single-Cell Gene Expression Analysis from Zygote to Blastocyst Developmental Cell, 18 (4), 675-685 DOI: 10.1016/j.devcel.2010.02.012
Kang, M., Piliszek, A., Artus, J., & Hadjantonakis, A. (2012). FGF4 is required for lineage restriction and salt-and-pepper distribution of primitive endoderm factors but not their initial expression in the mouse Development, 140 (2), 267-279 DOI: 10.1242/dev.084996
Krawchuk, D., Honma-Yamanaka, N., Anani, S., & Yamanaka, Y. (2013). FGF4 is a limiting factor controlling the proportions of primitive endoderm and epiblast in the ICM of the mouse blastocyst Developmental Biology, 384 (1), 65-71 DOI: 10.1016/j.ydbio.2013.09.023
Martin, G. (1981). Isolation of a pluripotent cell line from early mouse embryos cultured in medium conditioned by teratocarcinoma stem cells. Proceedings of the National Academy of Sciences, 78 (12), 7634-7638 DOI: 10.1073/pnas.78.12.7634
Morris, S., Teo, R., Li, H., Robson, P., Glover, D., & Zernicka-Goetz, M. (2010). Origin and formation of the first two distinct cell types of the inner cell mass in the mouse embryo Proceedings of the National Academy of Sciences, 107 (14), 6364-6369 DOI: 10.1073/pnas.0915063107
Ohnishi, Y., Huber, W., Tsumura, A., Kang, M., Xenopoulos, P., Kurimoto, K., Oleś, A., Araúzo-Bravo, M., Saitou, M., Hadjantonakis, A., & Hiiragi, T. (2013). Cell-to-cell expression variability followed by signal reinforcement progressively segregates early mouse lineages Nature Cell Biology, 16 (1), 27-37 DOI: 10.1038/ncb2881
Schrode N, Saiz N, Di Talia S, & Hadjantonakis AK (2014). GATA6 levels modulate primitive endoderm cell fate choice and timing in the mouse blastocyst. Developmental cell, 29 (4), 454-67 PMID: 24835466
Yamanaka, Y., Lanner, F., & Rossant, J. (2010). FGF signal-dependent segregation of primitive endoderm and epiblast in the mouse blastocyst Development, 137 (5), 715-724 DOI: 10.1242/dev.043471
 (4 votes)
Get involved
Create an account or log in to post your story on the Node.
Sign up for emails
Subscribe to our mailing lists.
Read the latest Development issue
Most-read posts in May
- From comparison to mechanism: decoding heart regeneration
- A day in the life of a Reviews Editor (at Development)
- What does a Reviews Editor do?
- New evo-devo textbook ‘Eco-Evo-Devo: The Environmental Regulation of Development, Evolution, and Health’
- preLighters’ choice – A curated selection of recent preprints