Revisiting an old puzzle with high-resolution, three-dimensional eyes
Posted by Sha Wang, on 19 September 2018
Sha Wang, Deborah Gumucio
This article shares the story behind our recent Developmental Cell paper. It tells the history of this project and how three-dimensional (3D) observations at the individual cell level transformed our preconceived ideas and brought new insights into cell dynamics in the proliferative intestinal epithelium.
Epithelial tubes are present in many developing tissues and usually elongate to various degrees during organogenesis. Therefore, understanding how epithelial tubes elongate is an essential piece of the puzzle we need to solve in order to unveil the big picture—how the entire organ acquires a functional structure.
The fetal small intestine is a great model for this subject because it elongates rapidly to generate an incredibly long epithelial tube to meet postnatal nutrition demands. Interestingly, although its prominent elongation attracted the attention of many researchers, we actually knew far less than we thought we did about the underlying processes driving elongation. With the benefits of hindsight, the unique structure of the early intestinal epithelium indeed requires 3D information to reveal the critical details missed and misled by 2D imaging.
First impressions were firmly entrenched
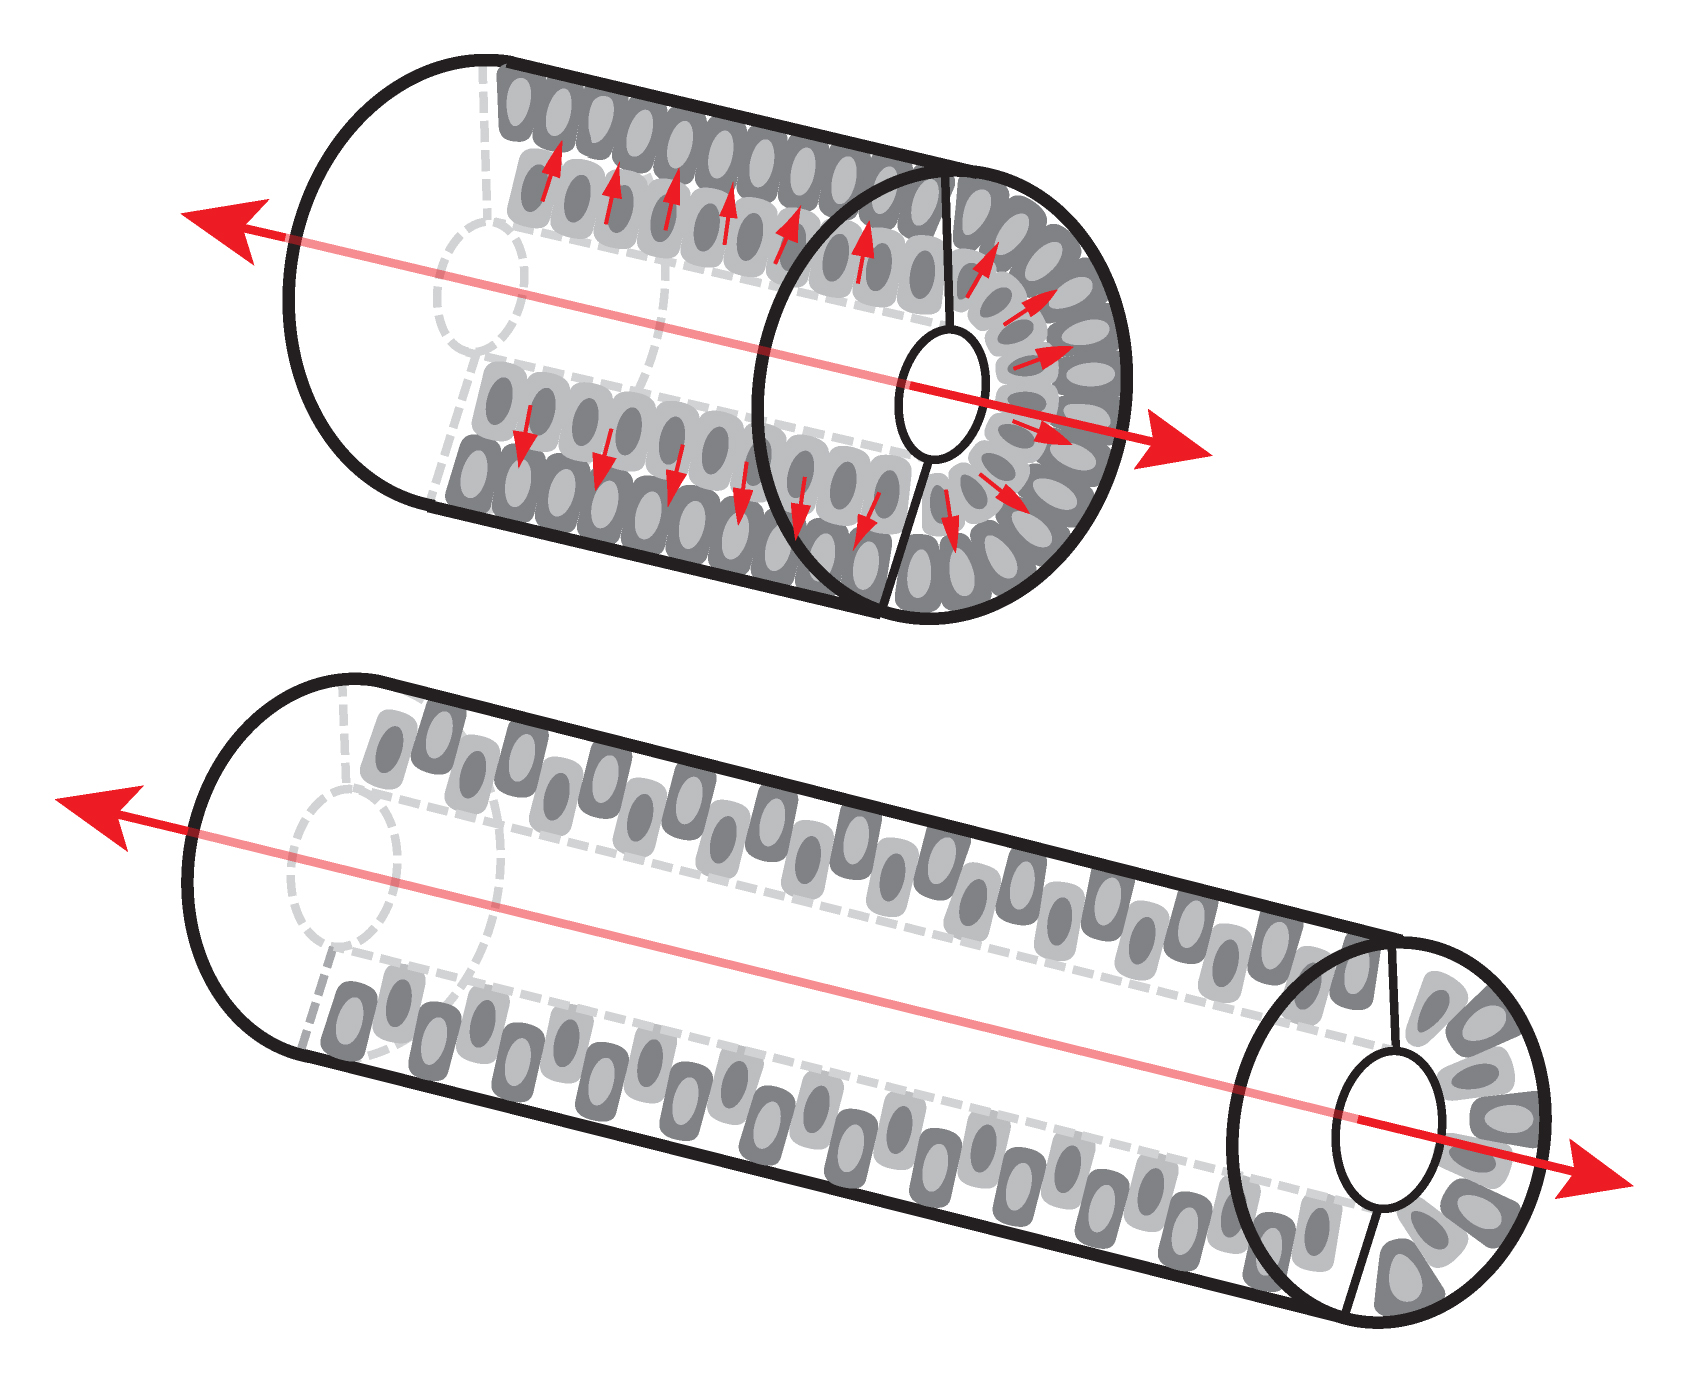
Two decades ago, by examining fetal rat small intestinal structure on thin sections under the light and electron microscope, Mathan et al. concluded that the early developing epithelium has several cell layers, but only one cell layer is present at later stages (Mathan et al., 1976). It is easy to imagine that this reduction in cell layers could be a consequence of intercalations of cells from different layers. In a tubular structure, radial intercalations can drive convergent extension (CE) movements, leading to a longer tube with a smaller girth (Walck-Shannon and Hardin, 2014) (Figure 1). Indeed, in 2009, Cervantes et al. found that Wnt5a null mouse small intestines are severely shortened and proposed that the defect was caused by a failure of intercalation during CE-like movements (Cervantes et al., 2009). Shortly thereafter, Yamada et al. noted that Ror2, a Wnt5a receptor, is required for mouse small intestinal elongation, again, presumably by CE (Yamada et al., 2010). Additional studies indicated that the frog gut also elongates by radial CE (Reed et al., 2009). All these findings seemed to demystify the intestinal elongation process, but the details of cellular behaviors during CE were unclear.
To further probe how CE occurs at the cellular level, a previous graduate student in our lab, Ann Grosse, labeled a small subpopulation of cells in the small intestines of early fetal CaggCreERT2; R26mTmG mice. After acquiring confocal z-stacks from thick sections (100 μm), she found that labeled epithelial cells are tall (up to 50 μm) and thin (1-4 μm); most cells touch both apical and basal surfaces, indicating that the early small intestinal epithelium (SIE) contains only one cell layer (Grosse et al., 2011). The earlier impression of multiple cell layers came from analysis of thin sections (5 μm) that seldom include an entire cell body. This newer appreciation of a single-layered structure clearly does not support the above-mentioned CE hypothesis. This discovery became a turning point, leading us to ask: what other cellular events could drive rapid intestinal elongation?
Brand new information provided by high-resolution 3D imaging tools
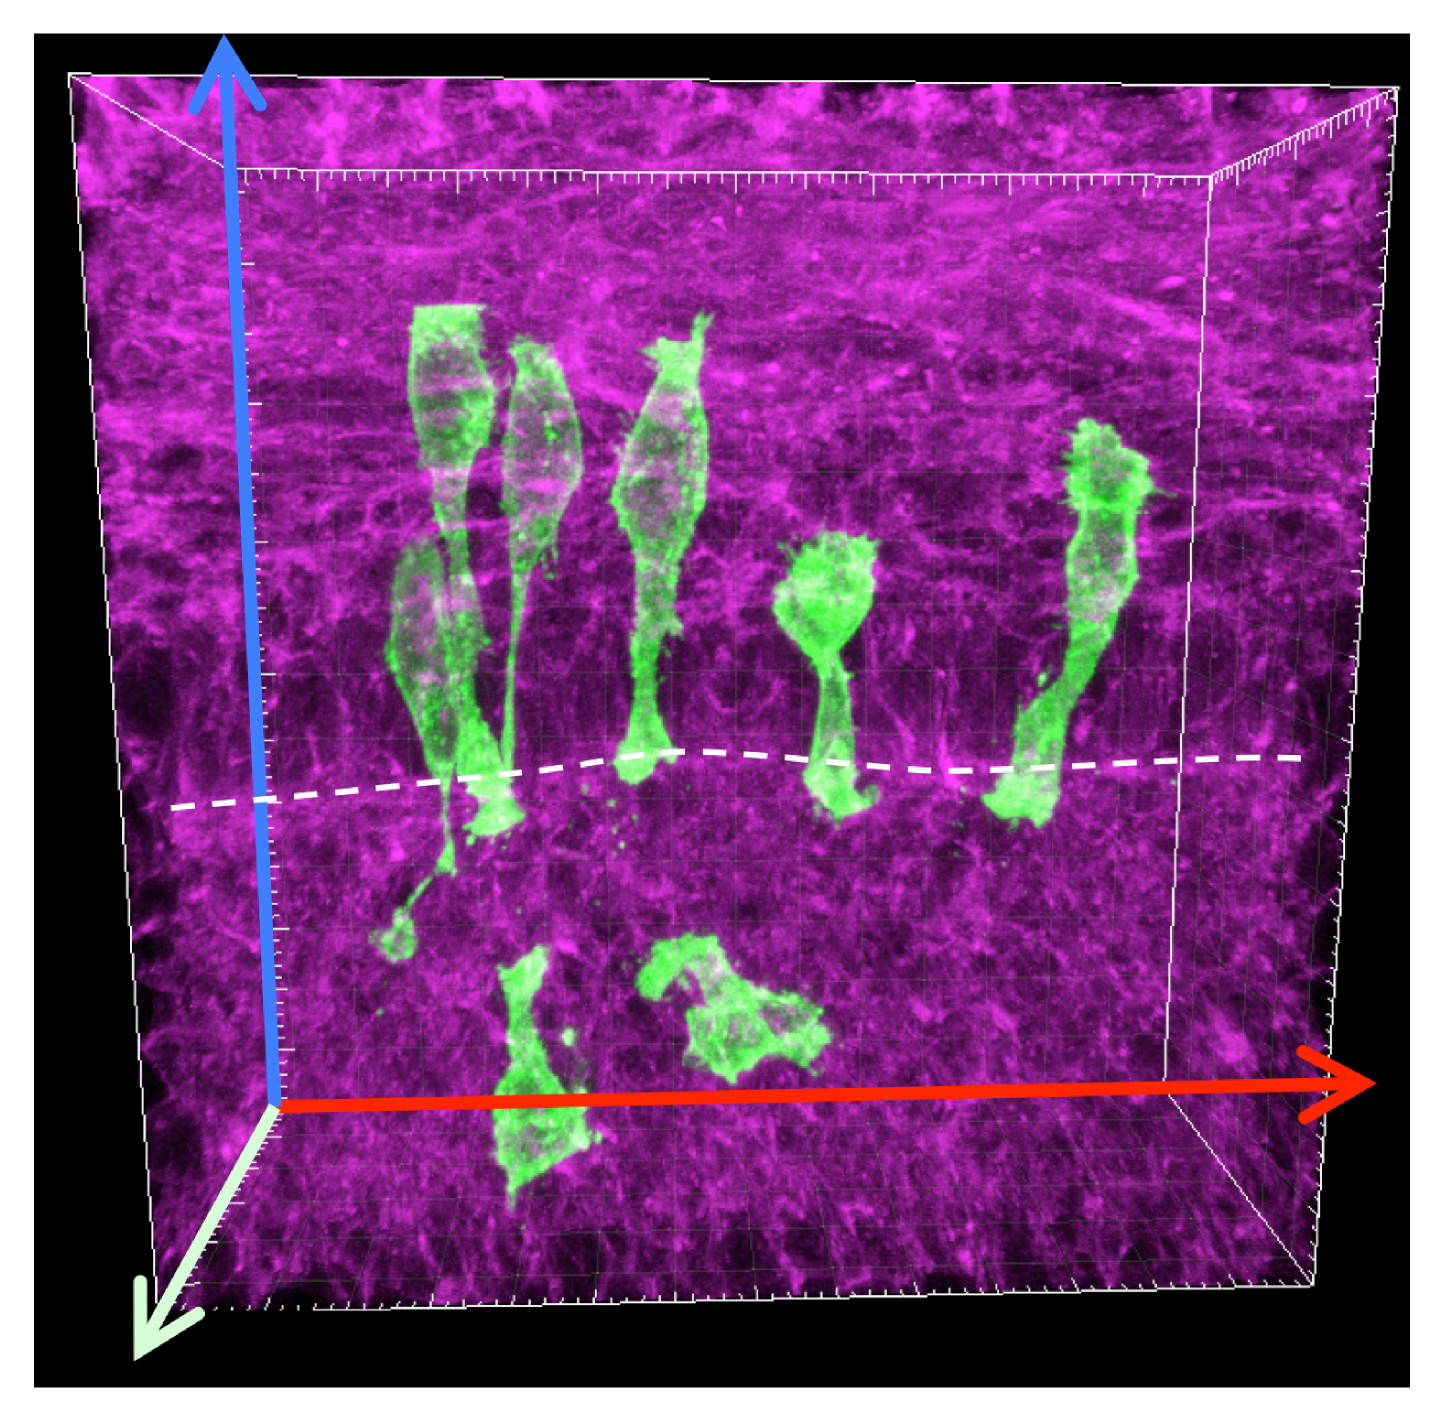
Does rapid elongation come from another type of unrecognized cell rearrangement that occurs within the single-layered epithelium? Up to this point, no one had examined how cell clones expand in early SIE and I thought that the spatial arrangement of clonal cells could provide some clues. Therefore I generated large clones in the early ShhCreERT2; R26mTmG SIE tube and acquired 3D images of these clones. In contrast to what I predicted, labeled clones were not patches of connected cells, but groups of separated cells with various shapes (Figure 2). These unexpected clonal patterns immediately opened the curiosity door. Why are offspring cells separated from each other? Why are they organized in such patterns? Why do cells adopt different shapes? Are any of these features related to the rapid elongation of the SIE tube? The key to all these questions was to learn how an individual cell behaves in the elongating SIE tube.
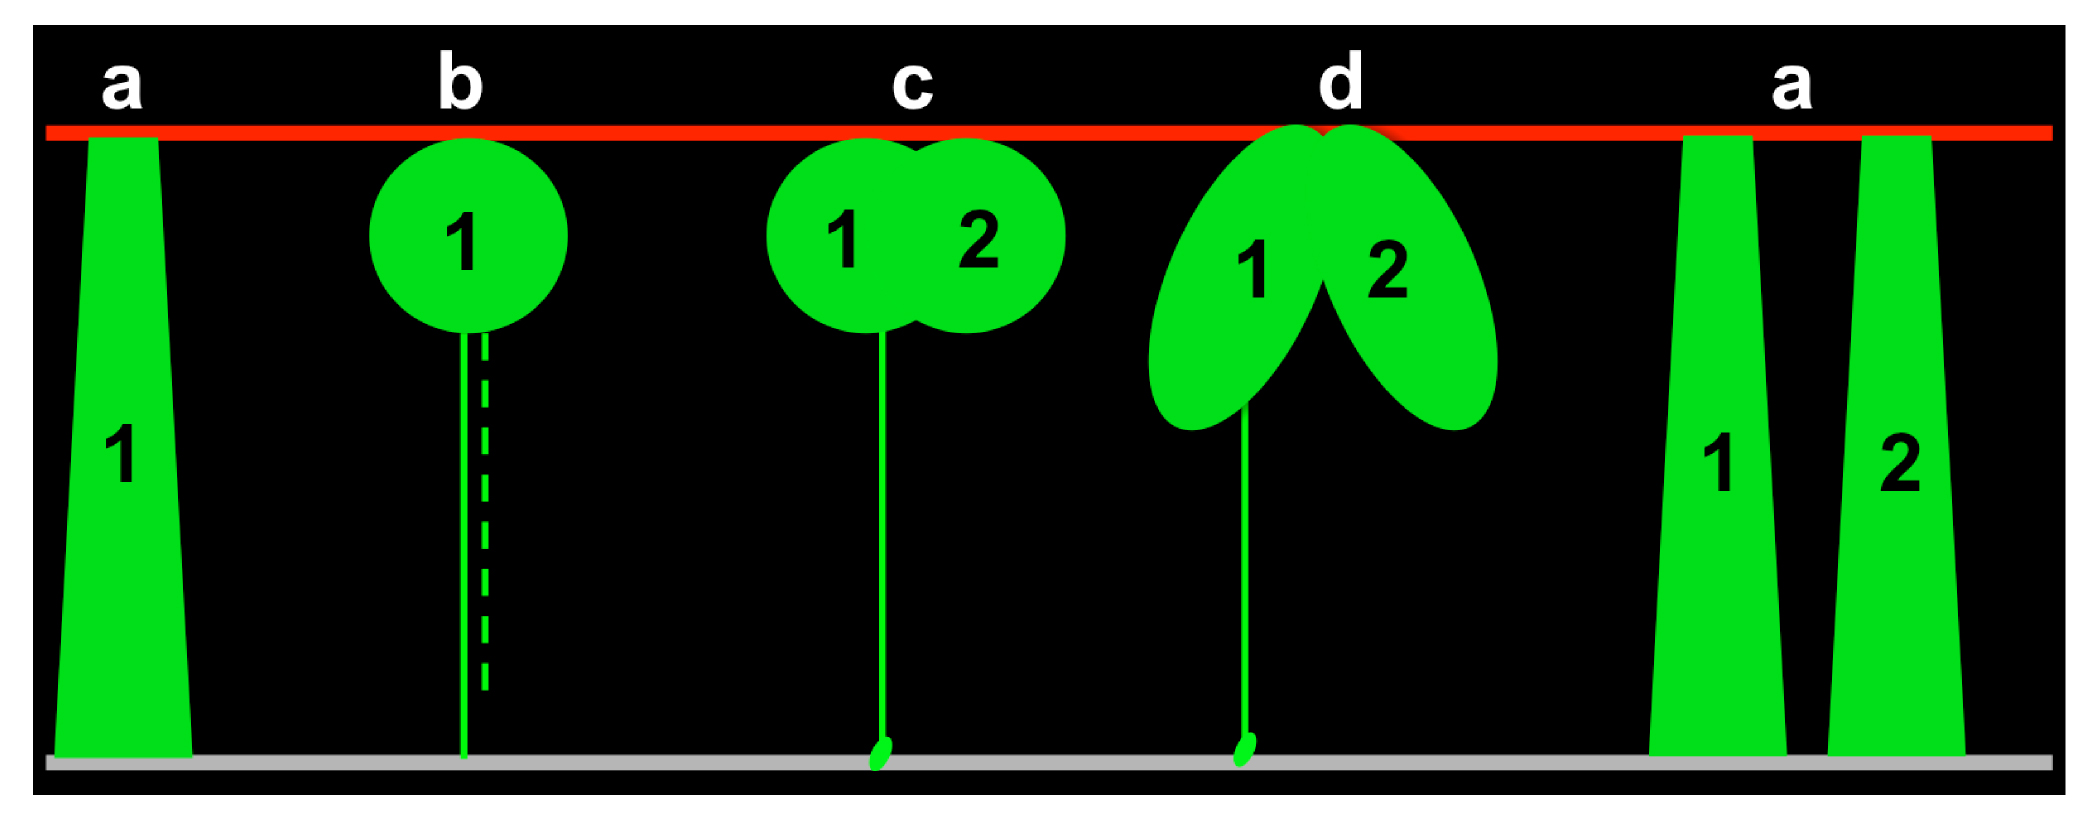
Based on previous studies in our lab, we knew that: 1) the early SIE is pseudostratified; 2) cell nuclei travel from the basal side to the apical side to divide (Grosse et al., 2011). However, we had no idea about how cells behave while their nuclei are cycling between the apical and basal surfaces. Therefore, I started to collect all different 3D cell shapes and bin them according to cell cycle markers. After observing hundreds or thousands of static 3D cell shapes, I noticed solid correspondences between the cell cycle phase and certain cell body shapes and was able to divide them into four major groups: a) interphase—the cell spans the apical-basal axis; b) mitosis—balloon-shaped cell body at the apical side; c) cytokinesis—a clear cleavage furrow between two nascent daughters; d) early G1—two apically connected cells (Figure 3). This assortment provided an initial framework of cell behavior over the cell cycle. By further comparing subtle differences within each group, I was able to fill in more details, especially how cells are dynamically connected to the basal surface, to rebuild the entire journey of individual cells.
Record it live
Even though we were quite confident with cell behaviors deduced from 3D shapes of fixed cells, the temporal information was still missing. Therefore, I started to focus on live imaging of small intestines. Due to the strong peristaltic movement of the small intestine, live imaging was challenging. After trying various conditions, with Dr. Cebrian’s help, I managed to apply a live imaging method for the embryonic kidney to our system (Costantini et al., 2011). The live recording data turned out to be extremely rewarding. It not only confirmed the temporal order suggested by static 3D images but also led us to discern two previously unrecognized modes of basal nuclear return in G1 phase. The two modes differ in the deployment of an asymmetrically inherited basal process, a thin filament that connects apical cell body to the basal surface.
The role of Wnt5a
In parallel, we were curious, if CE is not occurring, what makes the Wnt5a mutant gut shorter? By comparing epithelial cell behaviors in wild-types and Wnt5a mutants, we realized that the post-mitotic filopodial outgrowth is guided by Wnt5a, a cue from the underlying mesenchyme. Without Wnt5a, many newly divided cells cannot “see” the basal to establish a solid connection. Death of these rapidly proliferating cells (and loss of their future progeny) severely limits small intestinal elongation.
Looking forward
By following our own cues provided by 3D observations throughout this study, we uncovered a series of exquisite cell behaviors in the elongating SIE tube. These findings opened a new list of meaningful questions: Which features of this cellular choreography are broadly conserved in all pseudostratified epithelia and which represent tissue-specific adaptations? How do the filopodia follow Wnt5a cue to find the basal surface? What cytoskeletal machinery is engaged in this signaling process? Interestingly, mutations in FILAMIN A, a gene that acts downstream of Wnt5a, is associated with human congenital short bowel syndrome. That will be another interesting cue to follow for sure!
References:
Cervantes, S., Yamaguchi, T.P., Hebrok, M., 2009. Wnt5a is essential for intestinal elongation in mice. Dev Biol 326, 285-294.
Costantini, F., Watanabe, T., Lu, B., Chi, X., Srinivas, S., 2011. Dissection of embryonic mouse kidney, culture in vitro, and imaging of the developing organ. Cold Spring Harbor protocols 2011, pdb prot5613.
Grosse, A.S., Pressprich, M.F., Curley, L.B., Hamilton, K.L., Margolis, B., Hildebrand, J.D., Gumucio, D.L., 2011. Cell dynamics in fetal intestinal epithelium: implications for intestinal growth and morphogenesis. Development 138, 4423-4432.
Reed, R.A., Womble, M.A., Dush, M.K., Tull, R.R., Bloom, S.K., Morckel, A.R., Devlin, E.W., Nascone-Yoder, N.M., 2009. Morphogenesis of the Primitive Gut Tube Is Generated by Rho/ROCK/Myosin II-Mediated Endoderm Rearrangements. Dev Dynam 238, 3111-3125.
Walck-Shannon, E., Hardin, J., 2014. Cell intercalation from top to bottom. Nature reviews. Molecular cell biology 15, 34-48.
Yamada, M., Udagawa, J., Matsumoto, A., Hashimoto, R., Hatta, T., Nishita, M., Minami, Y., Otani, H., 2010. Ror2 is Required for Midgut Elongation During Mouse Development. Dev Dynam 239, 941-953.
 (No Ratings Yet)
Get involved
Create an account or log in to post your story on the Node.
Sign up for emails
Subscribe to our mailing lists.