Featured Resource: VR-Omics
Posted by Denis Bienroth, on 24 May 2023
Doing great science depends on teamwork, whether this is within the lab or in collaboration with other labs. However, sometimes the resources that support our work can be overlooked. Our ‘Featured resource’ series aims to shine a light on these unsung heroes of the science world. In our latest article, we hear from Denis Bienroth, who describes the work of VR-Omics.
What is VR-Omics?
VR-Omics is a computational framework that analyses, visualises, explores, and interprets spatially resolved transcriptomics (SRT) data. It supports SRT data from various technologies, including sequencing-based and imaging-based platforms. Notably, VR-Omics is the first tool to analyse and visualise SRT data in both 2D desktop and virtual reality (VR) environments. It incorporates an automated workflow for data preprocessing and spatial mining. Additionally, VR-Omics is available at our VR-Omics Website. It is an open-source software, ensuring accessibility for all users. This platform is highly valuable for researchers as it also facilitates cross-platform comparisons, particularly when deploying different SRT technologies.
The VR-Omics Introduction Video showcases a comprehensive array of SRT Methods, providing an overview of all the options available.
What inspired VR-Omics’ development and its target challenges?
The development of VR-Omics was inspired by the realisation that existing tools for spatially resolved transcriptomics (SRT) data analysis required a high level of computational knowledge, making them inaccessible to many biologists. We aimed to create a solution that empowers researchers by providing a user-friendly graphical user interface (GUI) and eliminating the need for extensive computational expertise. VR-Omics puts the power back in the hands of biologists, allowing them to easily work with their own data and explore the fascinating world of gene expression landscapes.
Which SRT methods are currently supported?
VR-Omics currently supports a variety of spatially resolved transcriptomics (SRT) methods, including both sequencing-based and imaging-based technologies. The supported sequencing-based SRT methods include Visium from 10X Genomics, Tomo-seq, and STOmics from BGI. In terms of imaging-based SRT methods, VR-Omics supports Xenium from 10X Genomics and MERFISH from Vizgen. Additionally, VR-Omics allows for the analysis of custom SRT data, providing flexibility for users who are using their own spatial transcriptomics data not suitable with any of the aforementioned vendors. It’s worth mentioning that CosMx by Nanostring will also be available in VR-Omics shortly, further expanding the range of supported SRT methods. The wide range of supported SRT methods in VR-Omics ensures its compatibility with diverse experimental setups, enabling researchers to analyse and visualise their spatial data effectively.
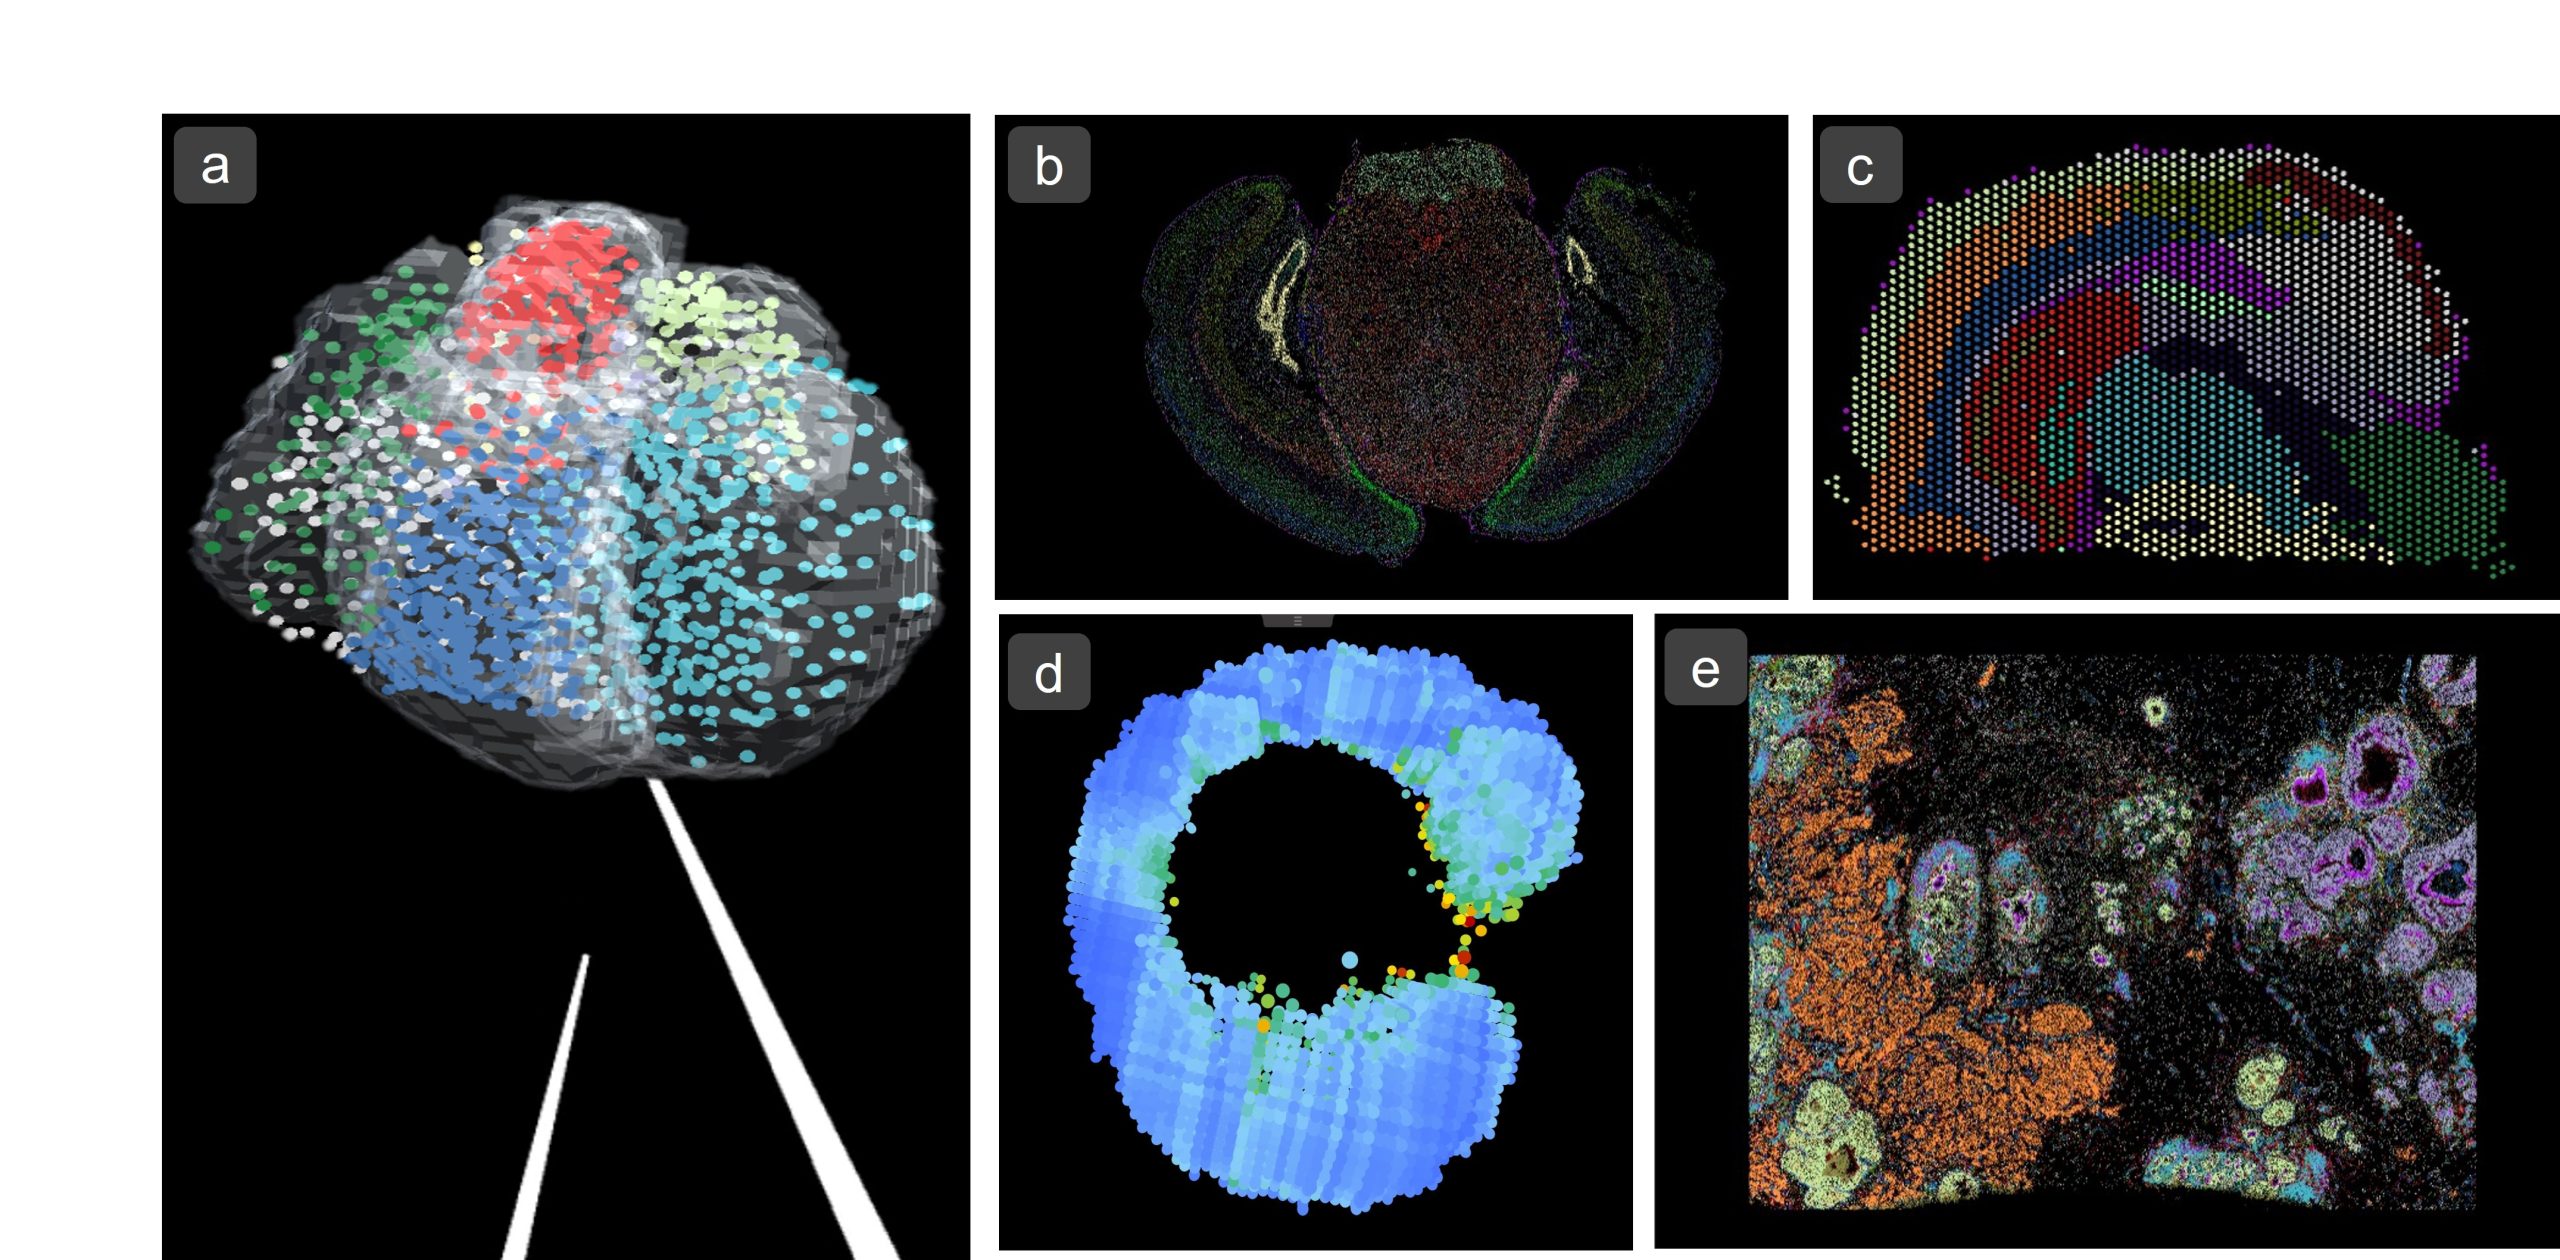
a) 3D Dataset of Human Developing Heart1 (Visium – 10X Genomics) as VR environment. b) Mouse Brain Receptor Map2 (MERFISH – Vizgen) c) Mouse Brain Coronal Section3 (Visium – 10X Genomics) d) Zebrafish Embryo SS154 (Tomo-Seq) e) Breast Cancer Tumour Section5 (Xenium – 10X Genomics)
How can biologists’ access and utilise VR-Omics for their research?
VR-Omics empowers biologists to improve their research and make significant findings by providing an immersive and intuitive platform for spatially resolved transcriptomics (SRT) data analysis. Its visualisation capabilities enable a deeper understanding of gene expression landscapes, while cross-platform compatibility facilitates collaboration and data comparison. By streamlining workflows and eliminating computational complexities, VR-Omics allows researchers to focus on interpreting their data and uncovering valuable insights, ultimately accelerating scientific progress in diverse fields. VR-Omics is available at our VR-Omics Website.
Can I use VR-Omics with my own data?
Absolutely! VR-Omics is specifically designed to empower you to use your own data. It seamlessly supports spatially resolved transcriptomics (SRT) data generated through sequencing-based or imaging-based technologies, ensuring compatibility with multiple SRT platforms. Once loaded, VR-Omics streamlines the analysis process with its integrated workflow, automating tasks such as clustering, filtering, and spatial variable gene analysis. This means you can effortlessly explore and gain valuable insights from your data.
Can I export my findings to share them with my colleagues?
VR-Omics provides convenient export options for sharing your findings. You can export the output of the automated workflow, including plots, CSV files, and HDF files for downstream analysis. Additionally, the software allows you to export data directly from the Visualiser, such as gene lists, selected Regions of Interest (ROIs), screenshots, and videos. These versatile export capabilities enable you to easily share your results and collaborate effectively with your colleagues.
How can I explore my spatial data with VR-Omics?
With VR-Omics’ Visualiser feature, you can explore your spatial data on your desktop or in an immersive virtual reality (VR) environment. It supports side-by-side gene comparisons, merging gene expression patterns in one slide, and overlaying 3D objects for improved orientation. The Figure Viewer allows real-time interaction with output plots. VR-Omics offers a range of powerful tools to enhance your exploration and analysis of spatial data.
What if I don’t know how to process my data? Do I need computational knowledge to run VR-Omics?
Not at all! VR-Omics is designed to be user-friendly and accessible, even for those without extensive computational knowledge. Its integrated workflow automates essential processing steps, allowing you to analyse your data without requiring deep computational expertise. With VR-Omics, you can easily load your data and navigate the intuitive graphical user interface (GUI) for seamless data processing and analysis. It empowers biologists to explore and interpret their spatial transcriptomics data effortlessly, regardless of their computational background.
Can VR-Omics facilitate the creation and exploration of 3D spatial data?
Certainly! VR-Omics is specifically designed to facilitate the creation and exploration of 3D spatial data. While many platforms are limited to visualising individual sections from a single spatially resolved transcriptomics (SRT) experiment, VR-Omics takes it a step further. It enables you to seamlessly navigate through multiple sections, such as serial sections of the same tissue, for a more comprehensive understanding of spatial gene expression patterns in three-dimensional space. With the immersive capabilities of virtual reality (VR), VR-Omics provides an enhanced environment to study complex biological systems and unravel intricate spatial relationships. It empowers researchers to delve into the three-dimensional landscape of their SRT data, gaining deeper insights into the biology of the system under study.
What are the next plans and features for VR-Omics?
The future of VR-Omics is driven by our commitment to constant improvement and expanding its capabilities. Our plans include incorporating new spatially resolved transcriptomics (SRT) methods, such as Nanostring (CosMx), to broaden the range of compatible technologies. We are dedicated to staying up to date with the latest algorithms and packages used in the literature, ensuring that the Automated Workflow remains robust and relevant. Additionally, we are excited to introduce new features, to enhance the user experience and analysis possibilities. Our goal is to continuously evolve VR-Omics, incorporating user feedback and advancements in the field, to provide a cutting-edge software solution for spatial data analysis.
What are the benefits of using VR for spatial data work, and can I use VR-Omics without VR?
VR-Omics offers the flexibility to work with or without VR hardware, allowing users to choose their preferred mode of interaction. While VR provides an immersive experience for spatial data exploration, the benefits go beyond visualisation. In a virtual reality environment, users can effectively navigate and analyse complex 3D spatial structures, revealing hidden patterns, identifying spatial co-expression relationships, and gaining new insights into biological phenomena. However, even without VR, VR-Omics provides powerful analysis and visualisation tools, ensuring that users can effectively analyse and interpret spatial data. Whether in VR or non-VR mode, VR-Omics empowers researchers to unlock the full potential of their spatial data.
What if a necessary feature is missing in VR-Omics Visualiser or the Automated Workflow that would benefit my project?
We highly value user feedback and are dedicated to continuously improving VR-Omics based on the needs of our users, particularly biologists working with spatial data. If you find that there is a missing feature or a step in the Automated Workflow that would benefit your project, we are always eager to hear your suggestions. We actively seek input from users and encourage collaboration to enhance the software’s functionality. By engaging with the community, we aim to incorporate new features and improvements that address the specific requirements of our users. Your input is invaluable, and we are committed to making VR-Omics a powerful and user-friendly tool for spatial data analysis.
What if I have any questions, is VR-Omics documented and supported?
If you have any questions or need assistance while using VR-Omics, you can rely on its Documentation and support resources. VR-Omics is well-documented, providing detailed guides, tutorials, and documentation that explain its features and functionality. Additionally, the VR-Omics team is available to help address any queries or issues you may encounter. They are committed to providing support and ensuring a smooth user experience with the software. Shot us an email (denis.bienroth@mcri.edu.au) if you have any questions or inquiries.
References
1: Asp, M. et al. A Spatiotemporal Organ-Wide Gene Expression and Cell Atlas of the Developing Human Heart. Cell 179, (2019).
2: Vizgen Data Release V1.0. May 2021, https://info.vizgen.com/mouse-brain-data
3: 10X Genomics resources, Mouse Brain Coronal Section 1(FFPE), https://www.10xgenomics.com/resources/datasets/mouse-brain-coronal-section-1-ffpe-2-standard
4: Junker, J. P. et al. Genome-wide RNA Tomography in the Zebrafish Embryo. Cell, 662–675 (2014).
5: High resolution mapping of the breast cancer tumour microenvironment using integrated single cell, spatial and in situ analysis of FFPE tissue, https://www.10xgenomics.com/products/xenium-in-situ/preview-dataset-human-breast
 (3 votes)
Get involved
Create an account or log in to post your story on the Node.
Sign up for emails
Subscribe to our mailing lists.