Seeing cells from a different angle
Posted by Christele Gonneau, on 7 December 2014
Thanks to microscopy, scientists can compete with the most talented photographers and take the most astonishing pictures! Although I have been focusing on microscopy pictures in this blog, microscopy is not the only way to make pretty pictures of cells.
In recent years, the rapid progress in sequencing technology has propelled this technique to the front stage and it is now widely used to study gene expression in single cells. Whereas with microscopy, we can observe only a limited number of parameters per cell, sequencing allows us to observe the expression of thousands of genes per cell.
DNA sequencing is the technology that determines the nucleotide order of a given DNA fragment (for example: ATTTCGAGCCGT). Sequencing can be used to screen for genetic mutations or for paternity testing for example. In the case of gene expression studies, the RNA rather than the DNA is sequenced. Gene expression is the process by which information from a gene (DNA) is used in the synthesis of a protein (gene product). The intermediate molecule between the DNA gene and the protein is RNA. RNA is encoded from DNA and used to synthesize the protein it is coding for. Thus in order to define gene expression in a single cell, we isolate the RNA from the cell, sequence it to identify it and quantify it. The more RNA molecules there are coding for a specific protein, the higher the expression for the corresponding gene is.
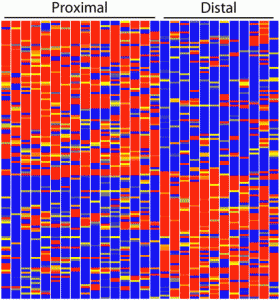
In a recent study published in Development, Brunskill and colleagues used this RNA-seq technology in order to create an atlas of gene expression patterns in the developing kidney. For example, this picture is a “heatmap” showing the gene expression pattern in the renal vesicle (a region within the kidney). Each horizontal line corresponds to the expression level of one gene, with red for high expression, yellow for intermediate expression and blue for low expression. Each vertical column corresponds to a single cell. From this heatmap, Brunskill and colleagues observed that the gene expression pattern in the renal vesicle is highly polarized with very distinct gene expression profile in the proximal cells (left portion of the heatmap) versus the distal cells (right portion of the heatmap).
Unsurprisingly, this high-throughput technology is becoming increasingly popular as it provides very detailed information about single cells, highlights unforeseen patterns among tissues, beautifully captures the uniqueness of each cell and, one must admits, generates fascinating graphical displays!
Picture credit:
Brunskill E. W, Park, J-S, Chung E. Chen F., Magella, B., and Potter S. S. (2014). Single cell dissection of early kidney development: multilineage priming. Development 141, 3093-101.


 (2 votes)