The atlas of mouse development eHistology resource
Posted by the Node, on 27 May 2015
This Spotlight article was written by Elizabeth Graham, Julie Moss, Nick Burton, Chris Armit, Lorna Richardson and Richard Baldock, and was first published in Development.
The Atlas of Mouse Development by Professor Mathew Kaufman is an essential text for understanding mouse developmental anatomy. This definitive and authoritative atlas is still in production and is essential for any biologist working with the mouse embryo, although the last revision dates back to 1994. Here, we announce the eHistology online resource that provides free access to high resolution colour images digitized from the original histological sections (www.emouseatlas.org/emap/eHistology/index.php) used by Kaufman for the Atlas. The images are provided with the original annotations and plate numbering of the paper atlas and enable viewing the material to cellular resolution.
The atlas of mouse development
The Atlas of Mouse Development by Professor Mathew Kaufman (Kaufman, 1994) is the de facto standard atlas describing mouse developmental anatomy at the histological level. It set the standard for other atlases that followed and is unmatched in terms of authority and detail. It is an essential volume for all research into mammalian development and remains in high demand without revision since 1994. To build the breadth of understanding of mouse development required for this atlas, Kaufman amassed a major histological slide collection. This comprised multiple fully serial sectioned embryos per stage with the best matching Theiler’s staging criteria selected for image capture. All the original histological slides stained with Haematoxylin and Eosin are carefully archived and indexed, and represent an untapped resource of new material. For each of the embryos selected for annotation, Kaufman chose a series of sections to be photographed, mounted on board and hand annotated using Letraset, then re-photographed to produce the figures reproduced in the printed volume. Fig. 1 shows an example of a plate that was never published. The Atlas has 980 section images with about 12,275 annotations – a truly painstaking process showing an uncompromising dedication to science.
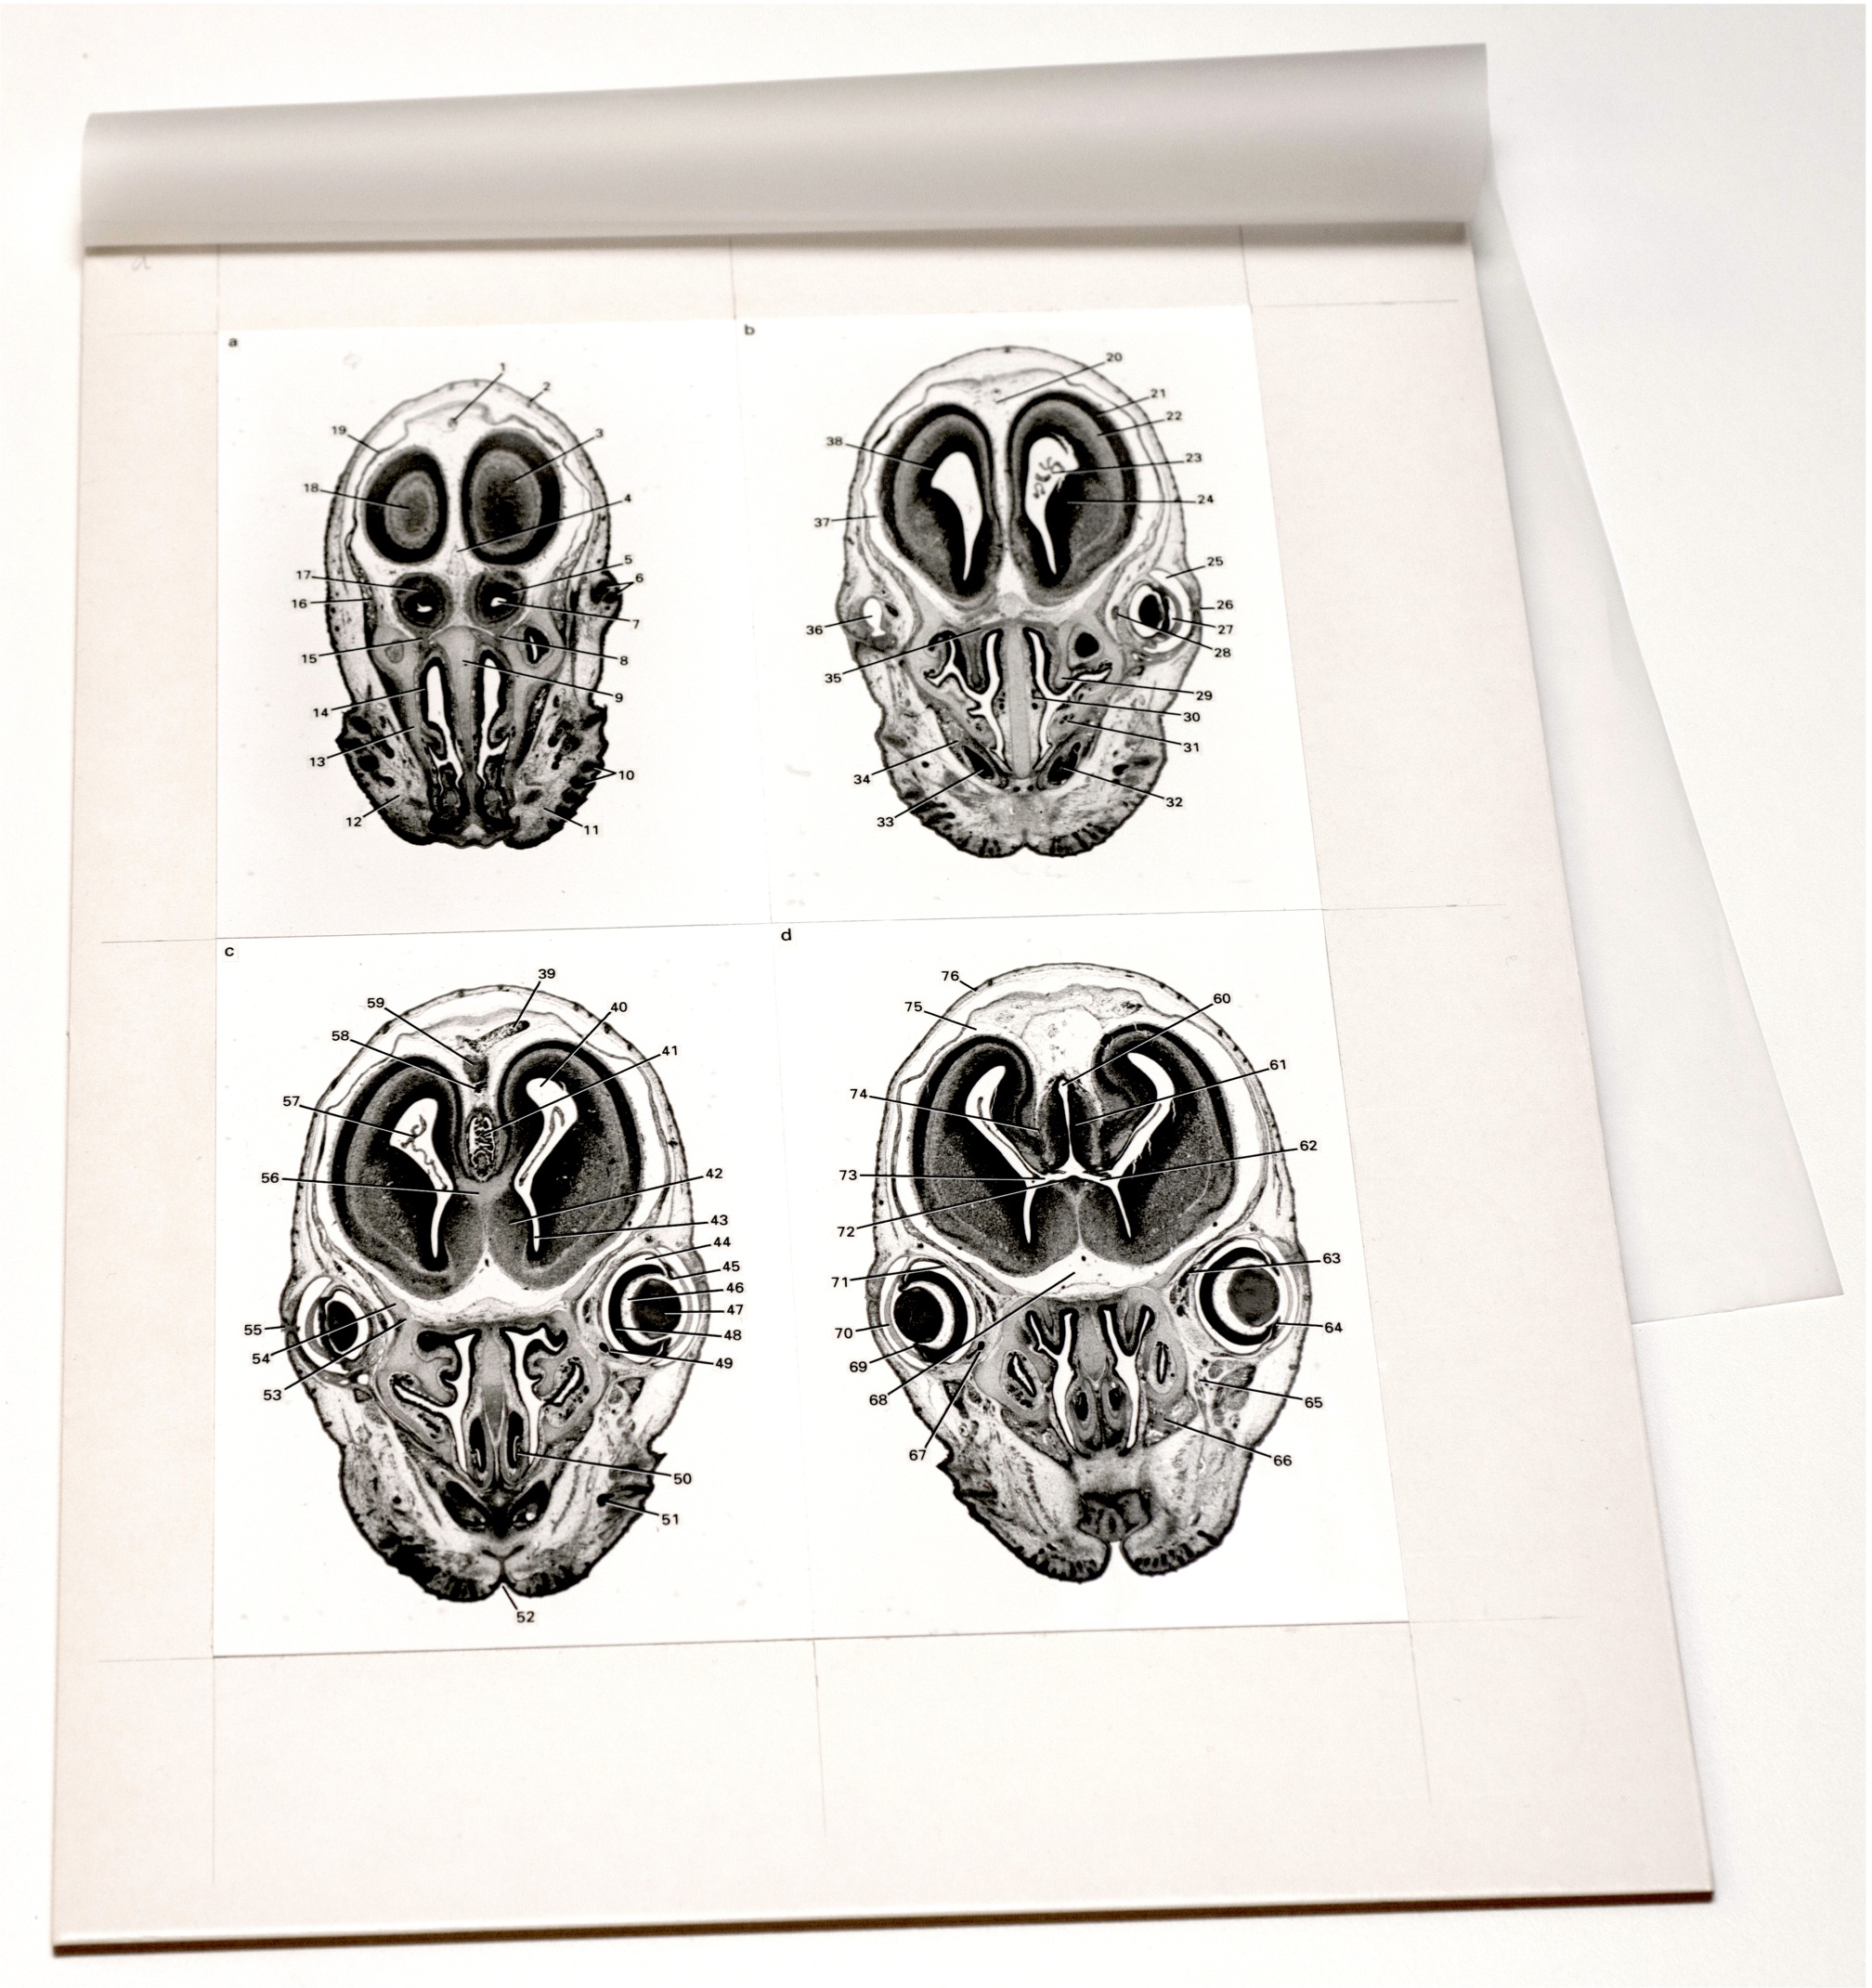
Fig. 1. An example of the original artwork for the Atlas of Mouse Development. This plate was never published and shows the Letraset lines and numbers pasted on top of the printed photographs. The lines were added twice using both white and black.
When Academic Press (now an imprint of Elsevier) approached Kaufman to produce a revised edition, a user survey suggested it should include colour images, more coronal sections and an update of the text from 1994 to 2012. Without the original electronic version this was never going to be possible and with Kaufman’s failing health an agreement was put in place that the original histological slides would be re-digitised in colour and at high resolution by the Edinburgh Mouse Atlas Group, and made freely available both to the community and to Elsevier for a revised and online edition. The open-access online images would have the same annotations as in the original book but no written content. The revised edition would include all the original copyrighted material and would be available for purchase.
The eHistology resource
Here, we announce the web publication of the open access mouse embryo eHistology resource (www.emouseatlas.org/emap/eHistology/). This delivers the new, re-digitised high-resolution images of the histology sections that were photographed for the original atlas, as a series of annotated ‘zoom-viewer’ images on the web. The images are organized with the same plate and image numbering of the original atlas and in addition to online access are freely available for download from the University of Edinburgh’s DataShare resource with associated metadata. With each dataset the download includes:
(1) Full-resolution jpeg format images, up to 35,000×55,000 pixels at 0.34 μm per pixel, enabling histological sections to be viewed at cellular resolution.
(2) Details of the embryo, plate and image with respect to the original atlas.
(3) A full list of Kaufman annotations, with their respective (x,y) coordinate locations within the given image.
(4) EMAPA ontology IDs for each annotation and, where identified, a Wikipedia entry.
(5) The URL of the specific image in the eHistology resource for linking and citation.
The histological processing for the embryo sections is detailed in The Atlas of Mouse Development (Kaufman, 1994, p. 2). For the eHistology resource, we have re-digitised the sections using the Zeiss DotSlide slide scanner with a ×20 objective to produce images with a pixel resolution of 0.34 μm and in full colour. The images are converted using the VIPs image processing application (Martinez and Cupitt, 2005) to a pyramidal tiff format that are used by the Image Internet Protocol 3D server (IIP3D) (Husz et al., 2012) coupled with a JavaScript user interface developed in-house. The interface will run in most web browsers, although, because of the non-standard behaviour of web browsers, it functions best in Firefox (support.mozilla.org/en-US/products/firefox), which is freely available for all operating systems.
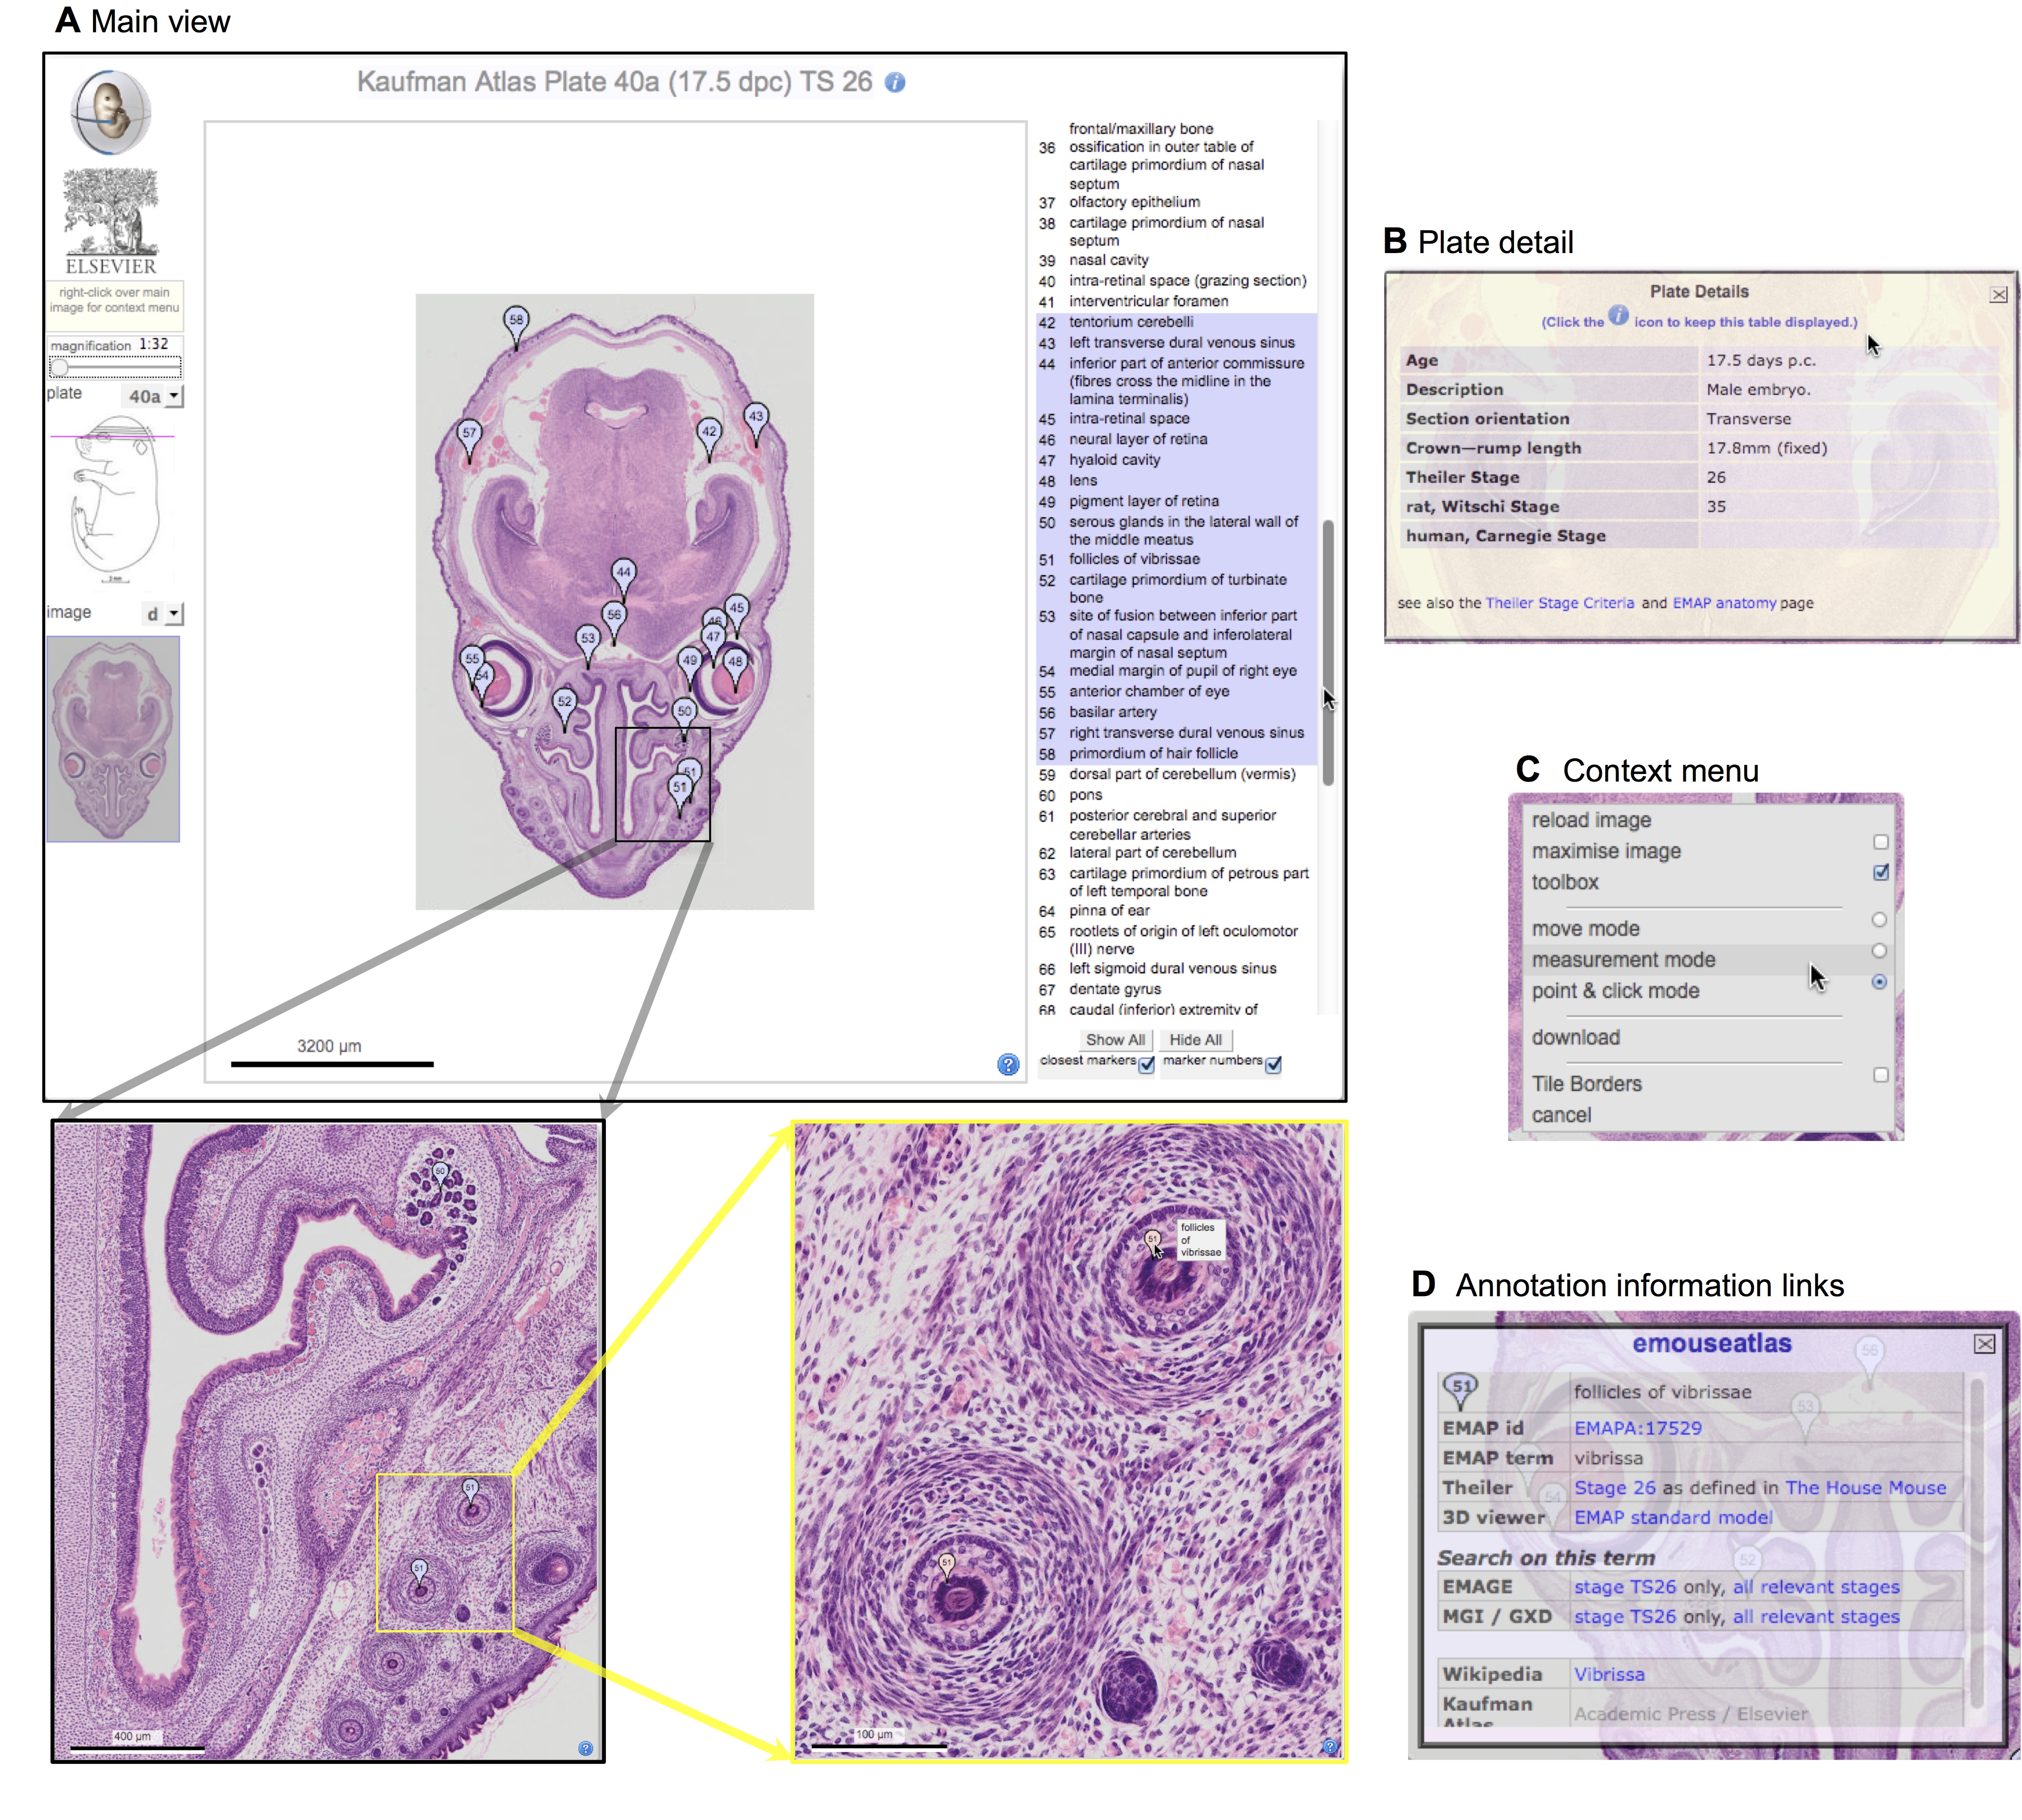
Fig. 2. Screen shot of the eHistology viewer. (A) The main view window shows the new image at a resolution approximately as published in the paper Atlas. The sub-regions highlighted and redisplayed illustrate the resolution available using the online zoom capability. (B) The plate detail is made visible by clicking the ‘i’ information icon. (C) The image context menu allows alternate view modes, measurement and image download. (D) The annotation links are displayed by = ‘clicking’ on an annotation flag in the image.
Fig. 2 shows the eHistology viewer corresponding to Plate 40a, image d (Kaufman, 1994, p. 344) in the original atlas. The index on the right-hand side shows the annotations defined by Kaufman in the original; ‘mouse-over’ or selecting the term will show the location in the image of that structure. Similarly, putting the screen
cursor over the image will cause the nearest annotations to be displayed. Selecting a term leaves the flag permanently visible and clicking on a term will provide access to other information and data, in particular the eMouseAtlas (Richardson et al., 2014) and GXD/MGI (Smith et al., 2014) resources (queried using the EMAPA ID of that tissue) and the licenced material available from Elsevier. In addition, it is possible to inspect the image at high resolution and to make size measurements of any given structure.
The resource provides a simple index (www.emouseatlas.org/emap/eHistology/index.php) based on the plate and image letter of the original atlas that can be reset from any given view. This will be extended to include a search option for any annotation term and anatomy (EMAPA) ID. Individual views of each section can be reached via a parameterised URL for the purposes of linking to a specific view. This will allow other resources and websites to provide links directly to the respective image, by-passing the index page.
This eHistology resource is a novel collaboration to provide an open-access resource linked to a definitive reference book that is still under copyright, thus providing benefit to the scientific community and extending the value to the publisher. With the images now public, it opens the door to community contribution in terms of more-detailed and extensive annotation, as well as linking out and integrating a whole range of anatomical and histological resources.
References
Husz, Z. L., Burton, N., Hill, W., Milyaev, N. and Baldock, R. A. (2012).Web tools for large-scale 3D biological images and atlases. BMC Bioinformatics 13, 122.
Kaufman, M. H. (1994). The Atlas of Mouse Development. Amsterdam, The Netherlands: Elsevier Academic Press.
Martinez, K. and Cupitt, J. (2005). VIPS – a highly tuned image processing software architecture. In Proceedings of IEEE International Conference on Image Processing 2, 574-577.
Richardson, L., Venkataraman, S., Stevenson, P., Yang, Y.,Moss, J., Graham, L., Burton, N., Hill, B., Rao, J., Baldock, R. A. et al. (2014). EMAGE mouse embryo spatial gene expression database: 2014 update. Nucleic AcidsRes. 42,D835-D844.
Smith, C. M., Finger, J. H., Hayamizu, T. F., McCright, I. J., Xu, J., Berghout, J., Campbell, J., Corbani, L. E., Forthofer, K. L., Frost, P. J. et al. (2014). The mouse Gene Expression Database (GXD): 2014 update. Nucleic Acids Res. 42, D818-D824.
 (1 votes)
One thought on “The atlas of mouse development eHistology resource”
Leave a Reply
Get involved
Create an account or log in to post your story on the Node.
Sign up for emails
Subscribe to our mailing lists.
Fantastic! Thanks, emouseatlas team.