How a cell becomes a giant: a fluctuation-driven patterning mechanism
Posted by Adrienne Roeder, on 22 March 2017
Heather M. Meyer1, José Teles2, and Pau Formosa-Jordan2
1 Weill Institute for Cell and Molecular Biology and the graduate field of Genetics, Genomics, and Development, Cornell University, Ithaca, NY, 14853 USA
2 Sainsbury Laboratory, University of Cambridge, Cambridge CB2 1LR, UK
Comment on: Heather M. Meyer*, José Teles*, Pau Formosa-Jordan*, Yassin Refahi, Rita San-Bento, Gwyneth Ingram, Henrik Jönsson, James C. W. Locke and Adrienne H. K. Roeder “Fluctuations of the transcription factor ATML1 generate the pattern of giant cells in the Arabidopsis sepal” eLife 6, 635–41, March 2, 2017
* equal contributions
Introduction:
A longstanding question that has fascinated both biologists and physicists alike is how a group of genetically identical cells differentiate into specialized cell types and form intricate spatiotemporal patterns. To form cell patterns, undifferentiated cells must somehow adopt specialized cell fates as well as achieve specific spatiotemporal control over their division patterns. In the field of biology, much effort has been made to identify the genes that facilitate the patterning process. Yet, due to past limitations in imaging and quantification methods, little experimental research has been performed to observe and test the dynamic behaviors of these regulators in vivo. Theoretical approaches, such as mathematical/computational models, have thus been used to recapitulate the behavior of such genes and predict the possible underlying regulatory mechanisms. For instance, Lewis Wolpert’s French Flag model proposed that a population of cells will differentiate into different cell types by interpreting varying concentrations of a diffusible morphogen (Wolpert, 1969). This model, in complement with previous experimental data, led to the realization that Bicoid, a maternal effect gene that controls anterior patterning, acts as a diffusible morphogen to initiate the anterior-posterior patterning process of the Drosophila embryo (Briscoe and Small, 2015; Ephrussi and Johnston, 2004; Grimm et al., 2010).
Interestingly, there are various patterning systems that form without the use of a known diffusible signal. In these systems, modelers such as Alan Turing have suggested that stochastic gene expression may initiate those patterns by creating small differences that are then amplified through regulatory feedback mechanisms, ultimately leading to different fates (Turing, 1952). Although extensively explored, these behaviors have been sparsely observed in vivo within a multicellular patterning system (Kondo and Miura, 2010). Thus, it was the idea of visualizing and quantifying the emergence of cell patterns in systems where no known morphogen had been identified that brought together the collaboration between Heather- experimental biologist and confocal imaging specialist from Cornell University, José- computational biologist from Sainsbury Laboratory (SLCU), and Pau- biophysicist with a modeling background also from SLCU, to analyze the formation of giant cells on the Arabidopsis sepal. Here, we describe how our past and present interests inspired the collaborative efforts and discoveries of the dynamic nature of ATML1, and how it impacts giant cell fate decisions in the sepal, which was published recently in eLife (Meyer et al., 2017).
 Heather’s narrative:
I have always been interested in the development of patterns. When I was an undergraduate I worked in an algal systematics lab, in which I used oospore membrane patterning together with phylogenetics to taxonomically classify different algal species. I was so fascinated by the different patterns observed, that I left the field of systematics and decided to pursue a PhD at Cornell University with a focus on developmental genetics.
During my PhD, I worked with Dr. Adrienne Roeder. Adrienne was a new professor at Cornell University studying the role of variability in giant cell patterning. To study this, Adrienne used a methodology called computational morphodynamics, an analytical approach that melds imaging living plants, image processing and computational modeling to study in vivo developmental processes (Chickarmane et al., 2010; Jönsson et al., 2012; Roeder et al., 2011). I was enamored by the elegancy and novelty of applying computational morphodynamics to study patterns, especially the use of time-lapse imaging for analyzing cell growth and patterning dynamics. I therefore joined Adrienne’s lab, in hopes to employ similar techniques and aid in investigating the giant cell patterning system.
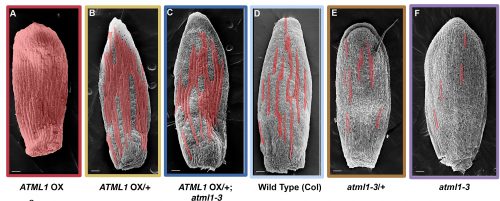
Adrienne had previously performed a forward mutagenesis screen to look for genes that affect the formation of giant cells. In this screen, Adrienne found a handful of mutants, including the epidermal specification gene ATML1 (Roeder et al., 2010; Roeder et al., 2012). ATML1 had been previously shown to be needed for epidermal specification during embryogenesis (Abe et al., 2003). Additionally, Adrienne published that ATML1 was required for the formation of giant cells and was expressed in all sepal epidermal cells (Roeder et al., 2010; Roeder et al., 2012). Thus, a major question I wanted to better understand, was if ATML1 is expressed in all epidermal cells, then why do only certain cells become giant on the sepal? To start addressing this question, we started a collaboration with Gwyneth Ingram and her graduate student at the time Rita San Bento, who had created an ATML1 overexpression line by expressing ATML1 under the epidermal specific PDF1 promoter. To our surprise, these lines produced an ectopic giant cell phenotype, consequently leading us to the initial hypothesis that a cell’s ability to become giant is sensitive to ATML1 dosage. To test this hypothesis, I created plants containing different doses of ATML1. When analyzing these plants, I found that indeed, epidermal cells were sensitive to the amount of ATML1 and that the concentration of ATML1 was correlated with the number of giant cells that formed on the sepal (Figure 1).
With this in mind, Adrienne and I wondered whether during development, different cells either express different amounts of ATML1 or if cells express the same amount of ATML1 but just exhibit differential perceptions. To answer this question, I created transgenic plants that possessed a fluorescently labeled ATML1 protein, in order to visualize ATML1 in individual cells. In these plants, I noticed that by eye sepal primordial cells seemed to contain different amounts of ATML1, whereas in the meristem ATML1 levels seemed uniform. With this discovery, I knew that I would have to live-image and track ATML1 through development quantitatively analyze its dynamics over time (Video 1). However, I was unsure of the best way to quantify expression levels of ATML1. Thus, Adrienne and I went to attend the 2014 EMBO conference on Interdisciplinary Plant Development at the SLCU, with the intention to find collaborators that would be knowledgeable about quantifying ATML1 and modeling its expression.
Video 1. A time-lapse video of a developing flower expressing fluorescently-tagged ATML1. These images were analyzed using our image quantification pipeline. Reproduced from Meyer et al. (2017).
At the EMBO conference, I was asked to give a lightning talk. This is a 5-minute short talk to advertise your poster. During this talk, I introduced the ATML1 giant cell story and asked anyone with questions and/or comments to come talk to me after. Both José Teles and Pau Formosa-Jordan independently approached me about collaborating on the project. José, had had previous experience studying stochasticity and had extensive image analysis experience and Pau had previously modeled tissue patterning, and had experience in salt-and-pepper patterning mediated by Notch and Delta. Thus, the three of us came together to both qualitatively and quantitatively understand how the behavior of ATML1 led to giant cell patterning. We skyped multiple times a week, often bouncing ideas off of one another via skype messenger.
 José’s narrative:
For the past ten or so years, the main focus of my research has been to understand how cells make decisions. There is something intrinsically beautiful in how such complex molecular networks coordinate to effect discreet – and often times radical – outcomes regarding growth and division (Schmoller et al., 2015), dormancy and activity (Kuchina et al., 2011), life and death (Paek et al., 2016) in individual cells. During my PhD at Lund University and a short postdoc at UCL immediately after, I addressed these questions by developing deterministic and stochastic models of cell fate decision in the hematopoietic system, grounded on both population-averaged and single cell gene expression data. The work being developed in Henrik Jönsson’s group at the SLCU at the time I was finishing my postdoc was very appealing to me because they were applying computational tools to quantify live-imaging data during Arabidopsis growth. This contrasted with my previous experience where datasets were static snapshots of populations and/or developmental time points. It rapidly became clear to me that for my next research project I wanted to work in developing models of plant tissue that could incorporate spatiotemporal dynamics of gene expression at the single cell resolution. I specifically focused on studying the regulatory dynamics of stem cell identity and differentiation in the shoot apical meristem.
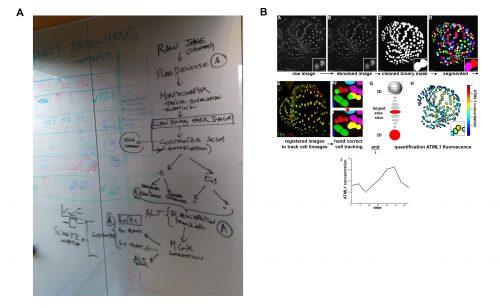
It was in this context that I attended and was immediately captivated by Heather’s presentation in Cambridge. The Arabidopsis sepal is an incredibly elegant system for studying cell fate decisions and pattern formation, and the beautiful live imaging data presented by Heather made that exceedingly clear. The fact that we could follow the expression dynamics of ATML1 as cells underwent the decision to endoreduplicate (i.e. an alternative cell cycle where the genome doubles without dividing) or divide opened a world of possibilities, and to this day, I am glad I approached Heather and, together with Pau, we were able to tackle this question with such a complete experimental and computational toolkit. The first challenge we faced was how to quantify ATML1 dynamics in single cells in the time lapses. I was working on image processing for my own project and realized there were a number of tools we could use: Costanza allowed for very accurate nuclear segmentation, MorphographX had a very convenient graphic interface for visual inspection and manual corrections and at the desk next to mine a postdoc in the Jönsson group, Yassin Refahi, was expanding ALT, which showed great promise for image registration and cell tracking. The issue, as is often the case with computational tools, was that these programs did not really communicate well with each other. It just so happened that in August 2015 their developers met under the same roof for two weeks, for a computational workshop organized at the SLCU every two years. Incompatibilities in file formats were resolved during that period and it became possible to analyze any particular image using the combined strength of the different tools. As I developed the image processing pipeline, Heather visited Cambridge for two weeks and together we ran through a number of configurations, selecting the one that allowed the most accurate results in quantifying ATML1 as well as cellular parameters of size and shape (Figure 2).
The initial results were immediately interesting, since we could see a difference in ATML1 distributions between the meristem and the early sepal, with the latter exhibiting more heterogeneity (Figure 3A).
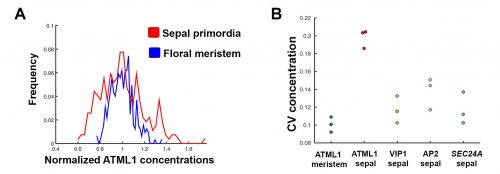
This suggested that ATML1 levels fluctuated more in the sepal than in the meristem, and we later confirmed that this was not the case for other proteins expressed in the sepal heterogeneity (Figure 3B). The dynamics of ATML1 in the sepal however were less clear. Our initial approach was to identify giant and small cells at the end of the time course and backtrack to the starting point, hoping to find differences in expression patterns that correlated with cell fate. When we did this, there were no immediately apparent differences between the two (Figure 4A). Upon closer visual inspection, Heather seemed to notice that cells which exhibit high peaks of ATML1 expression right before entering endoreduplication went on to become giant cells. This was consistent with our working hypothesis that a threshold-based mechanism could be involved in the decision but we needed to quantify the data in order to determine if such a threshold existed at all. Making use of my experience in a previous project, I approached this as a classification problem. If our hypothesis was true, and we compared maximum ATML1 expression peaks in cells that endoreduplicated (giant) versus cells that divided (small), we should be able to find a peak ATML1 expression value that accurately classified cells as giant or small and this value would essentially constitute the decision threshold. When we first applied this method, we realized that ATML1 peaks predicted giant cell fate with a mean accuracy of 0.7 (Figure 4B), which is a reasonable value (using a receiver operator characteristics (ROC) analysis for quantification; for reference, accuracy=1 is a perfect classifier and 0.5 is not better than flipping a coin).
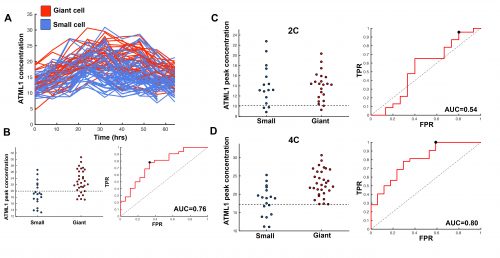
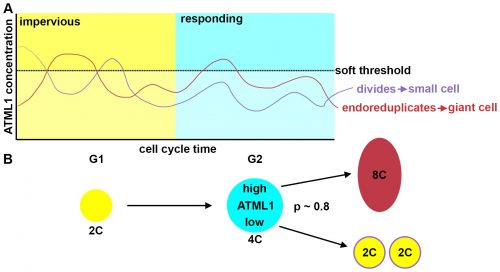
The most striking result however was when we observed that all the predictive value came from peaks observed in 4C cells (Figure 4D, mean accuracy 0.8), associated with the G2 stage of the cell cycle, and none at all from the 2C cells (Figure 4C, mean accuracy 0.5), associated with the G1 stage. This strongly suggested that in order to make the decision to endoreduplicate, cells must both experience fluctuations of ATML1 above a specific threshold level and be specifically in the G2 stage of the cell cycle (Figure 5). From an evolutionary perspective, it is exciting to speculate that in order for the proportion of giant to small cells to be robust across plants, there must have been selective pressure on the dynamical features of the ATML1 fluctuations, the ATML1 threshold level, the time window in which a peak in ATML1 above the threshold is productive or a combination of these.
 Pau’s narrative:
For a long time, I have been fascinated by the patterning process of developing tissues, especially in how initial differences in gene expression can become amplified to spur the patterning of different cell types. To start addressing this question, I did my PhD at the University of Barcelona, focusing on how Notch and Delta drive a pattern of two interspersed cell types in different developmental scenarios in animal tissues. After my PhD, I pursued a joint postdoc at the SLCU with the Locke, Jönsson and Meyerowitz groups, in order to better understand different patterning phenomena.
During my first year of my postdoc, I met Heather at the EMBO conference. I found the sepal patterning system extremely captivating and realised that jumping into such collaboration with the Roeder lab would give me the possibility to study in vivo gene expression data of the key regulator that presumably was driving a patterning process. I found this was something totally new, and I loved that I had the opportunity to model it!
Heather’s ATML1 fluorescent images were really promising, but difficult to initially interpret. Together with James Locke, Henrik Jönsson and José, we decided that José could do the image analysis, and I would focus my energies on the modeling part. Modeling this patterning phenomenon would be challenging, given that it seemed to be the result of the interplay of stochastic cell decision making, cell growth and cell division. Luckily, Henrik had this great software package called Organism-Tissue (http://dev.thep.lu.se/organism/), which would greatly facilitate the implementation and integration of these different elements.
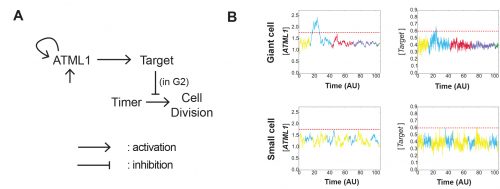
The model had many different iterations during the collaboration. Initially, it started as a stochastic positive feedback that was simulated in spherically growing cells, where the ATML1 basal gene expression per cell volume scaled with DNA ploidy. This scaling presumably stabilized a high ATML1 state, corresponding to the giant cell fate. Yet, soon after quantifying and analyzing the live-imaging data, we realized that the scaling effect did not exist, causing the model to get amended into a threshold-based mechanism model. In this model, ATML1 regulates the expression of a downstream target, and only if the target reaches a hard threshold, will it enable the cell to escape mitosis and enter endoreduplication. This hard threshold in the target naturally encoded a ‘soft threshold’ in its upstream regulator ATML1, causing cells above a certain ATML1 threshold to likely become giant cells.
The model had further modifications to provide a robust comparison between the experimental and the computational data. For instance, having a more tissue-like geometry with anisotropic growth which drives ATML1 and target concentration dilutions, introducing a noisy timer to get the normally mitotic cells to divide – while keeping under control the instability that this timer introduced into the system -, and getting the dynamics of the modeled variables in lower time resolutions as an output. Even with those modifications, it was still difficult to establish clear comparisons between the simulated and the experimental data.
A key moment was when José came up with the idea to assess the ATML1 threshold mechanism via a ROC analysis. The ROC analysis showed that high levels of ATML1 in 4C but not in 2C cells were a proxy for giant cell fate commitment. We incorporated this observation in the model, proposing the G2 phase as the time window at which cells would be sensitive to ATML1 target levels for promoting endoreduplication. Moreover, the ROC approach enabled a more straightforward comparison between the ATML1 time-traces and the simulated ATML1 traces. Indeed, this ROC approach, together with the quantification of the variability of ATML1 in the tissue, resulted in a plausible region of the parameter space in which the ATML1 model was working, where fast and relatively small ATML1 fluctuations would lead to the giant cell pattern (Figure 6 and Video 2). Non-intuitively, the model together with the data showed us that the positive feedback on ATML1 should be weak. This was later tested experimentally, nicely demonstrating how model predictions can lead to new hypotheses that can be experimentally tested.
Video 2. In silico growing tissue emulating a developing sepal, where ATML1, target, cell timer levels and cell ploidies are represented. Cells that cannot divide, increase their ploidy, becoming giant cells. Reproduced from Meyer et al. (2017).
Although the model was pivotal in understanding the dynamics of ATML1, there are still a lot of open questions that the model did not address. For instance, how ordered is the emerging pattern? Is there any cell-to-cell communication that shapes the pattern? How are ATML1 fluctuations transduced to its downstream targets and ultimately perform the cell decision making process?
Conclusion:
We would be remiss if we didn’t stress that since the start and throughout the development of the project, there was constant communication between Cornell and Cambridge, and permanent iteration and intellectual contributions from everyone towards experimental planning, data analysis and model development. The fragmented nature of this post may have given the reader the impression that this work was sequentially produced in a compartmentalized manner, and that couldn’t be farther from the truth. This truly open and dynamic multidisciplinary environment was in our opinion the most important factor in leading this project to fruition, and one of our most rewarding experiences as scientists.
References
Abe, M., Katsumata, H., Komeda, Y. and Takahashi, T. (2003). Regulation of shoot epidermal cell differentiation by a pair of homeodomain proteins in Arabidopsis. Development 130, 635–643.
Briscoe, J. and Small, S. (2015). Morphogen rules: design principles of gradient-mediated embryo patterning. Development 142, 3996–4009.
Chickarmane, V., Roeder, A. H. K., Tarr, P. T., Cunha, A., Tobin, C. and Meyerowitz, E. M. (2010). Computational morphodynamics: a modeling framework to understand plant growth. Annual review of plant biology 61, 65–87.
Ephrussi, A. and Johnston, D. S. (2004). Seeing is believing: the bicoid morphogen gradient matures. Cell 116, 143–152.
Grimm, O., Coppey, M. and Wieschaus, E. (2010). Modelling the Bicoid gradient. Development 137, 2253–2264.
Jönsson, H., Gruel, J., Krupinski, P. and Troein, C. (2012). On evaluating models in Computational Morphodynamics. Curr Opin in Plant Biol 15, 103–110.
Kondo, S. and Miura, T. (2010). Reaction-Diffusion Model as a Framework for Understanding Biological Pattern Formation. Science 329, 1616–1620.
Kuchina, A., Espinar, L., Çağatay, T., Balbin, A. O., Zhang, F., Alvarado, A., Ojalvo, J. G. and Süel, G. M. (2011). Temporal competition between differentiation programs determines cell fate choice. Mol Syst Biol 7, 557.
Meyer, H. M., Teles, J., Formosa-Jordan, P., Refahi, Y., San-Bento, R., Ingram, G., Jönsson, H., Locke, J. C. W. and Roeder, A. H. K. (2017). Fluctuations of the transcription factor ATML1 generate the pattern of giant cells in the Arabidopsis sepal. eLife 6, 635–41.
Paek, A. L., Liu, J. C., Loewer, A., Forrester, W. C. and Lahav, G. (2016). Cell-to-Cell Variation in p53 Dynamics Leads to Fractional Killing. Cell 165, 631–642.
Roeder, A. H. K., Chickarmane, V., Cunha, A., Obara, B., Manjunath, B. S. and Meyerowitz, E. M. (2010). Variability in the control of cell division underlies sepal epidermal patterning in Arabidopsis thaliana. PLoS Biol 8, e1000367.
Roeder, A. H. K., Cunha, A., Ohno, C. K. and Meyerowitz, E. M. (2012). Cell cycle regulates cell type in the Arabidopsis sepal. Development 139, 4416–4427.
Roeder, A. H. K., Tarr, P. T., Tobin, C., Zhang, X., Chickarmane, V., Cunha, A. and Meyerowitz, E. M. (2011). Computational morphodynamics of plants: integrating development over space and time. Nat Rev Mol Cell Biol 12, 265–273.
Schmoller, K. M., Turner, J. J., Kõivomägi, M. and Skotheim, J. M. (2015). Dilution of the cell cycle inhibitor Whi5 controls budding-yeast cell size. Nature 526, 268–272.
Turing, A. M. (1952). The Chemical Basis of Morphogenesis. Philos. Trans. R. Soc. Lond., B, Biol. Sci. 237, 37–72.
Wolpert, L. (1969). Positional information and the spatial pattern of cellular differentiation. J Theor Biol 25, 1–47.
 (4 votes)
Get involved
Create an account or log in to post your story on the Node.
Sign up for emails
Subscribe to our mailing lists.