Dissecting modes of pattern formation using live imaging and Hidden Markov Models
Posted by Nick Lammers, on 30 April 2020
Background/History
In the early fly embryo, information encoded in a handful of maternally deposited protein gradients is fed forward through increasingly intricate layers of interacting genes, culminating in the differentiation of the embryo into functional body segments with a high degree of spatial and temporal precision[1],[2]. Short segments of regulatory DNA known as enhancers lie at the heart of this developmental cascade. Enhancers contain binding sites for transcription factor proteins and are thought to act like computational units that “read” input concentrations of relevant transcription factors and “compute” a corresponding level of output gene expression[3]. But while we know quite a bit about what enhancers do, the how remains a mystery: we still lack a quantitative physical understanding of the chain of molecular events that connect transcription factor binding at enhancer DNA to the activation or inhibition of transcription.
Our recent work was aimed at filling this gap through a combination of live imaging experiments and theoretical modeling that allowed us to investigate transcriptional regulation not only across space, but also over time[4]. We focused on the even-skipped (eve) stripe 2 enhancer, which drives a sharp stripe of pattern formation in developing embryos of the fruit fly Drosophila melanogaster. Nearly three decades ago, a seminal study by Steve Small and Michael Levine established the basic principles of eve stripe 2 regulation: two activators, Hunchback and Bicoid, initially establish a broad domain of expression that is then refined into a sharp stripe by the action of the repressors Giant and Krüppel on the anterior and posterior sides of the stripe, respectively[5]. Dozens of papers have followed in their footsteps, making eve stripe 2 one of the most widely studied enhancers in developmental biology.
In 2014, the dynamics of eve stripe 2 expression in living embryos were examined for the first time using the MS2 system[6],[7]. These experiments revealed that the rate of transcription at individual eve loci was highly stochastic, with periodic “bursts” of rapid transcription that were separated by periods with little to no activity. This transcriptional bursting has been observed across a wide variety of model organisms, suggesting that it is the rule, rather than the exception[8],[9],[10],[11],[12],[13]. Because these single-locus fluctuations reflect the molecular processes that drive transcription, the authors speculated that it might be possible to learn more about the molecular mechanisms that underpin transcriptional regulation by taking a quantitative look at how the characteristics of transcriptional bursts varied across different regions of the eve stripe 2 pattern. Yet at that point there was no rigorous way to quantify how transcriptional bursting changed as a function of space and time. The challenge we faced was that rather than reporting on the instantaneous state of the promoter, the fluorescence readout from MS2 experiments at each time point corresponded to the aggregate promoter activity coming from all RNA polymerases actively transcribing the gene and elongating nascent RNA (see Figure 1C). To overcome this challenge, we worked with Hernan Garcia and Chris Wiggins to develop a new computational tool that could systematically dissect burst dynamics at individual loci across a pattern of gene expression.
cpHMM inference
Coined “compound state hidden Markov model” (cpHMM), our new computational technique is conceptually similar to an approach that was recently developed in the Chubb lab[14] and earlier HMM-based approaches[15],[16]. It allowed us to deconvolve the MS2 traces and obtain information about the instantaneous promoter activity at individual eve loci, which we described using a simple “telegraph” model with one active and one inactive state (Figure 1A & C, Video 1). This model has three parameters: the kinetic on- and off-rates that control the switching between transcriptionally active and inactive promoter states, and the rate of RNA polymerase initiation. Thus, in the model, there are three different “knobs” that transcription factors can tune to increase or decrease the average rate of mRNA production at a locus. With this technique in hand, we then set out to infer how these parameters were controlled across space and time from individual MS2 traces obtained from live imaging.
Our inference results showed that regulation of bursting took place primarily through the spatiotemporal modulation of on-rates (bursting frequency), with eve loci in the stripe center bursting with about twice the frequency of those at the stripe boundaries (Figure 1B). This finding suggests that the transcription factors responsible for modulating eve activity act by speeding up or slowing down one or more of the molecular steps leading to the initiation of transcriptional bursts, but do not affect the rate of RNA polymerase loading within a burst or the duration of the burst (inverse of the off-rate). Thus, although we did not have single-molecule resolution, we were able to use our computational method to infer the transcriptional state of individual promoters and to make headway towards a molecular understanding of the mechanisms driving transcriptional control.
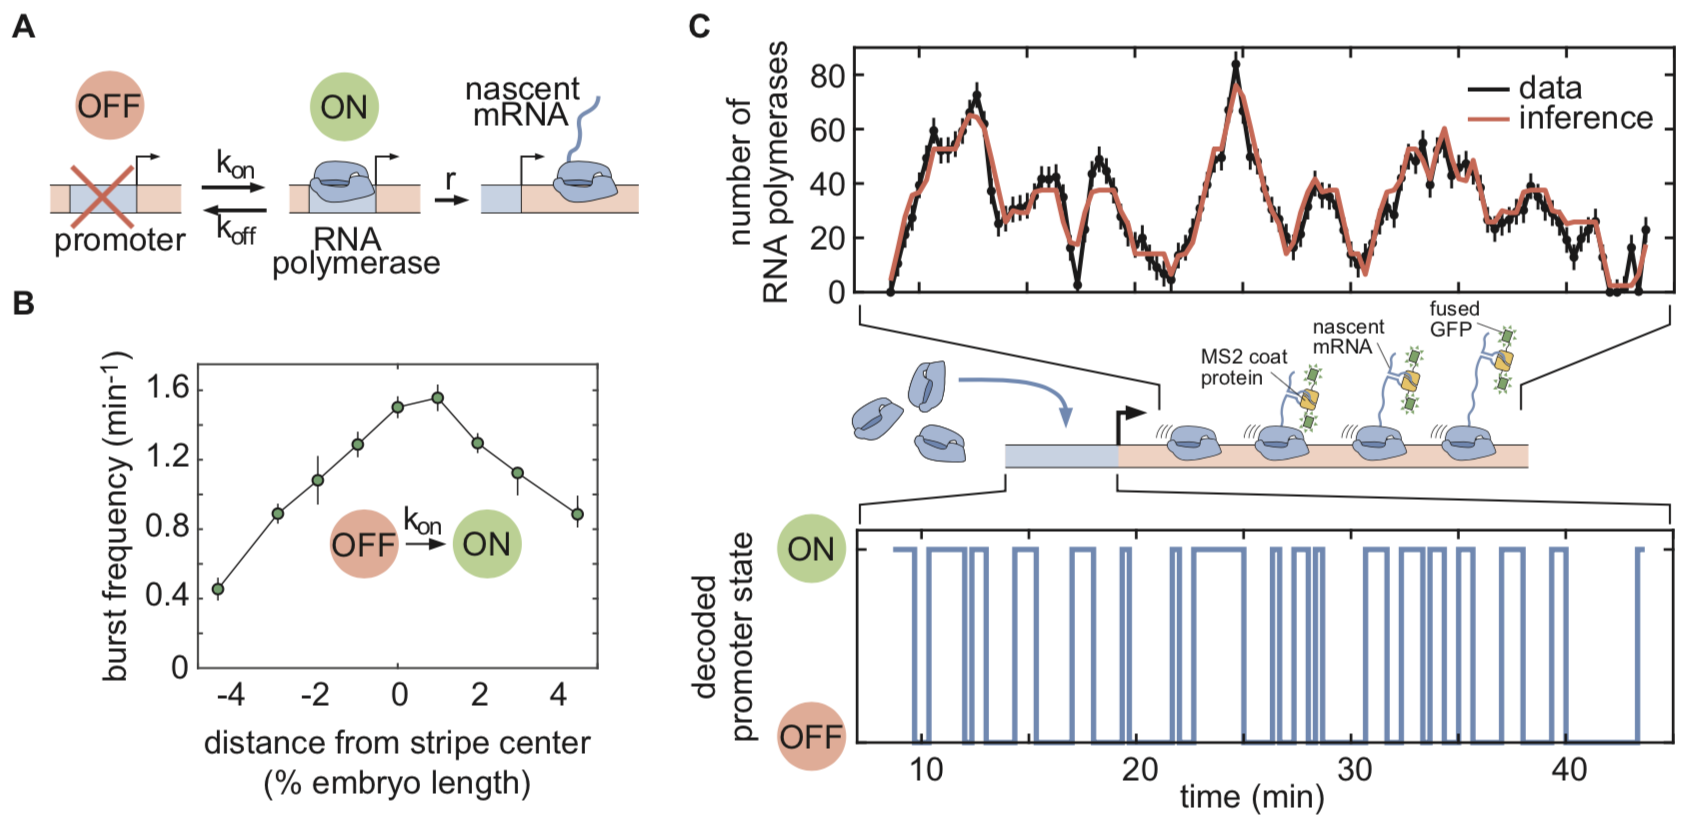
Figure 1: cpHMM inference based on a kinetic model of promoter activity. (A) Random telegraph model of gene activity with three kinetic rate parameters. (B) Inferred spatial modulation of the burst frequency. (C) MS2 traces, representing aggregate signals from all elongating polymerases, deconvolved to yield the hidden promoter state dynamics.
Temporal, not spatial regulation explains the majority of stripe formation
Our cpHMM inference provided a prediction for the shape of the eve stripe 2 pattern, assuming that it was formed entirely through the spatial control of the burst frequency (green profile in Figure 2B). To our surprise, this “bursting only” prediction significantly underestimated the true dynamic range of the stripe pattern as revealed by our live imaging data (red profile in Figure 2B).
Going back to the raw data, we realized what was happening: the most striking aspect of eve stripe 2 expression is not the control of the average rate of mRNA production (via the control of transcriptional bursting), but, instead, the simple fact that the period of time over which gene loci engaged in bursty transcription was sharply controlled across the stripe. Eve loci in the stripe center were active for >40 minutes, while those on the stripe flanks were active for only 10-15 minutes. This indicated that the stripe pattern was being driven by the joint action of two distinct regulatory strategies, the control of the mean rate and the control of the transcriptional time window (Figure 2A).
We developed a simple quantitative model to connect observed control of the transcriptional time window activity over time with the predicted corresponding pattern of eve mRNA concentration. The model indicated that, indeed, this simple control of the duration of the period of transcriptional activity amongst nuclei on the stripe flanks accounted for the majority of stripe formation (blue profile, Figure 2A), while the control of the rate of mRNA production during the active window–the modality that had been the focus of most studies to date–only served to refine and sharpen this stripe. Thus, while transcriptional bursting certainly provides a window into the molecular nature of transcriptional control, the regulation of the period of time over which transcription occurs is the key strategy employed by the fly to realize the sharp eve stripe 2.
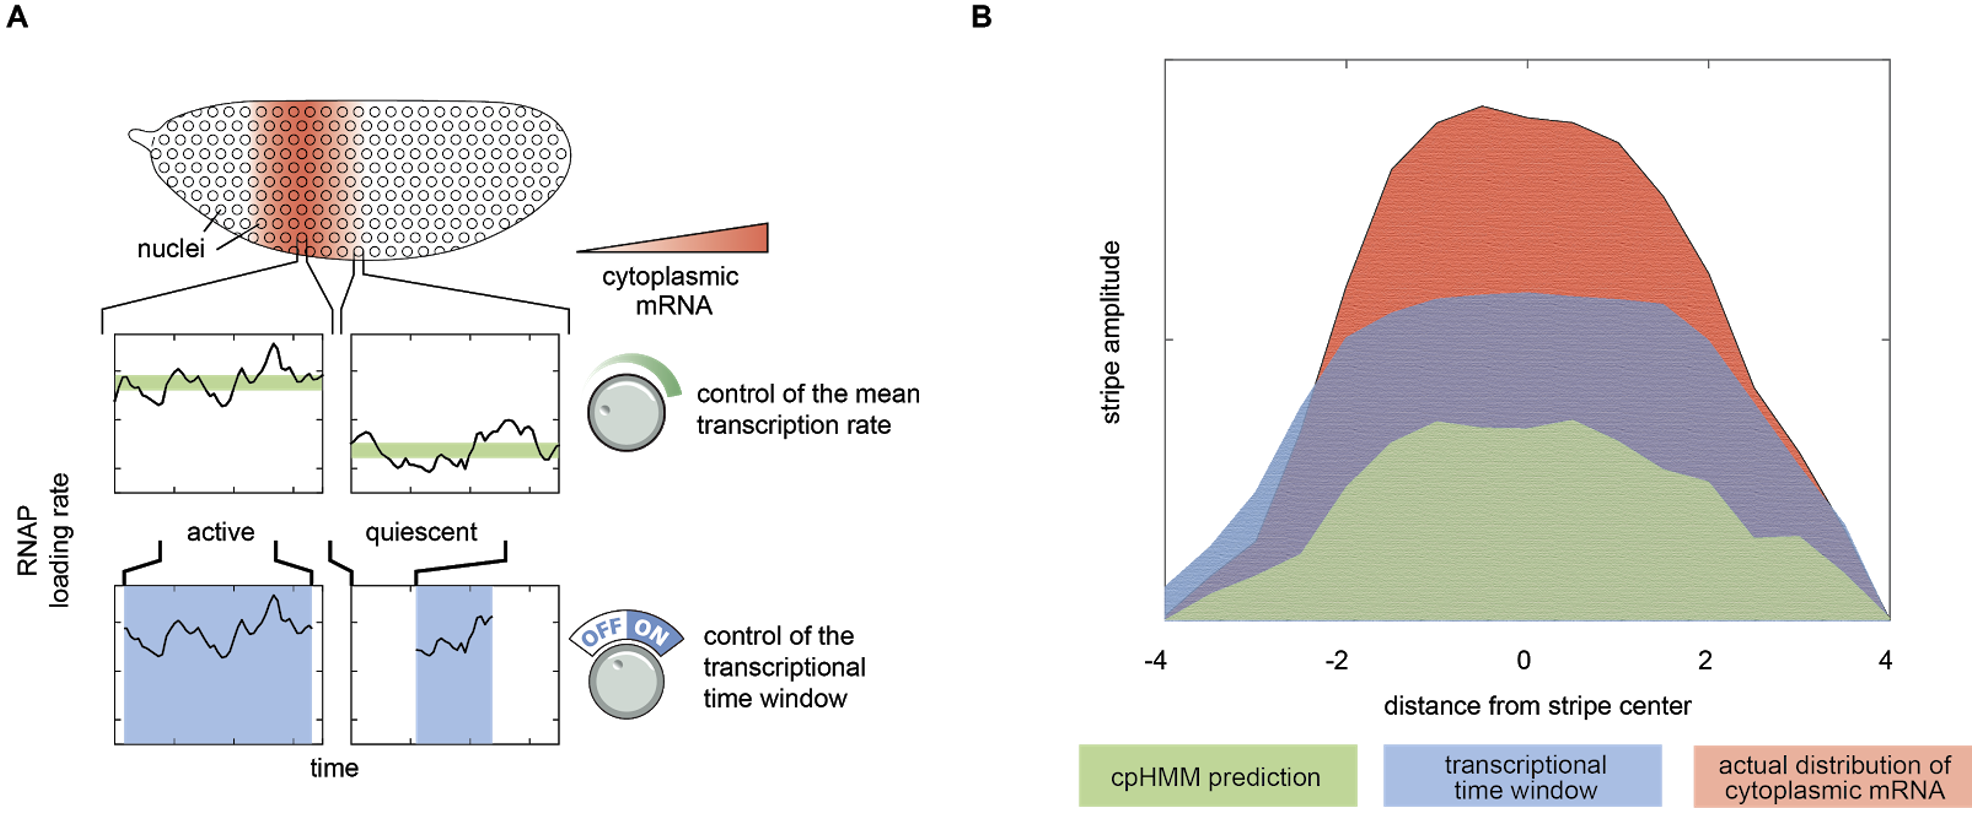
Figure 2: Two regulatory strategies driving stripe formation. (A) Our analysis revealed that eve stripe 2 is generated through the interplay between two different regulatory strategies: the control of the transcription rate while loci are active, and the control of the amount of time that loci are active. (B) A simple model indicated that the control of the transcriptional time window plays the dominant role in driving stripe formation.
We hypothesized that these two “control strategies” for stripe formation (control of average mRNA production rate and control of the transcriptional time window) might result from two different underlying molecular mechanisms. To test this hypothesis, we developed a simple model that used logistic regressions to relate the fraction of nuclei that had ceased transcribing at a given time and location to the concentrations of the four known eve stripe 2 regulators. We applied this framework to our live imaging data, along with a time series of transcription factor concentrations derived from fixed tissue experiments that was previously published by the Gregor Lab at Princeton[17]. The results indicated that the timing with which eve loci on the stripe boundaries stopped transcribing could be explained entirely by the progressive increase in the levels of Giant and Krüppel over time, and–surprisingly–was insensitive to the concentration dynamics of the activators Bicoid and Hunchback. These results suggest that the repressors act to turn off eve loci in nuclei on the stripe edges via a molecular pathway that is orthogonal to the one that controls transcriptional bursting and the mean rate of transcription.
Future directions
While our study focused on the pattern driven by the eve stripe 2 enhancer in developing Drosophila embryos, the quantitative techniques we developed to dissect transcriptional bursting and to connect output transcription dynamics to input transcription factor concentrations are quite general. It is our hope that these tools can be used by researchers to gain insight into the transcriptional regulation of other genes both in Drosophila and in other organisms. To facilitate this, we are making the code for cpHMM publicly available at https://github.com/GarciaLab/cpHMM. With respect to new research directions, we have recently collaborated with the Eisen Lab at Berkeley to study the transcriptional dynamics of the full eve locus. There, we found that despite being created by the largely independent activity of five discrete enhancers, the seven eve stripes are sculpted by the same basic regulatory strategies[18].
In addition to inferring the kinetic parameters of promoter activity, our methodology also allows us to decode individual activity traces and find the most likely promoter state sequences (Figure 1C, Video 1). In future work, we hope to utilize this feature of our methodology to dissect the temporal interplay between the fluctuations in the local concentration of transcription factors at a transcriptional locus and the initiation of transcriptional bursts. Specifically, we plan to correlate the inferred promoter state sequence information with real-time measurements of transcription factor concentrations in individual nuclei, which is now possible due to the LlamaTag technology that was recently developed by our colleague Jacques Bothma[19]. Combining these computational and live imaging techniques will allow us to examine the concentration of transcription factors at the start and end of transcriptional bursts, shedding light on how individual transcription factors act within the transcriptional cycle.
Written by Nick Lammers, Vahe Galstyan and Hernan Garcia
[1] “Positional information, in bits | PNAS.” 8 Oct. 2013, https://www.pnas.org/content/110/41/16301. Accessed 9 Feb. 2020.
[2] “Precise developmental gene expression arises from globally ….” https://www.ncbi.nlm.nih.gov/pubmed/23953111. Accessed 9 Feb. 2020.
[3] “The appeasement of Doug: a synthetic approach to enhancer ….” https://pubs.rsc.org/en/content/articlelanding/2016/ib/c5ib00321k. Accessed 9 Feb. 2020.
[4] “Multimodal transcriptional control of pattern formation … – PNAS.” 27 Dec. 2019, https://www.pnas.org/content/117/2/836. Accessed 9 Feb. 2020.
[5] “Regulation of even-skipped stripe 2 in the … – NCBI – NIH.” https://www.ncbi.nlm.nih.gov/pubmed/1327756. Accessed 9 Feb. 2020.
[6] “Quantitative Imaging of Transcription in Living Drosophila ….” 17 Oct. 2013, https://www.cell.com/current-biology/abstract/S0960-9822(13)01113-5?code=cell-site. Accessed 9 Feb. 2020.
[7] “Dynamic regulation of eve stripe 2 expression reveals … – PNAS.” 3 Jul. 2014, https://www.pnas.org/content/111/29/10598. Accessed 9 Feb. 2020.
[8] “Enhancer Control of Transcriptional Bursting. – NCBI – NIH.” https://www.ncbi.nlm.nih.gov/pubmed/27293191. Accessed 9 Mar. 2020.
[9] “Enhancer Priming Enables Fast and Sustained Transcriptional ….” 19 Aug. 2019, https://www.sciencedirect.com/science/article/pii/S1534580719305726. Accessed 9 Mar. 2020.
[10] “A single-molecule view of transcription reveals convoys of ….” 27 Jul. 2016, https://www.nature.com/articles/ncomms12248. Accessed 9 Mar. 2020.
[11] “Real-Time Kinetics of Gene Activity in Individual Bacteria: Cell.” https://www.cell.com/fulltext/S0092-8674(05)01037-8. Accessed 9 Mar. 2020.
[12] “Publications | Laboratory of Robert H. Singer, Ph.D. | Albert ….” https://www.einstein.yu.edu/labs/robert-singer/publications/. Accessed 9 Mar. 2020.
[13] “Direct observation of frequency modulated transcription in ….” 24 Sep. 2013, https://elifesciences.org/articles/00750. Accessed 9 Mar. 2020.
[14] “A continuum model of transcriptional bursting | eLife.” 20 Feb. 2016, https://elifesciences.org/articles/13051. Accessed 9 Mar. 2020.
[15] “Mammalian Genes Are Transcribed with Widely Different ….” 22 Apr. 2011, https://science.sciencemag.org/content/332/6028/472. Accessed 27 Mar. 2020.
[16] “Stimulus-induced modulation of transcriptional bursting in a ….” 17 Dec. 2013, https://www.pnas.org/content/110/51/20563. Accessed 27 Mar. 2020.
[17] “Accurate measurements of dynamics and … – NCBI – NIH.” https://www.ncbi.nlm.nih.gov/pubmed/23340845. Accessed 9 Feb. 2020.
[18] “Kinetic sculpting of the seven stripes of the … – bioRxiv.” 11 Jun. 2018, https://www.biorxiv.org/content/10.1101/335901v2. Accessed 14 Feb. 2020.
[19] “LlamaTags: A Versatile Tool to Image … – NCBI – NIH.” 10 May. 2018, https://www.ncbi.nlm.nih.gov/pubmed/29754814. Accessed 9 Feb. 2020.
 (No Ratings Yet)
One thought on “Dissecting modes of pattern formation using live imaging and Hidden Markov Models”
Leave a Reply
Get involved
Create an account or log in to post your story on the Node.
Sign up for emails
Subscribe to our mailing lists.
Wesshalb sind somatische pflanzliche Zellen
Im Gegensatz zu tierischen zellen totipotent?