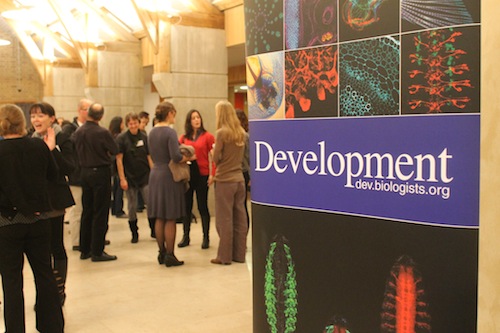
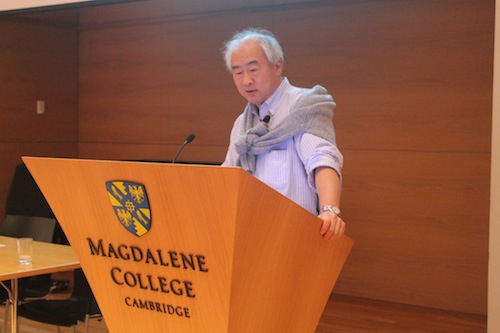
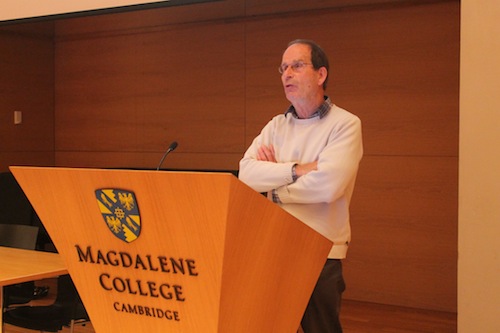
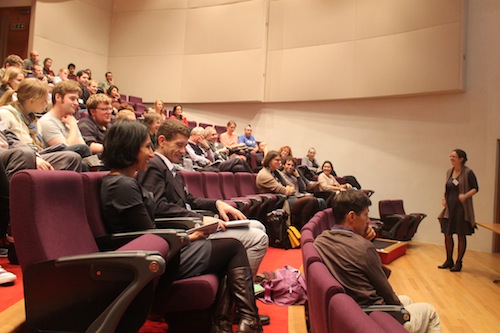
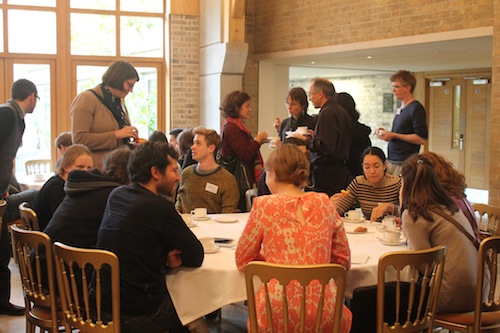
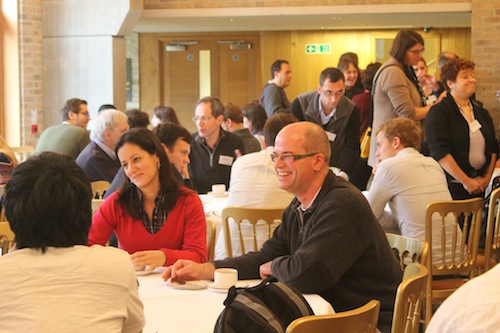
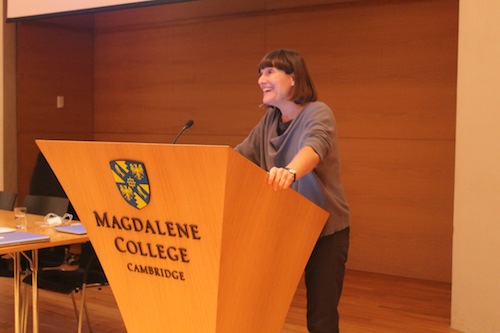
Last Thursday, Development organized a one-day symposium, “Past, Present and Future”, to mark the 25th anniversary of the journal. All speakers were past or present editors of Development, and the work they presented gave a broad overview of the current status of the field.
At the end of the day, a panel discussion looked back at the advancements in developmental biology of the past 25 years, but mostly considered the future of the field. A collection of tweets summarizing the panel discussion is at the end of this post, below the photos. (And if you’re viewing this on the front page of the Node, make sure to click through to the second part of the post to see the remaining photos!)
Kenneth Chien spoke about driving heart progenitor cell fate and regeneration in vivo via chemically modified mRNA – a technique that could have direct therapeutic applications.
Peter Lawrence gave a historical overview of planar cell polarity signalling, as well as discussing his latest insights into how cells orient in a tissue (published recently in Development!).
Magdalena Götz highlighted radial glial cells’ function as stem and progenitor cells in the brain, providing insights into how particular patterns of self-renewal vs. differentiation might define brain region size.
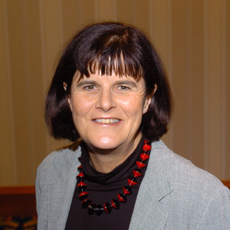
At the EMBO meeting in late September, Linda Partridge gave a keynote talk about the role of the nutrient-sensing insulin/IGF/TOR signaling network in ageing. In her talk she showed, for example, how dietary restriction extends the lifespan of several organisms. I had a chance to talk to her later that day, and I asked her some questions about her research.
What made you decide to study the biology of ageing?
I started out as an evolutionary biologist, and from an evolutionary point of view, ageing is really weird, because it’s a trait that lowers fitness. An animal that didn’t become more likely to die or less fertile with age would leave more offspring. Yet we know that ageing evolves to happen at very different rates in the natural world. If you just look at mammals, some whales can live 200 years, but a shrew can only make a few weeks. It’s a real paradox, and that’s how I got interested in it.
Initially I did a lot of work with Drosophila, looking at the two possible routes to the evolution of ageing: the accumulation of deleterious mutations that only affect the late part of life, and processes that are advantageous to the young but then overshoot in the old and cause problems. In the fly we’ve got quite a lot of evidence for the latter: there’s a distinct trade-off between events early and late in life. That piqued my interest in mechanisms of ageing.
What, if anything, is the overlap of processes that are involved in both development and ageing?
Well, I often say that ageing is not at all like development, because development is a beautifully programmed process: It’s a well-oiled machinery with a hierarchy of genes that make sure that the right things happen in the right place at the right time and that they happen in the same way in all developing system. Ageing is much more haphazard than that, because it’s essentially a side-effect in evolution. It’s a result of the inability of natural selection to hold things together as the animal gets older. So it presents a much more complex picture of different things going on in different individuals and at different times. We don’t think it’s adaptive at all: there aren’t mechanisms that have evolved to cause damage and death.
However, I think some of the things that happen during development – particularly mechanisms promoting growth and cell division – can be the very processes that remain too active and cause problems as the animal gets older. That’s called the hyperfunction idea of ageing, and a very obvious case is cancer.
During your talk you mentioned that it’s really hard to do dietary restriction research in humans because they won’t stick to the diet. Are there any post-hoc population studies?
There have been quite a few comparisons of simply different cultures of humans. Of course that’s always going to just be a correlation, because there could be other differences. But the most remarkable example is the Japanese – in particular the Okinawan Japanese. Okinawa is an island group in the south of the Japanese archipelago, where, seemingly just as a cultural habit, people eat much less than the mainland Japanese, who already eat considerably less than the rest of the world. It just so happens that the Okinawans have the highest proportion of people reaching the age of 100 in the world, and the Japanese mainland is next in line. I think it’s just a correlation, but it’s interesting that their intake is so low and their lifespans are so long – perhaps there is some causal connection between them.
If you had unlimited time and unlimited money, what would you like to research?
I would be very interested in getting directly involved in research with humans that keeps them healthier for longer. That’s the aim of this line of research: to find ways of keeping people healthy in the later part of life so that the period of ill health at the end of life is at least shortened and preferably abolished. One thing I’d like to do are clinical trials, particularly with one or two drugs that already exist for particular conditions but that I suspect – and in fact it’s starting to be demonstrated – have a much wider therapeutic range than has been previously supposed. These two drugs are aspirin and metformin, which is used as a first line of defence against type II diabetes.
So I would be interested in working with humans, but I think there also has to be quite a lot of experimental animal work underpinning that. I would very much like to make new mutant mice for various components of the nutrient sensing pathway, and see how mouse models of slowed ageing interact with specific models of human ageing-related diseases. That’s obviously terribly expensive, so at the moment the sky is definitely not the limit. And in invertebrates, particularly the fly, which is my great favourite, I’d like to do some fast work on basic mechanisms. We don’t really understand what ageing is, and I would love to be able to proceed faster with elucidating the mechanisms of ageing.
All of these things are always resource-limited. That’s what sets the limit on the rate of progress.
Do you have any general advice for students and postdocs who are just starting their research career?
Pick something that you’re interested to work on, because no matter how interested you are and how passionate you are about science, you’re going to have bad moments. There’s a large element of luck in science: Sometimes you do experiments that don’t work. It can be frustrating, it can be slow, so you’d better be interested in the first place. Pick a lab that’s really going to look after you and give you good projects and support you in your projects. Think about the development of your career – whatever that’s going to be. It might be into science, or it might be into something where scientific training is really useful. Whatever it is, you want a mentor who is thinking about you and your future interests.
For female scientists there can sometimes be additional complications. Two-job problems in partnerships apply to everyone, not just women, but sometimes I think women feel them more. The decision when to have kids, can also be a difficult one. Most of the female students and postdocs who pass through my lab do have children while they’re there. I suppose my observation on that is that it’s actually easier the younger you do it. It’s much easier to interrupt a PhD than to be confronted with starting a family and starting your own lab for the first time. I think that’s quite a tough thing to do.
To see Linda Partridge’s answer to my final question, about preparing for conference presentations, see this previous post with speaking tips.
On my desk sits a tattered photocopy of one of the pinnacles of modern developmental biology, the “embryonic lineage” paper by John Sulston, et al. (1983). In this paper, Sulston et al. completed a project begun in the late 19th century, namely to trace the complete genealogy of all cells in a nematode embryo. C. elegans, like many (although not all) nematodes, displays highly invariant development, each embryo developing to an adult with the same number of cells. The introduction of Nomarski DIC optics in the 1960s made it possible for the first time to trace all cells and their divisions in live embryos, a feat performed without significant aid from video recording, and well before the era of computer image analysis.
The ‘embryonic lineage’ paper remains a treasure trove of information and insights. Yet many aspects of development are not captured in the lineage, most significantly information on dynamic movements and neighbor relationships. Further, the extreme amount of time and patience required in manual cell lineage analysis meant that much of this knowledge was unused for several years until video recording allowed manual tracking of cells from a single embryo with tools such as Simi Biocell. A breakthrough was the development by Zhirong Bao and Bob Waterston’s lab of computer based tracking algorithms to automatically trace cell lineages from 4D movies of nuclear histone-GFP markers.
Completely automated nuclear tracking is highly efficient in the early embryo (up to 350 cells). The processes of most interest to my lab, including ectodermal morphogenesis and organogenesis, begin after 350 cells, and our efforts to automatically track cells in these later stages were unsuccessful. Essentially the embryo becomes too crowded with nuclei; also, compromises in illumination and image quality needed to avoid phototoxicity in long 4D confocal movies result in images that are not clear enough for complete automation to be efficient.
Claudiu Giurumescu, a postdoc in my lab, took a different approach to the problem of tracking nuclei in the crowded environment of the later embryo. Importantly, he decided to use a combination of automatic tracking and manual curation. The tracking relies on the predictable behavior of nuclei in worm embryos: most nuclei do not move around much on the time scale used in 4D movies. Claudiu devised algorithms that took advantage of this predictability to search locally for each nucleus at a given time point, based on the information on where the nucleus is at the previous time point. Of course, this means the user has to identify all nuclei at the first time point in the series, which is usually easy for an early embryo. As all nuclei are either tracked or flagged for curation at each time point, error propagation is minimized.
We first tried this approach on embryos imaged with conventional laser scanning confocal microscopy, and were able to successfully follow all nuclei up to the point at which embryonic muscle movements interfere with tracking, a time when all but four nuclei have been generated in the embryo. Sukryool (Alan) Kang, a student with Pam Cosman, played a major role in refining the visualization tools and in quantitative analysis of cell movements. The resulting dynamic models of the embryo can be visualized in a variety of ways, as shown (at rather low resolution) in our Supplementary Material, and at higher resolution on our lab web page: http://132.239.70.11/~wormlab/. Our Matlab code and user manuals are publicly available on Sourceforge. We are still refining the visualization tools and plan to integrate 4D movies more directly with the lineage tree.
We next wanted to assess the generality of our semiautomated approach. We first collaborated with Thomas Planchon and Eric Betzig (Janelia Farm), whom we had met one summer at the MBL in Woods Hole while they were demonstrating their novel structured illumination approach, Bessel beam microscopy. Bessel beam illumination has much higher z-resolution than standard confocal movies, with reduced phototoxicity. Fortunately, Bessel beam 4D movies of C. elegans embryos proved highly amenable to our semiautomated tracking.
How well does this approach work in samples where development is less predictable? To answer this we struck up a collaboration with Debbie Yelon’s lab, our neighbors at UCSD, who were interested in tracking nuclei in zebrafish cardiac morphogenesis. Using data generated by Josh Bloomekatz, our tracking algorithms were able to track large numbers of zebrafish nuclei with only minor modifications.
Our work adds another tool to the toolbox for anyone interested in tracking large sets of nuclei, or similar features, in complex samples. Fully automated tracking remains the method of choice in simple samples where nuclei are well separated and can be unambiguously tracked from frame to frame. Semiautomated tracking allows one to go further into development, and opens up the prospect of quantitative analysis of morphogenetic stages of embryogenesis.
Sulston JE, Schierenberg E, White JG, Thomson JN. The embryonic cell lineage of the nematode Caenorhabditis elegans. Dev Biol. 1983 Nov;100(1):64-119. PubMed PMID: 6684600. (Full text at WormAtlas)
Bao Z, Murray JI, Boyle T, Ooi SL, Sandel MJ, Waterston RH. Automated cell lineage tracing in Caenorhabditis elegans. Proc Natl Acad Sci U S A. 2006 Feb 21;103(8):2707-12. Epub 2006 Feb 13. PubMed PMID: 16477039; PubMed Central PMCID: PMC1413828.
Giurumescu, C.A., Kang, S., Planchon, T.A., Betzig, E., Bloomekatz, J., Yelon, D., Cosman, P. & Chisholm, A.D. (2012). Quantitative semi-automated analysis of morphogenesis with single-cell resolution in complex embryos, Development, 139 (22) 4279. DOI: 10.1242/dev.086256
Development and evolution of median fin in chordates
A post-doc position is available in the group of Sébastien DARRAS. The group has been recently established at the marine station of Banyuls-sur-mer (Mediterranean coast, close to the Spanish border). We are interested in the molecular control of the ascidian Ciona intestinalis embryogenesis. Our focus is on gene networks involved in patterning and differentiation of larval tail epidermis that gives rise to peripheral sensory neurons and median fin blades. We want to use the diversity of basal marine chordate species (tunicates and cephalochordates) available at the marine station to probe the evolution of median fin formation.
The post-doctoral research project aims at comparing at genomic and functional levels the same developmental process in multiple species. Strong background in developmental and molecular biology, as well as curiosity are required. Experience with non-conventional model organisms will be appreciated.
Funding by the French Research Agency (ANR) is avalaible immediately, but applicants are expected to apply for their own financial support.
Laboratoire de Biologie Intégrative des Organismes Marins (BIOM)
UMR7232 CNRS-INSB-UPMC
Observatoire Océanologique de Banyuls
Avenue du Fontaulé
66650 Banyuls-sur-mer
FRANCE
Postdoc position in appendage skeletal development and evolution
An NSF funded postdoctoral position of up to 3 years, is available from 1 February 2013 to work with Dr Marcus C. Davison the evolution of Hox gene regulation in fin and limb skeletal patterning, using North American paddlefish (Polyodon spathula) and axolotl (Ambystoma mexicanum) as model systems.
Applicants must have a PhD in an area of biology with strengths in developmental biology. The qualified applicant will have significant experience in molecular biology techniques including: PCR techniques, primer design, antisense riboprobe construction, whole mount in situ hybridization. Experience working with aquatic vertebrate embryos and larvae (zebrafish, axolotl, Xenopus, and/or non-model taxa) is essential, as are basic histology skills. Experience with focal electroporation and microinjection tecnhniques in aquatic vertebrates is highly desired for this project. Additionally, experience with transcriptome data and analysis will be an advantage. Applicants must be prepared for extensive and rigorous experimental hours during the short embryonic growth season (April and May) for paddlefish.
Send applications including a CV, a statement of research interests and the names of three references to: Dr Marcus Davis, Dept. of Biology and Physics, 1000 Chastain Road, Bldg #12, Kennesaw, GA 30144. Electronic submissions are preferred and can be sent to: mdavi144@kennesaw.edu.
During my short time as Editor-in-Chief of Biology Open (BiO), I’ve come to realise that publishing in the biomedical sciences is entering a period of profound change, the likes of which none of us has experienced before. The present system is under sustained attack and, although many scientists are probably unaware of this, there seems little chance that it will survive in its current form. In this Editorial, I want to share what I’ve learned over the past year and explain why I think change is inevitable. As in all things scientific, I will probably be wrong in detail, but I hope these thoughts will stimulate you to think about these issues and how we might influence them. I am convinced they will have an enormous impact on us all.
My assertion that the present system will inevitably change might seem the wishful thinking of a new Editor of a new journal. But I believe several factors have combined to create a perfect storm that will drive change. At the heart of the problem is that, although the public funds much of our research, we have to pay to access most of the published results. This is because we scientists usually give the copyright to our data to the publishers. Although it is true that most members of the public don’t want to access these data, I’m a member of the public, and I need access because it is essential for my research. It is unacceptable that I (in my case through my institution) have to pay large amounts of money to private publishers for this privilege when the publishers do not pay anything for the research.
Many publishers argue that they impart significant ‘added value’ to the published work by organising the peer review process, editing manuscripts, and distributing the journals. This argument may have had merit in the past, but it does not today; modern web-based publishing methods mean that the costs of producing and distributing journals cannot possibly justify the exorbitant price of most journals or the high profit margins of some of the biggest publishers (http://bit.ly/jordanref1; http://bit.ly/jordanref2). Moreover, the most valuable part of the services provided by publishers is peer review, which is provided free by scientists.
Why then has the present system, so obviously flawed, survived for so long? I think the most important reason is that the impact-factor-led hierarchy of journals has provided a simple mechanism for ranking a scientist’s worth, and this system is now so embedded in our culture that we believe we cannot function without it. Few scientists have the time to read and understand someone else’s papers anymore, and the convenience of the journal hierarchy means we don’t have to: we all understand that a paper published in a high-impact journal must be ‘better’ than one published in a lesser journal. Scientists, funding agencies, and the various bodies that hire and promote us have all adopted this simple system, even though most scientists realize that it is flawed and, ironically, often feel unfairly treated by it. Still, most of us seem to have accepted that the system generally gets things about right and ensures that modern biological science works as a meritocracy. I will argue below that the system does nothing of the sort and that, worryingly, it is now actually distorting and impeding the scientific enterprise.
Here are the research highlights from the current issue of Development:
Nodal regulates germ cell potency
During mammalian gonadal development, somatic cues regulate the sex-specific development of foetal germ cells and control the transition between proliferation and cell-fate commitment. This transition is particularly important for male germ cells: too little proliferation reduces sperm numbers and fertility, whereas escape from commitment and prolonged pluripotency can cause testicular germ cell tumours. Now, Josephine Bowles, Peter Koopman and colleagues (p. 4123) report that the TGFβ morphogen Nodal regulates this transition in mice. The researchers show that Nodal signalling is active in XY germ cells at the developmental stage when this transition occurs and that Nodal signalling is triggered when somatic signals, including FGF9, induce testicular germ cells to upregulate the Nodal co-receptor Cripto. Genetic suppression of Nodal signalling leads to depressed pluripotency marker expression and early XY germ cell differentiation, they report, whereas NODAL and CRIPTO are upregulated in human testicular tumours. These results indicate that Nodal signalling regulates male germ cell potency during normal development and provides new clues about the aetiology of testicular cancer.
Cardiomyocyte migration mends broken hearts
Unlike adult mammals, adult zebrafish can regenerate injured heart tissue. Heart regeneration in zebrafish is known to involve partial de-differentiation and proliferation of cardiomyocytes, but are cardiomyocytes involved in any other processes during heart repair? Here (p. 4133), Yasuhiko Kawakami and co-workers report that cardiomyocyte migration to the injury site is required for zebrafish heart regeneration. Ventricular amputation, they report, induces expression of the chemokine ligand cxcl12a and the chemokine receptor cxcr4b in epicardial tissue and cardiomyocytes, respectively. Both pharmacological inhibition of Cxcr4 function and genetic loss of cxcr4b function prevent heart regeneration, they show, and lead to mislocalisation of proliferating cardiomyocytes outside the injury site without affecting cardiomyocyte proliferation. Finally, the researchers use a photoconvertible fluorescent marker to show that, although cardiomyocytes migrate into the injury site in control hearts, their migration is inhibited in Cxcr4-antagonist-treated hearts. Thus, cardiomyocyte migration into injured zebrafish heart tissue is regulated independently of cardiomyocyte proliferation, and coordination of both processes is essential for heart regeneration.
Hox genes specify nephric ducts
In amniote embryos, three kidneys – the pronephros (a transient embryonic structure), the mesonephros (the embryonic kidney) and the metanephros (the adult kidney) – form sequentially along the anterior-posterior (AP) axis of the intermediate mesoderm (IM). Here (p. 4143), Thomas Schultheiss and colleagues investigate AP patterning in the mesoderm by analysing the specification of the avian embryonic nephric duct – an unbranched epithelial tube that originates in the anterior IM. Using quail-chick chimaeric embryos, the researchers show that nephric duct specification occurs early in development when IM precursor cells are still in the primitive streak. HoxB4, they report, is expressed in nephric duct precursors from the primitive streak stage onwards, whereas the more posterior Hox gene HoxA6 is expressed in non-duct IM. Notably, misexpression of HoxA6 in the duct-forming regions of the IM represses duct formation. Together, these results indicate that Hox genes regulate AP patterning in the IM and provide new insights into general mesodermal patterning along the AP axis and into kidney evolution.
Cohesin quells Polycomb group silencing
Polycomb group (PcG) genes encode transcriptional repressors that regulate gene expression during development. Most PcG genes encode subunits of chromatin-modifying complexes, but exactly how PcG proteins repress transcription is unclear. Now, Judith Kassis and colleagues report that Wapl, a cohesin-associated protein involved in cohesin removal from chromosomes, promotes PcG silencing in Drosophila (p. 4172). To identify genes involved in PcG silencing, the researchers conduct a screen for suppressors of silencing mediated by an engrailed PcG response element. They identify one of the suppressors obtained from this screen as waplAG, a dominant wapl mutation that produces a truncated Wapl protein. The researchers show that waplAG hemizygotes die as pharate adults (insects prior to emergence from pupae) but have an extra-sex-comb phenotype similar to that produced by mutations in PcG genes. Finally, the researchers show that Wapl-AG increases the stability of cohesin binding to polytene chromosomes. Together, these results suggest that increasing cohesin stability can interfere with PcG silencing, and that cohesin thus directly inhibits PcG function.
Human skin innate immunity develops early
The skin protects the body from microbial pathogens by employing Toll-like receptors (TLRs) and other molecules that recognise pathogen-associated molecular patterns to initiate innate immune responses and to direct subsequent adaptive immunity. But when does the innate immune system in human skin become immunologically competent? On p. 4210, Adelheid Elbe-Bürger and co-workers answer this question by analysing TLR expression and function in human skin. The researchers report that, although prenatal and adult skin express a similar spectrum of TLRs, prenatal, infant and child skin express higher levels of several TLRs (particularly TLR3) than adult skin. Moreover, a synthetic TLR3 ligand that mimics viral double-stranded RNA significantly enhances the secretion of several chemokines and cytokines by keratinocytes isolated from foetal and neonatal donors but not by those isolated from adult donors. Thus, the researchers conclude, human skin exhibits age-related changes in TLR expression and function, and foetal keratinocytes are already endowed with specific immune functions that may protect the developing human body from viral infections.
Calcium crosstalk during plant fertilisation
During sexual reproduction in flowering plants, cellular interactions guide the growth of the pollen tube from the stigma to the embryo sac where fertilisation occurs. The cytoplasmic Ca2+ concentration ([Ca2+]cyt) regulates pollen tube growth, but does it also regulate pollen tube guidance and reception? On p. 4202, Seiji Takayama and colleagues investigate Ca2+ dynamics during fertilisation by expressing a Ca2+ sensor in Arabidopsis pollen tubes and synergid cells (cells in the ovule that guide the pollen tube). During semi-in vivo fertilisation, they report, pollen tubes turn towards wild-type ovules but not towards ovules in which pollen tube guidance has been genetically disrupted. Notably, [Ca2+]cyt is higher in turning pollen tube tips than in non-turning tips. Moreover, [Ca2+]cyt oscillation in the synergid cells, which reaches a maximum at pollen tube rupture, begins only upon pollen tube arrival. These results suggest that signals from the synergid cells induce Ca2+ oscillations in the pollen tube and vice versa, and that these oscillations are involved in pollen tube guidance and reception.
Plus…
The year 2012 marks 25 years since the journal Development was relaunched from its predecessor, the Journal of Embryology and Experimental Morphology (JEEM). To mark a quarter century of Development, we have been looking through our archives at some of the most influential papers published in Development’s pages. In a series of ‘Development Classic’ articles, we have asked the authors of those articles to tell us the back-story behind their work and how the paper has influenced the development of their field. The first two of these articles (see below) are published in this issue – look out for more of these Spotlight papers in the next few issues.
The ABC model of flower development: then and now
In 1991, John Bowman, David Smyth and Elliot Meyerowitz published a paper in Development that proposed the ABC model of flower development. Now, the authors look back on their paper and discuss several aspects of this story.
In December 1996, in a special issue of Development, 37 papers reported the results of two large screens for zebrafish mutants performed in Tübingen and Boston. Now, Christiane Nüsslein-Volhard gives a personal account of the history of this unique endeavor.
Eph receptors and their membrane-tethered ephrin ligands have important functions in development. Rudiger Klein provides an overview of the general structures and signalling mechanisms underlying Eph/ephrin signalling in development.
See the Development at a Glance poster article on p. 4105
In vitro organogenesis in three dimensions: self-organising stem cells
Organ formation during embryogenesis is a complex process that involves various local cell-cell interactions at the molecular and mechanical levels. Yoshiki Sasai and colleagues discuss how, despite this complexity, organogenesis can be modelled in vitro using stem cells.
Postdoctoral Researcher Morphogenesis during animal development
The Sars International Centre for Marine Molecular Biology is now offering a two-year postdoc position in a research group working on morphogenesis using the notochord development in Ciona intestinalis as the model. The announced position focuses on the construction and regulation of the actomyosin network that is involved in cell elongation during the early phase of notochord tubulogenesis. Interested individuals can read two publications, Dong et al., 2011, and Denker and Jiang, 2012, for detailed description of experimental model and the biological questions.
Extensive resources are established for Ciona intestinalis (gene knock down, transgenesis, advanced imaging tools, quantitative analysis of morphogenesis, and published genome).
The position will utilize a broad spectrum of cell biology methods. Applicants with special interests in cytokinesis, actomyosin, advance quantitative imaging are welcome to apply. Prior experience in microinjection and/or dynamic live imaging of embryos are preferred. We seek creative scientist who wishes to explore new experimental system and discover novel mechanism.
The position is available immediately; the start date is negotiable. The salary for Postdoctoral Researcher (code 8151) starts at NOK 480 000.
The Sars International Centre is a partner of the European Molecular Biology Laboratory (EMBL) and a department of Uni Research AS, affiliated with the University of Bergen. The Centre is focused on basic research in marine molecular biology, developmental biology and evolution, through genetic and comparative studies of invertebrates and vertebrates.
Uni Research has employee insurance and pension agreements and is an equal opportunity employer.
For further information regarding the position and scientific content of the project please contact Dr. Di Jiang, Group Leader: di.jiang@sars.uib.no.
Written applications in English, including CV, summary of educational and work experience, a brief statement of research interest and contact information for two references can be sent to: Uni Sars Centre, HR Officer, Bergen High Technology Centre, Thormøhlensgt. 55, N-5008 Bergen, Norway. Please mark applications 12 Sars 08. Application deadline is November 9 2012.
Please note that applications sent by e-mail will not be considered.
At the EMBO meeting last month, Jiří Friml was awarded the EMBO Gold Medal. This medal is awarded annually to a researcher under the age of forty, who has contributed to the field of molecular biology. Friml got the award for his work on auxin transport and morphogen gradient formation in plants. In his Gold Medal Lecture, he gave an overview of auxin signaling and PIN proteins, and discussed recent discoveries that describe how plants grow in response to light and gravity. The next day he braved a sudden burst of heavy rain to meet me for an interview for the Node:
Why did you decide to study plant developmental biology?
It was not a decision; it was a coincidence. I got a DAAD fellowship to study in Germany for ten months, and went to the lab, which my department in the Czech Republic had contact with. This lab was rather focused on molecular biology and plant physiology. When I started to do my project I realized that there are a lot of developmental biology consequences, and I liked it a lot and then pursued this area further on my own.
You’ve worked in several different countries over your career. Have you seen any particular differences, for example between Germany, Belgium, the Czech Republic? Or is it all quite similar within Europe?
I have to say I was surprised how big the difference is between Germany and Belgium. I mean the difference in mentality and culture of the people, which, to some extent, reflect on science. Germans are famous for being a bit more strict, but on the other hand, they are also extremely reliable, which is very convenient for professional things. Once you’re working in the lab, I don’t see that big a difference between cultures, though. My teams have always been very international: In Belgium I had two Belgians in a lab of twenty so the geographical location didn’t influence the work in the group so much. Many differences between labs are also dependent on what type of institute you are at, and even within one country there is wide variety between institutes or between universities.
I also noticed, that the education system varies between countries. PhD students from the UK are younger and less experienced simply because the education system is different from that in Germany for example.
And in the Czech Republic, after twenty years of being open to the world, there is still a legacy of the fact that genetics was suppressed as a “capitalistic doctrine” during the communist regime. Therefore the country has basically missed a whole generation of geneticists. This is still not fully replaced, so even though other fields like hormonal physiology are very good, anything that requires genetics, and that means most of developmental biology, is underrepresented.
Do you think that’s going to change any time soon?
Well, that’s what we have believed for twenty years now. And it is changing. It’s definitely changing. But, universities are stubborn structures, not only in the Czech Republic, so it’s very difficult to create new departments because that would be usually on the expenses of the old ones.
When you accepted your medal, you said “I’d like to take this as an appreciation for the plant field” and in your talk you showed a slide emphasizing all the things of which people may have forgotten that they were originally discovered in plants: cells, genes, siRNA. Why is plant science under-appreciated?
I wouldn’t say it is under-appreciated. Drosophila science is probably also under-appreciated in comparison to biomedical research. I think there are logical reasons that biomedical research gets more attention. In Europe we are seldom hungry, but we still get cancer and Alzheimer and AIDS. The issues of our health are more important to everybody – including plant scientists –than the issues around improving the quality of food. As a result, plant science is less represented than biomedical research, but I didn’t want to make it seem like we feel under-appreciated, I just wanted to show my own appreciation for my colleagues in the plant field.
In your talk you showed, to roughly summarize it, why plants grow upward. What are the next questions to be answered?
Even though we may understand the basic concepts from the developmental biology point of view, we are still far from really knowing every single step of the molecular signaling pathways underlying the developmental decisions. For example, we’re just starting to understand how the crosstalk between the signaling pathways works: That’s something that is now being worked on in the field of plant signaling.
My personal big question concerns the evolutionary aspect of plant development. With next generation sequencing technology, many of the more primitive plant species are now being sequenced and becoming accessible to study. I’m interested in finding out how plants colonized land, because before plants grew on land roots didn’t need to grow down, and shoots didn’t need to grow up. Many of these auxin-mediated responses are typical for land plants. What we are now interested in is how acquiring these cellular mechanisms helped the plant to adapt to life on land. From the evolutionary point of view, what we also often encounter is an evolutionary conserved cellular mechanism, like clathrin-mediated endocytosis for example, with a plant-specific regulator that somehow feeds into the pathway. We’re trying to understand how that happened, how these new plant-specific regulations were recruited by the conserved mechanisms during evolution.
If you had unlimited time and money, what would you love to investigate?
I would invest in the establishment of new model species at the lower plant level and at algae level to really try to understand how the plant developmental machinery evolved. I would sequence all these species and get people to establish transformation methodology and develop genetic model systems. But this type of thing will be happening anyway: different labs will each do a piece and at the end of the day we will get there.
Do you have any advice for students and postdocs who are just starting their research career?
They should take responsibility. What I see with many students is that they rely too much on what they are told. They are clever, they are working hard, but they are not taking the project as their own and taking their career and life in their own hands. I cannot generalize, because people are different, but I see that this is a major obstacle for many talented young scientists in achieving what they want. They either don’t have enough self-confidence, or they don’t fight enough for it.
There have been exciting advances in molecular analyses of genetic and epigenetic regulation of key cellular processes. This meeting will focus on issues such as chromatin, epigenetics and gene regulation, replication, checkpoints and DNA repair, RNA function and control as they apply to processes of development, stem cells and diseases such as cancer.
This meeting is sponsored by the Genetics Society and celebrates the 25th anniversary of the journal Genes and Development of which the Genetics Society has been a founding participant. The speakers are all distinguished leaders in their respective fields and will present and discuss recent and exciting research developments.
Features
Steve West the 2012 Genetics Society Medal recipient
Speakers
Bruce Stillman
Sharon Dent
Steve Smale
Jerry Workman
Ken Zaret
Titia de Lange
Steve Elledge
Steve Jackson
Susan Gottesman
Elisa Izaurralde
Narry Kim
Jim Manley
Joan Steitz
Hans Clevers
Elaine Fuchs
Nick Hastie
Rich Losick
Eileen White


 What made you decide to study the biology of ageing?
 To mark
 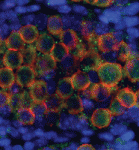 During mammalian gonadal development, somatic cues regulate the sex-specific development of foetal germ cells and control the transition between proliferation and cell-fate commitment. This transition is particularly important for male germ cells: too little proliferation reduces sperm numbers and fertility, whereas escape from commitment and prolonged pluripotency can cause testicular germ cell tumours. Now, Josephine Bowles, Peter Koopman and colleagues (p.
 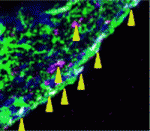 Unlike adult mammals, adult zebrafish can regenerate injured heart tissue. Heart regeneration in zebrafish is known to involve partial de-differentiation and proliferation of cardiomyocytes, but are cardiomyocytes involved in any other processes during heart repair? Here (p.
 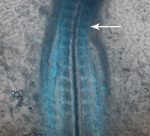 In amniote embryos, three kidneys – the pronephros (a transient embryonic structure), the mesonephros (the embryonic kidney) and the metanephros (the adult kidney) – form sequentially along the anterior-posterior (AP) axis of the intermediate mesoderm (IM). Here (p.
 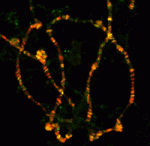 Polycomb group (PcG) genes encode transcriptional repressors that regulate gene expression during development. Most PcG genes encode subunits of chromatin-modifying complexes, but exactly how PcG proteins repress transcription is unclear. Now, Judith Kassis and colleagues report that Wapl, a cohesin-associated protein involved in cohesin removal from chromosomes, promotes PcG silencing in Drosophila (p.
 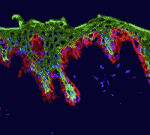 The skin protects the body from microbial pathogens by employing Toll-like receptors (TLRs) and other molecules that recognise pathogen-associated molecular patterns to initiate innate immune responses and to direct subsequent adaptive immunity. But when does the innate immune system in human skin become immunologically competent? On p.
 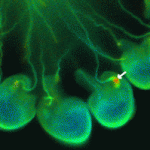 During sexual reproduction in flowering plants, cellular interactions guide the growth of the pollen tube from the stigma to the embryo sac where fertilisation occurs. The cytoplasmic Ca2+ concentration ([Ca2+]cyt) regulates pollen tube growth, but does it also regulate pollen tube guidance and reception? On p.
  In 1991, John Bowman, David Smyth and Elliot Meyerowitz published a paper in Development that proposed the ABC model of flower development. Now, the authors look back on their paper and discuss several aspects of this story.
 In December 1996, in a special issue of Development, 37 papers reported the results of two large screens for zebrafish mutants performed in Tübingen and Boston. Now, Christiane Nüsslein-Volhard gives a personal account of the history of this unique endeavor.
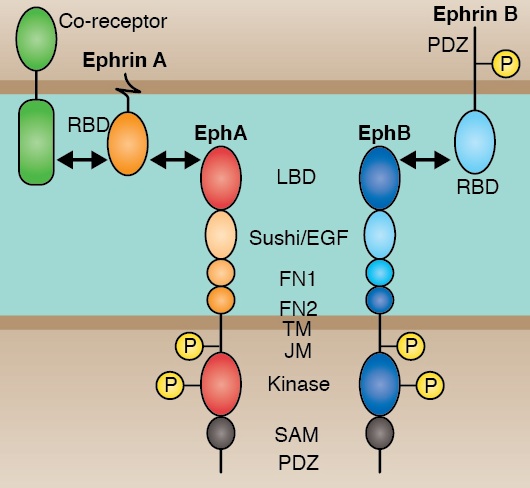 Eph receptors and their membrane-tethered ephrin ligands have important functions in development. Rudiger Klein provides an overview of the general structures and signalling mechanisms underlying Eph/ephrin signalling in development.
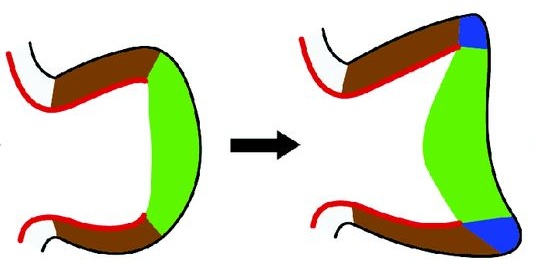 Organ formation during embryogenesis is a complex process that involves various local cell-cell interactions at the molecular and mechanical levels. Yoshiki Sasai and colleagues discuss how, despite this complexity, organogenesis can be modelled in vitro using stem cells.
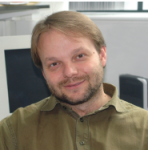 At the EMBO meeting last month, Jiří Friml was awarded the