In January of 2025, advanced graduate students and postdoctoral fellows from across the Americas gathered in Chile to participate in the International Course on Developmental Biology, an EMBO Practical Course held at the Marine Biology Station of Quintay (CIMARQ). Over two weeks of intensive training, the students generated some beautiful images of development across different species. We’re excited to launch a competition to pick an image taken by the students to become the cover of an issue of Development, immortalised in a future issue of the journal – a testament to the bright future of developmental biology in Latin America. The next cohort of the International Course on Developmental Biology is currently accepting applications until 30 July 2026.
Please vote for your favourite image using the poll at the bottom of the page. The voting will close on Wednesday, 24 June 2026, at 13:00 BST (UTC + 1). One vote per person.
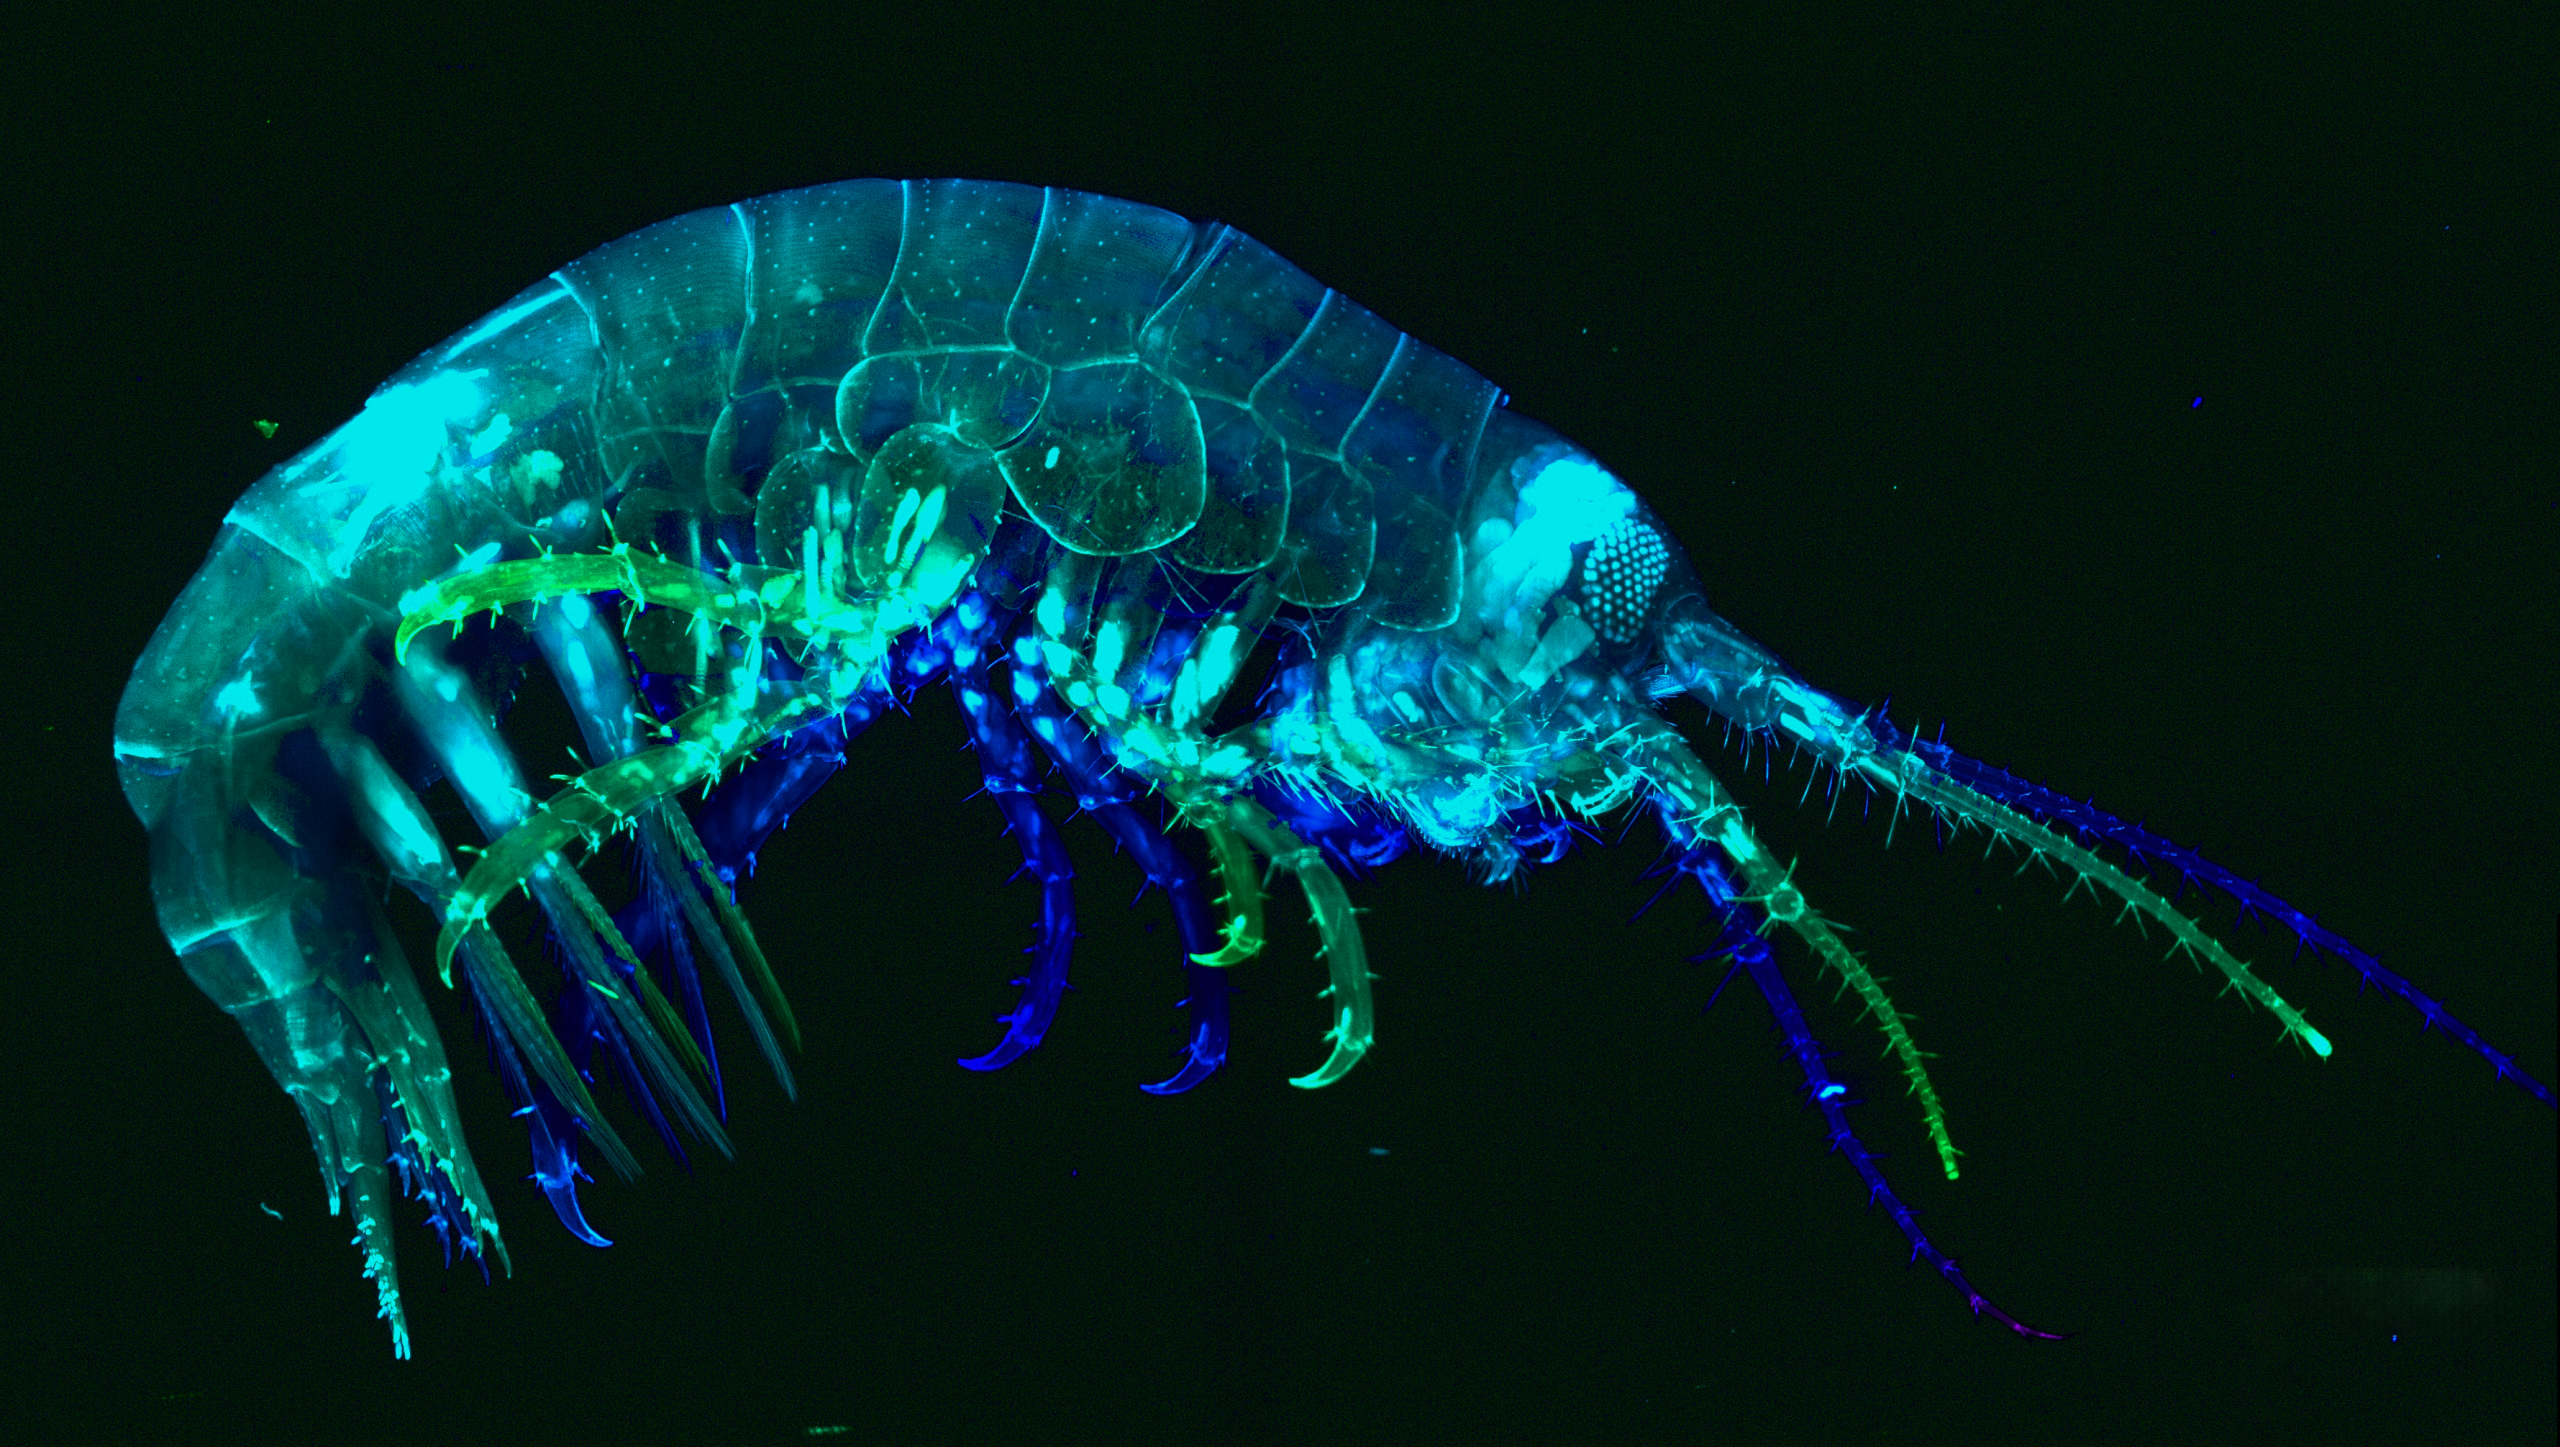
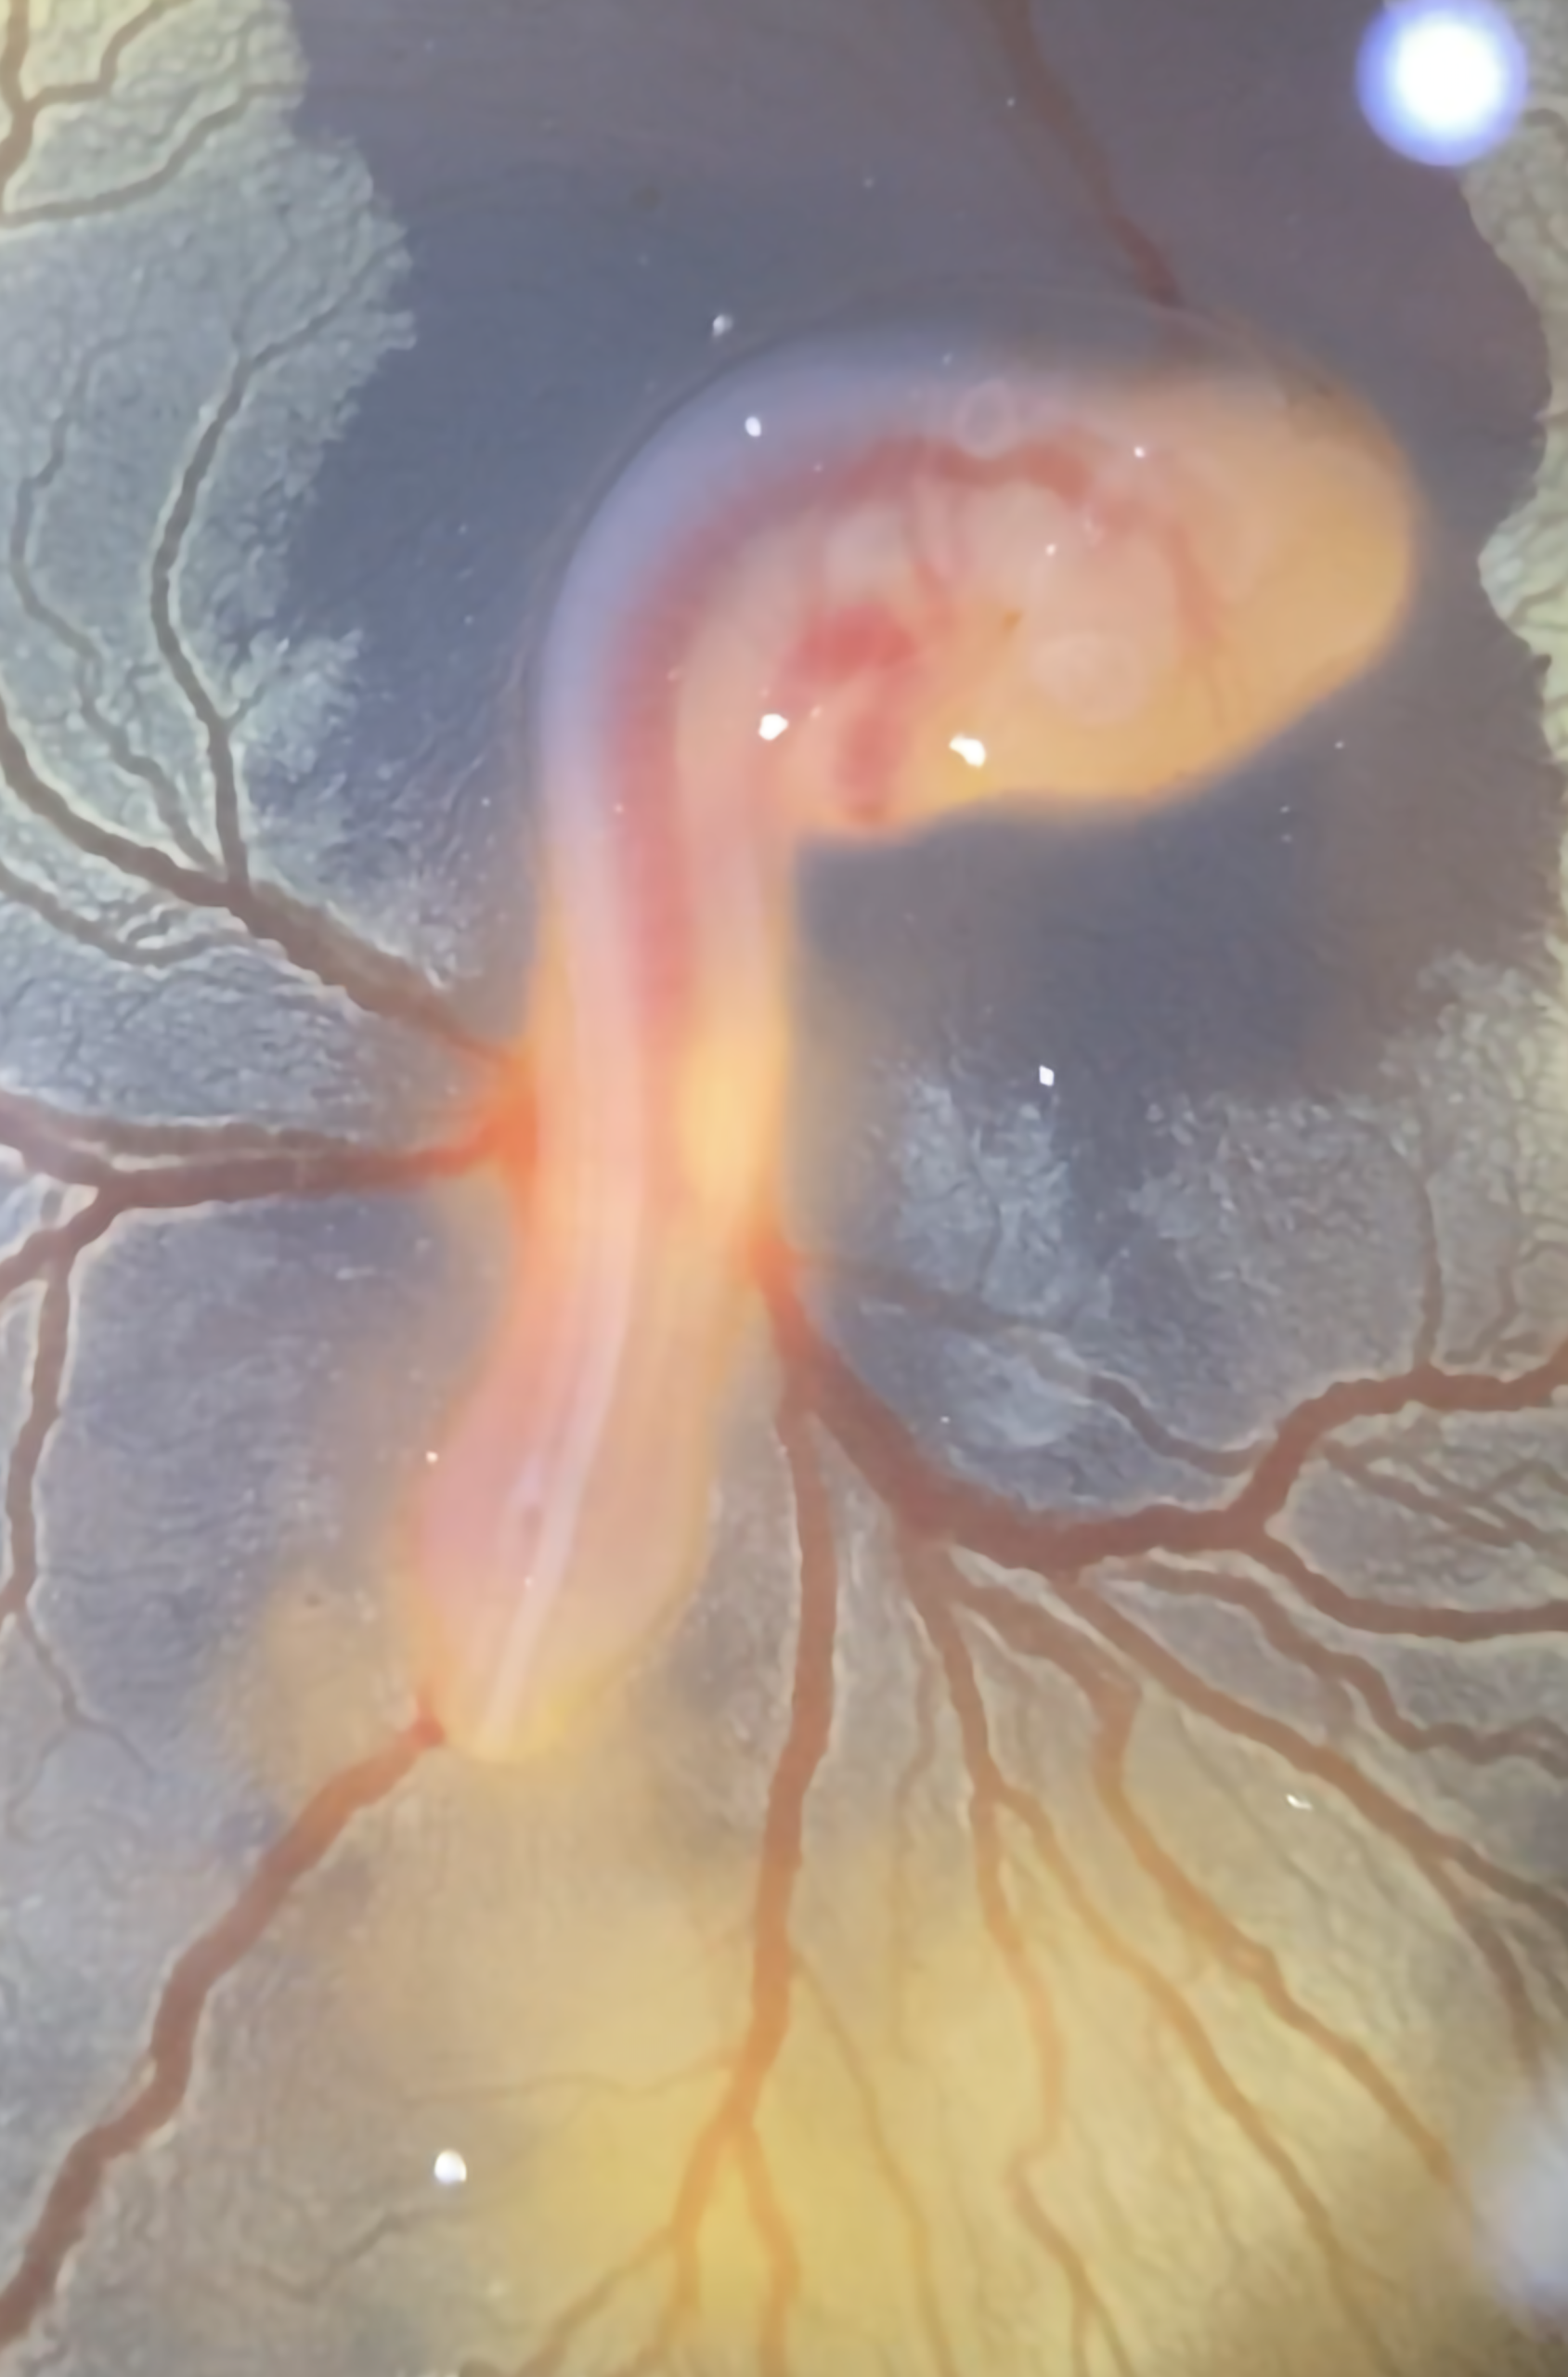
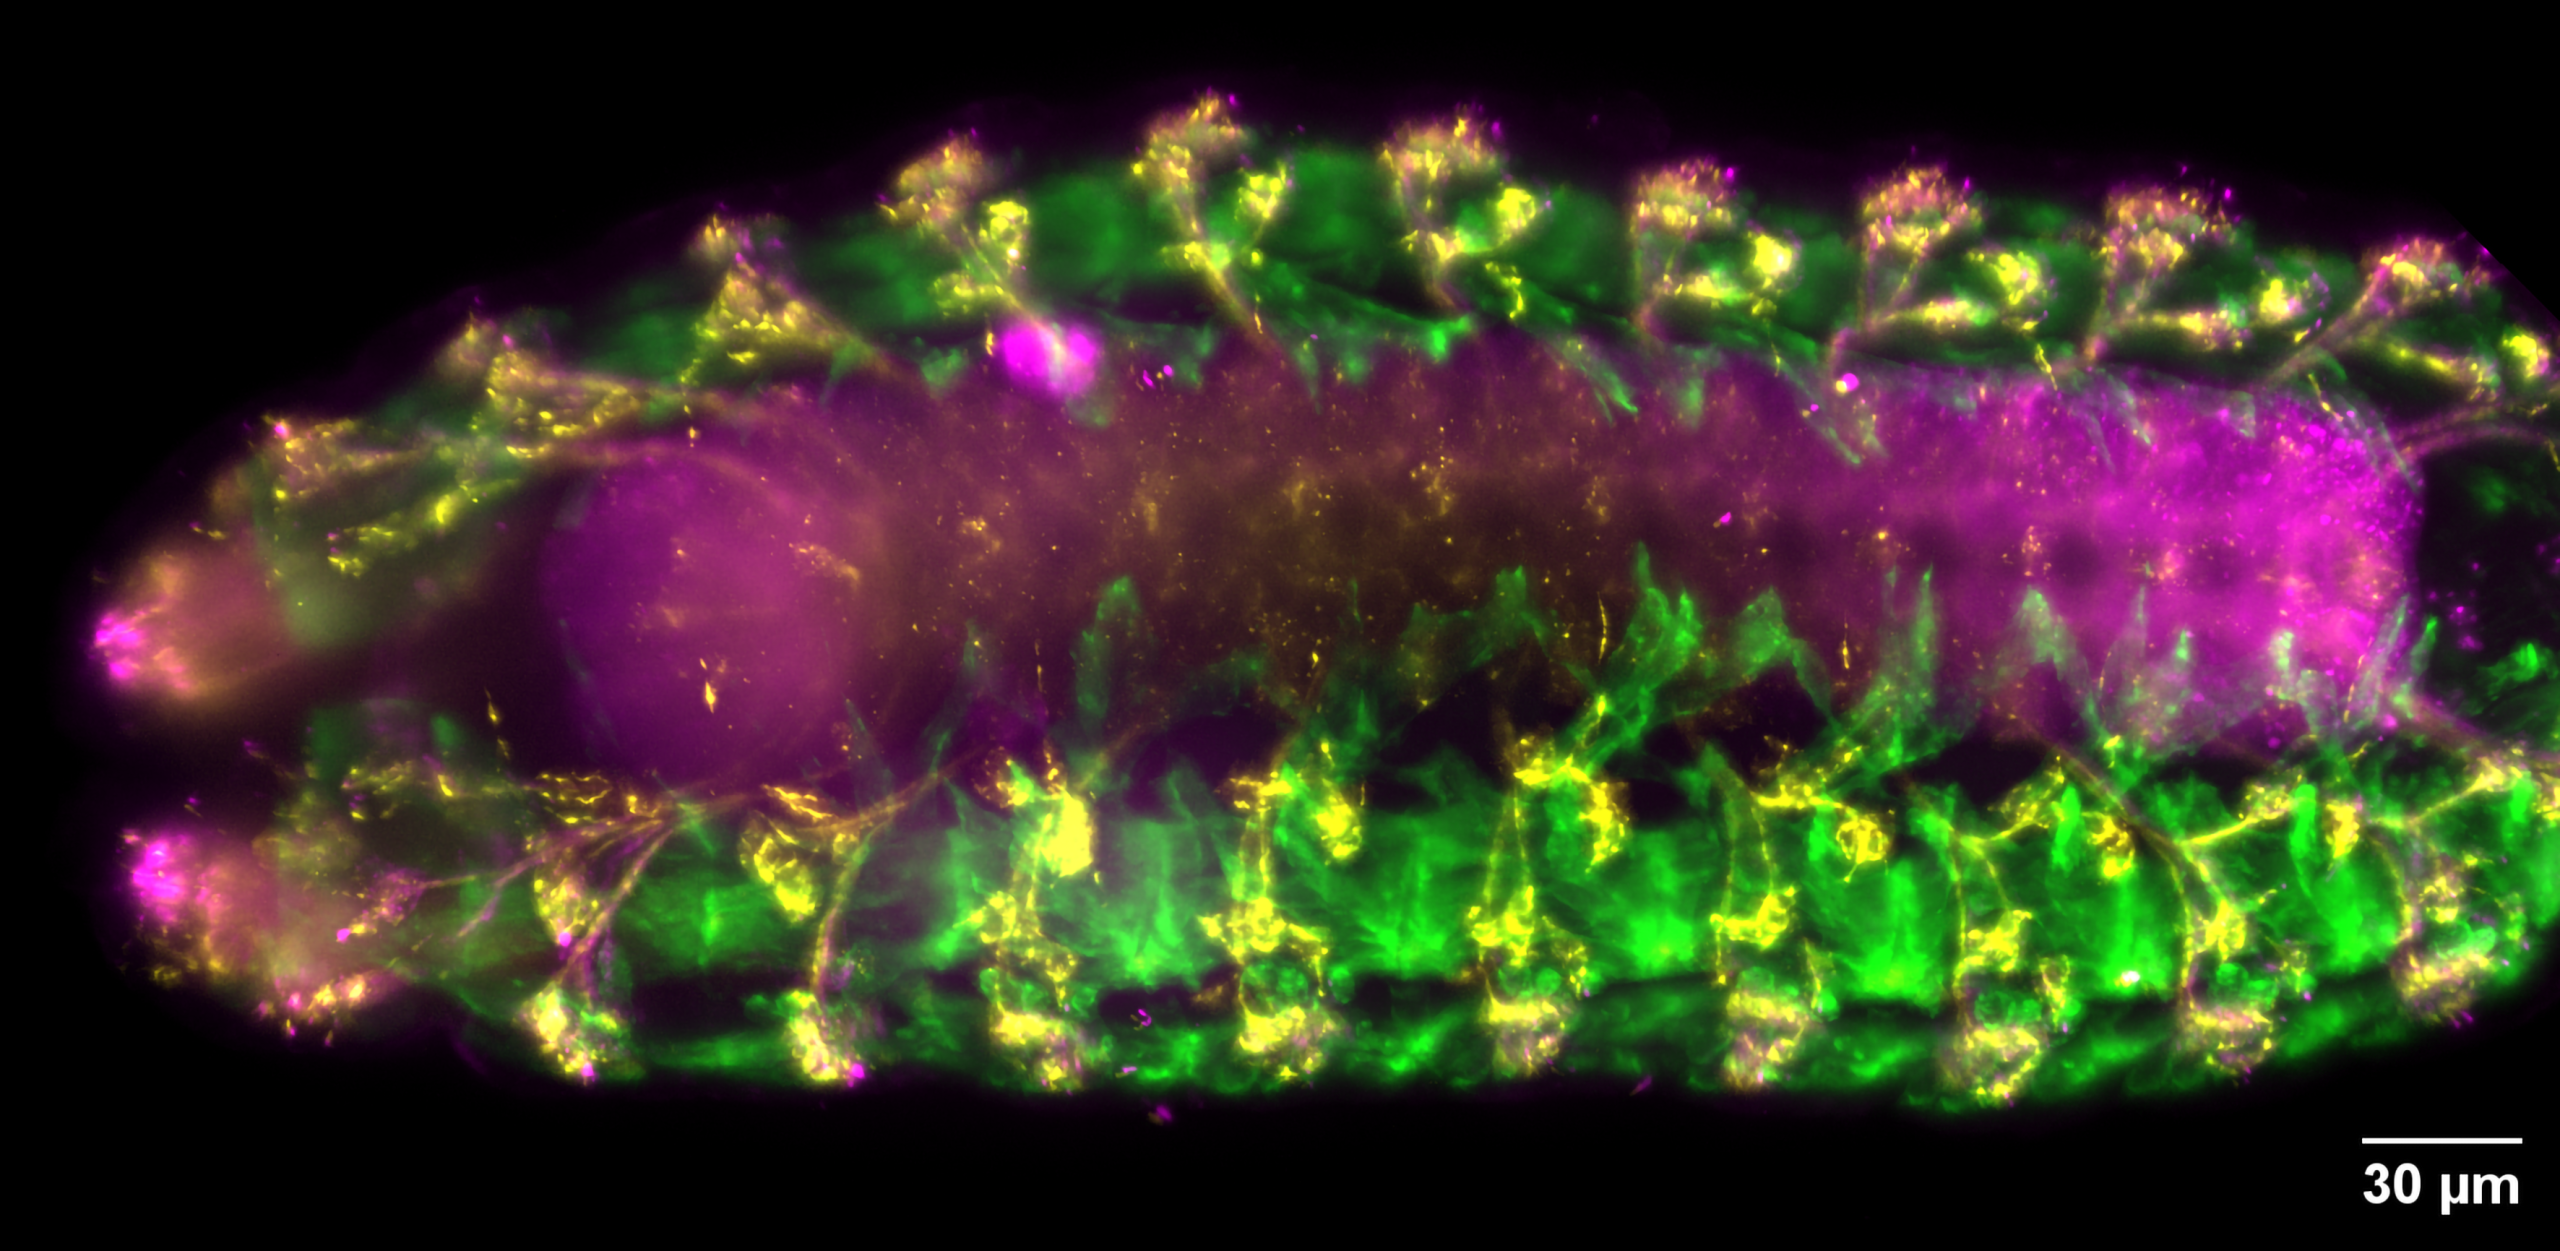
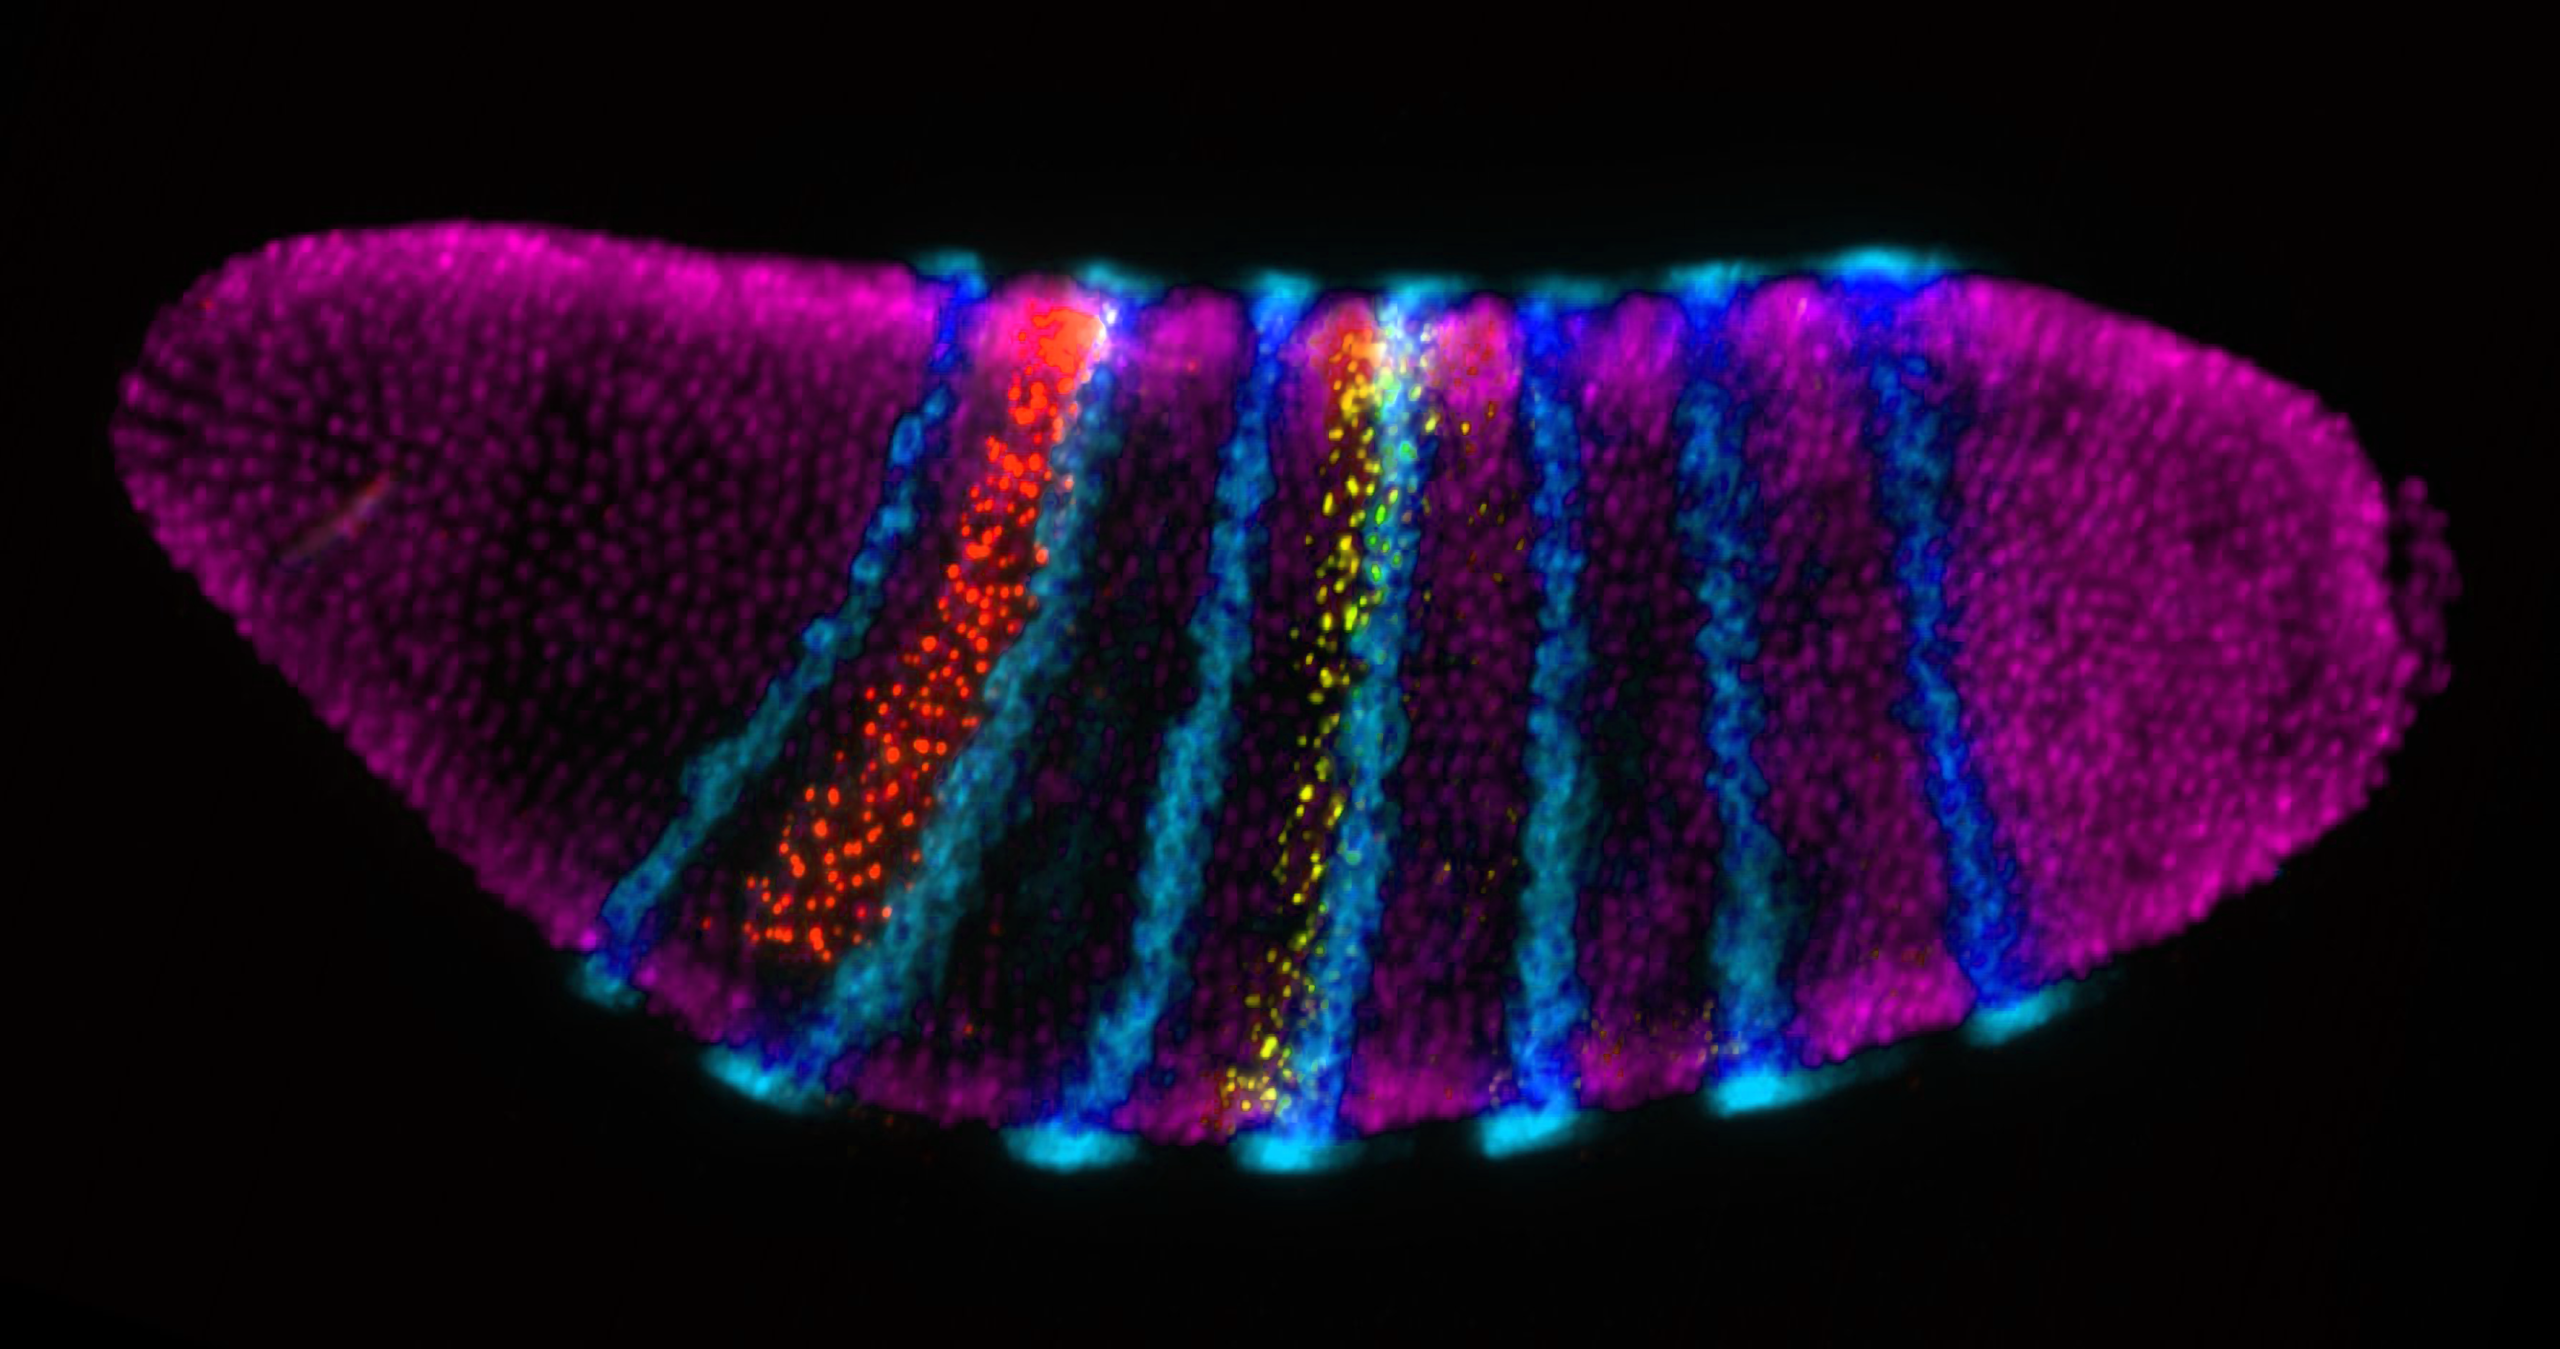
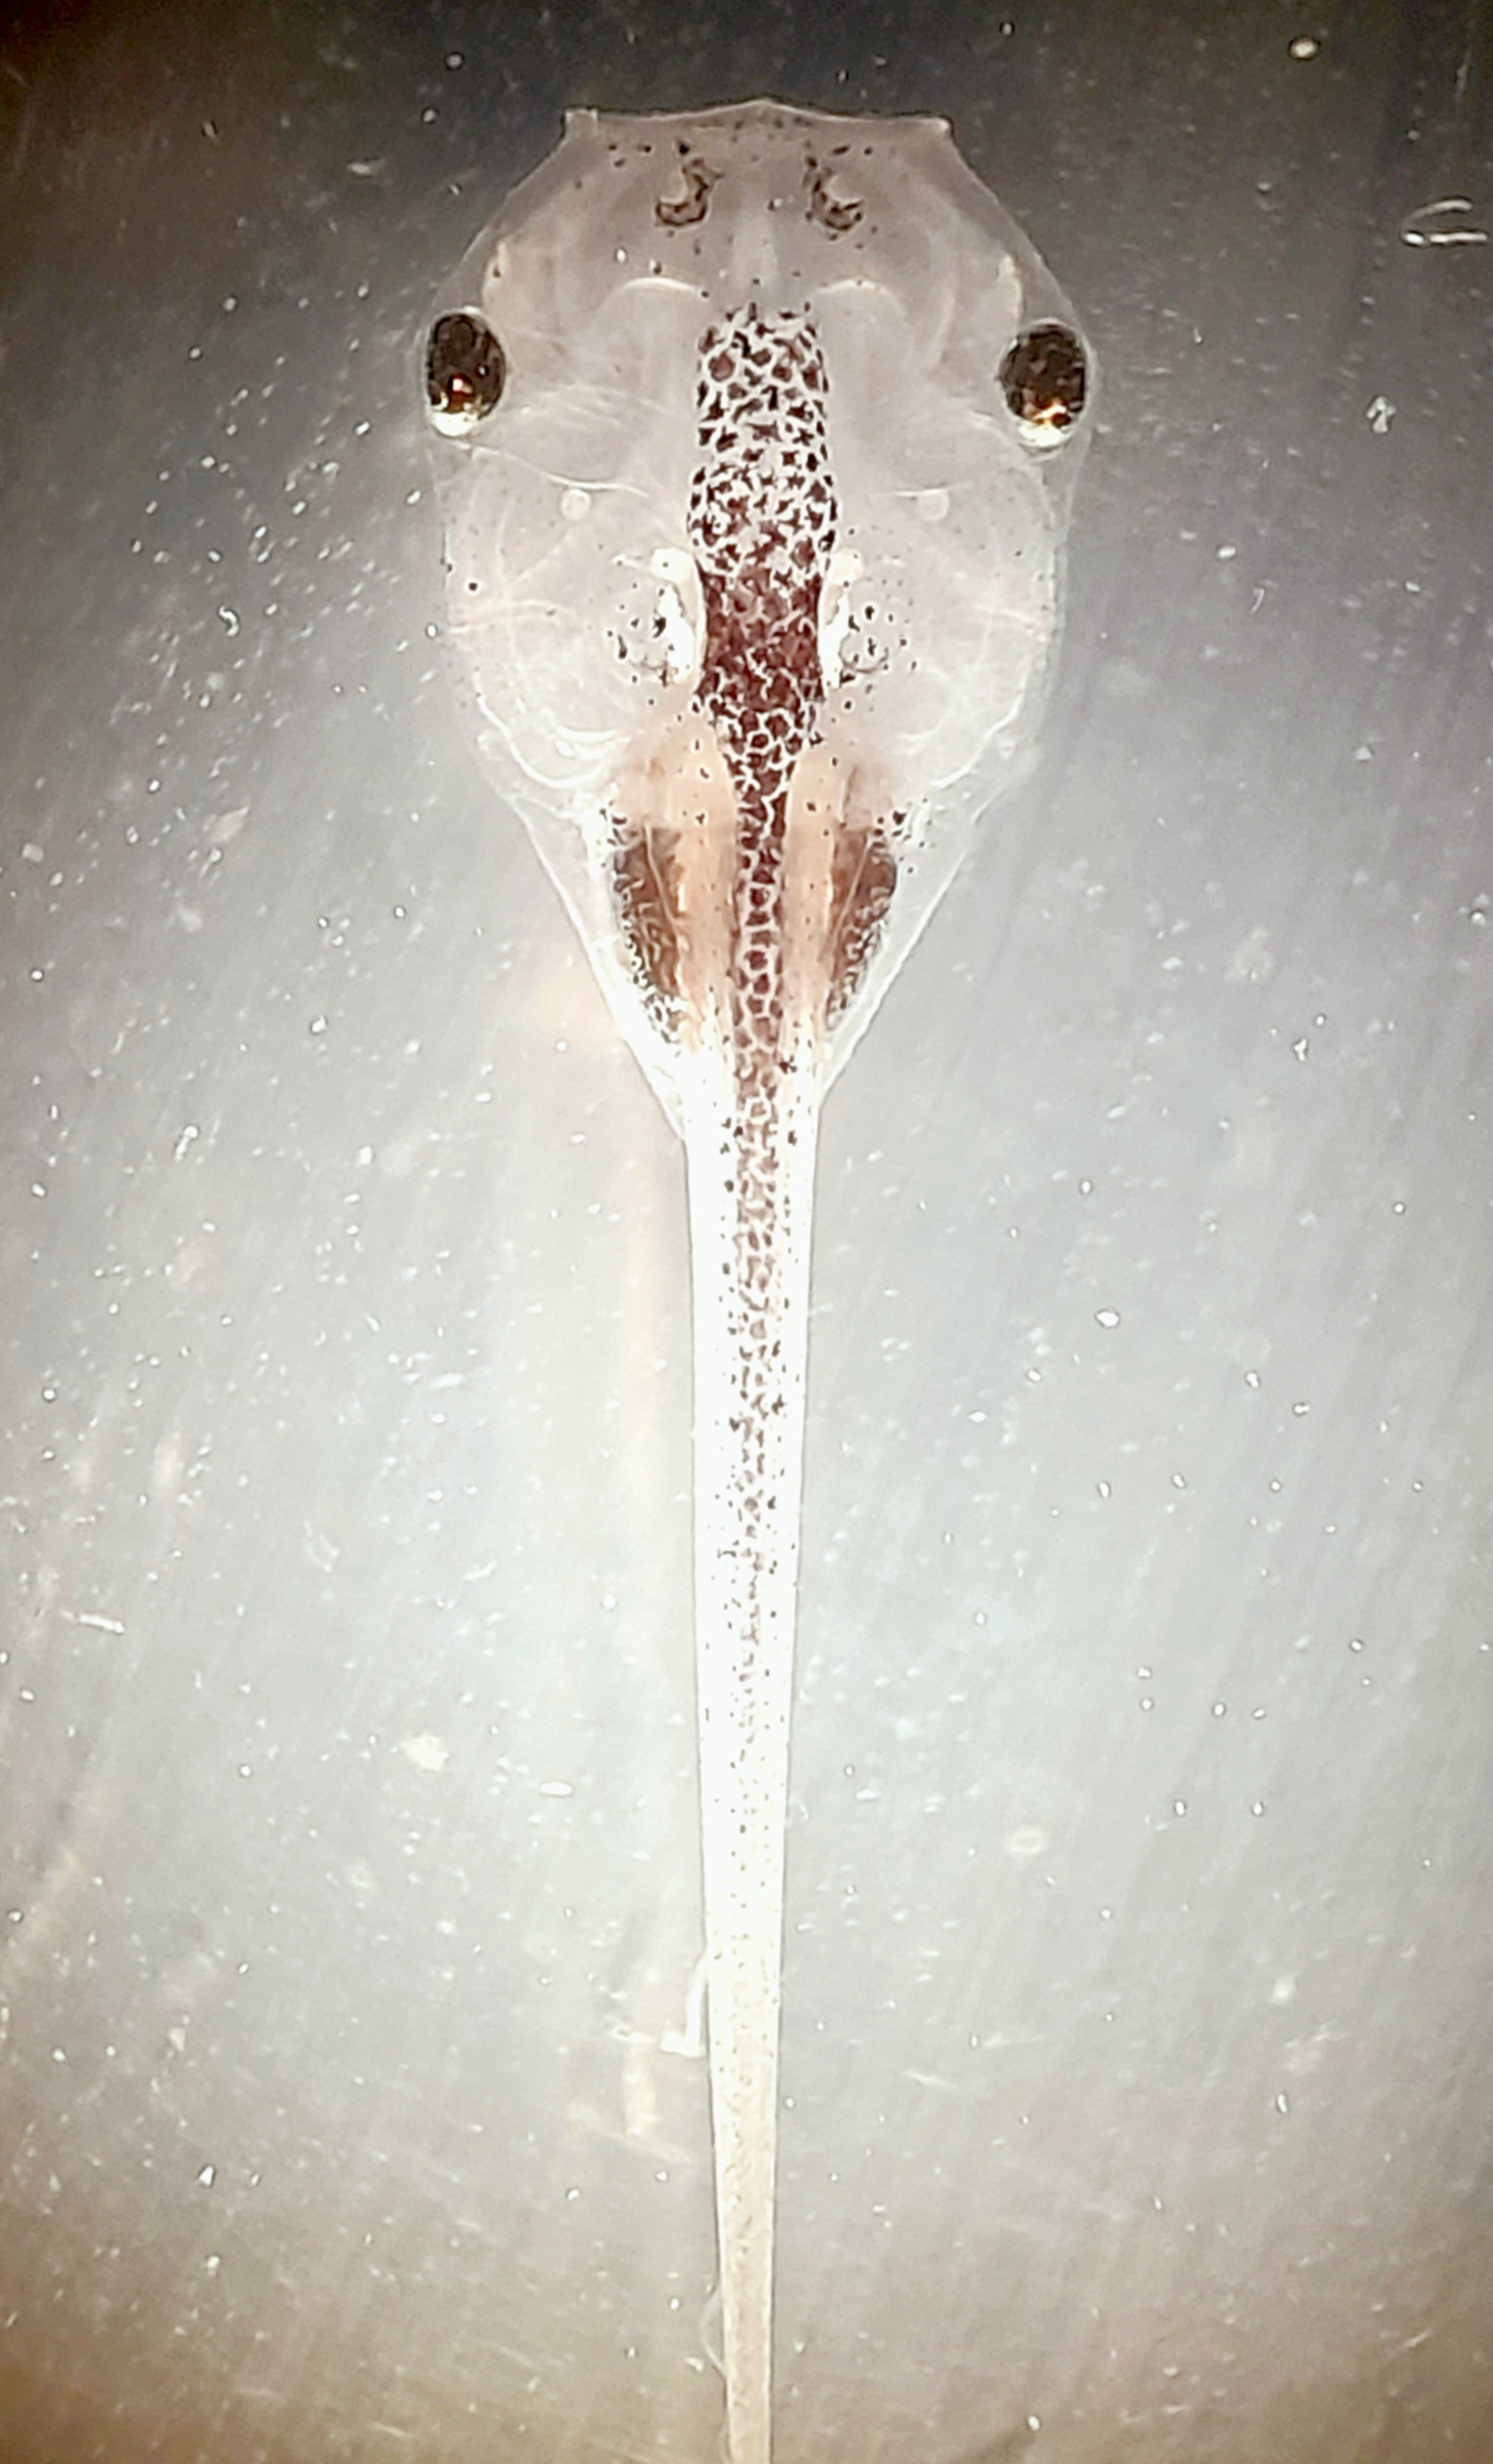
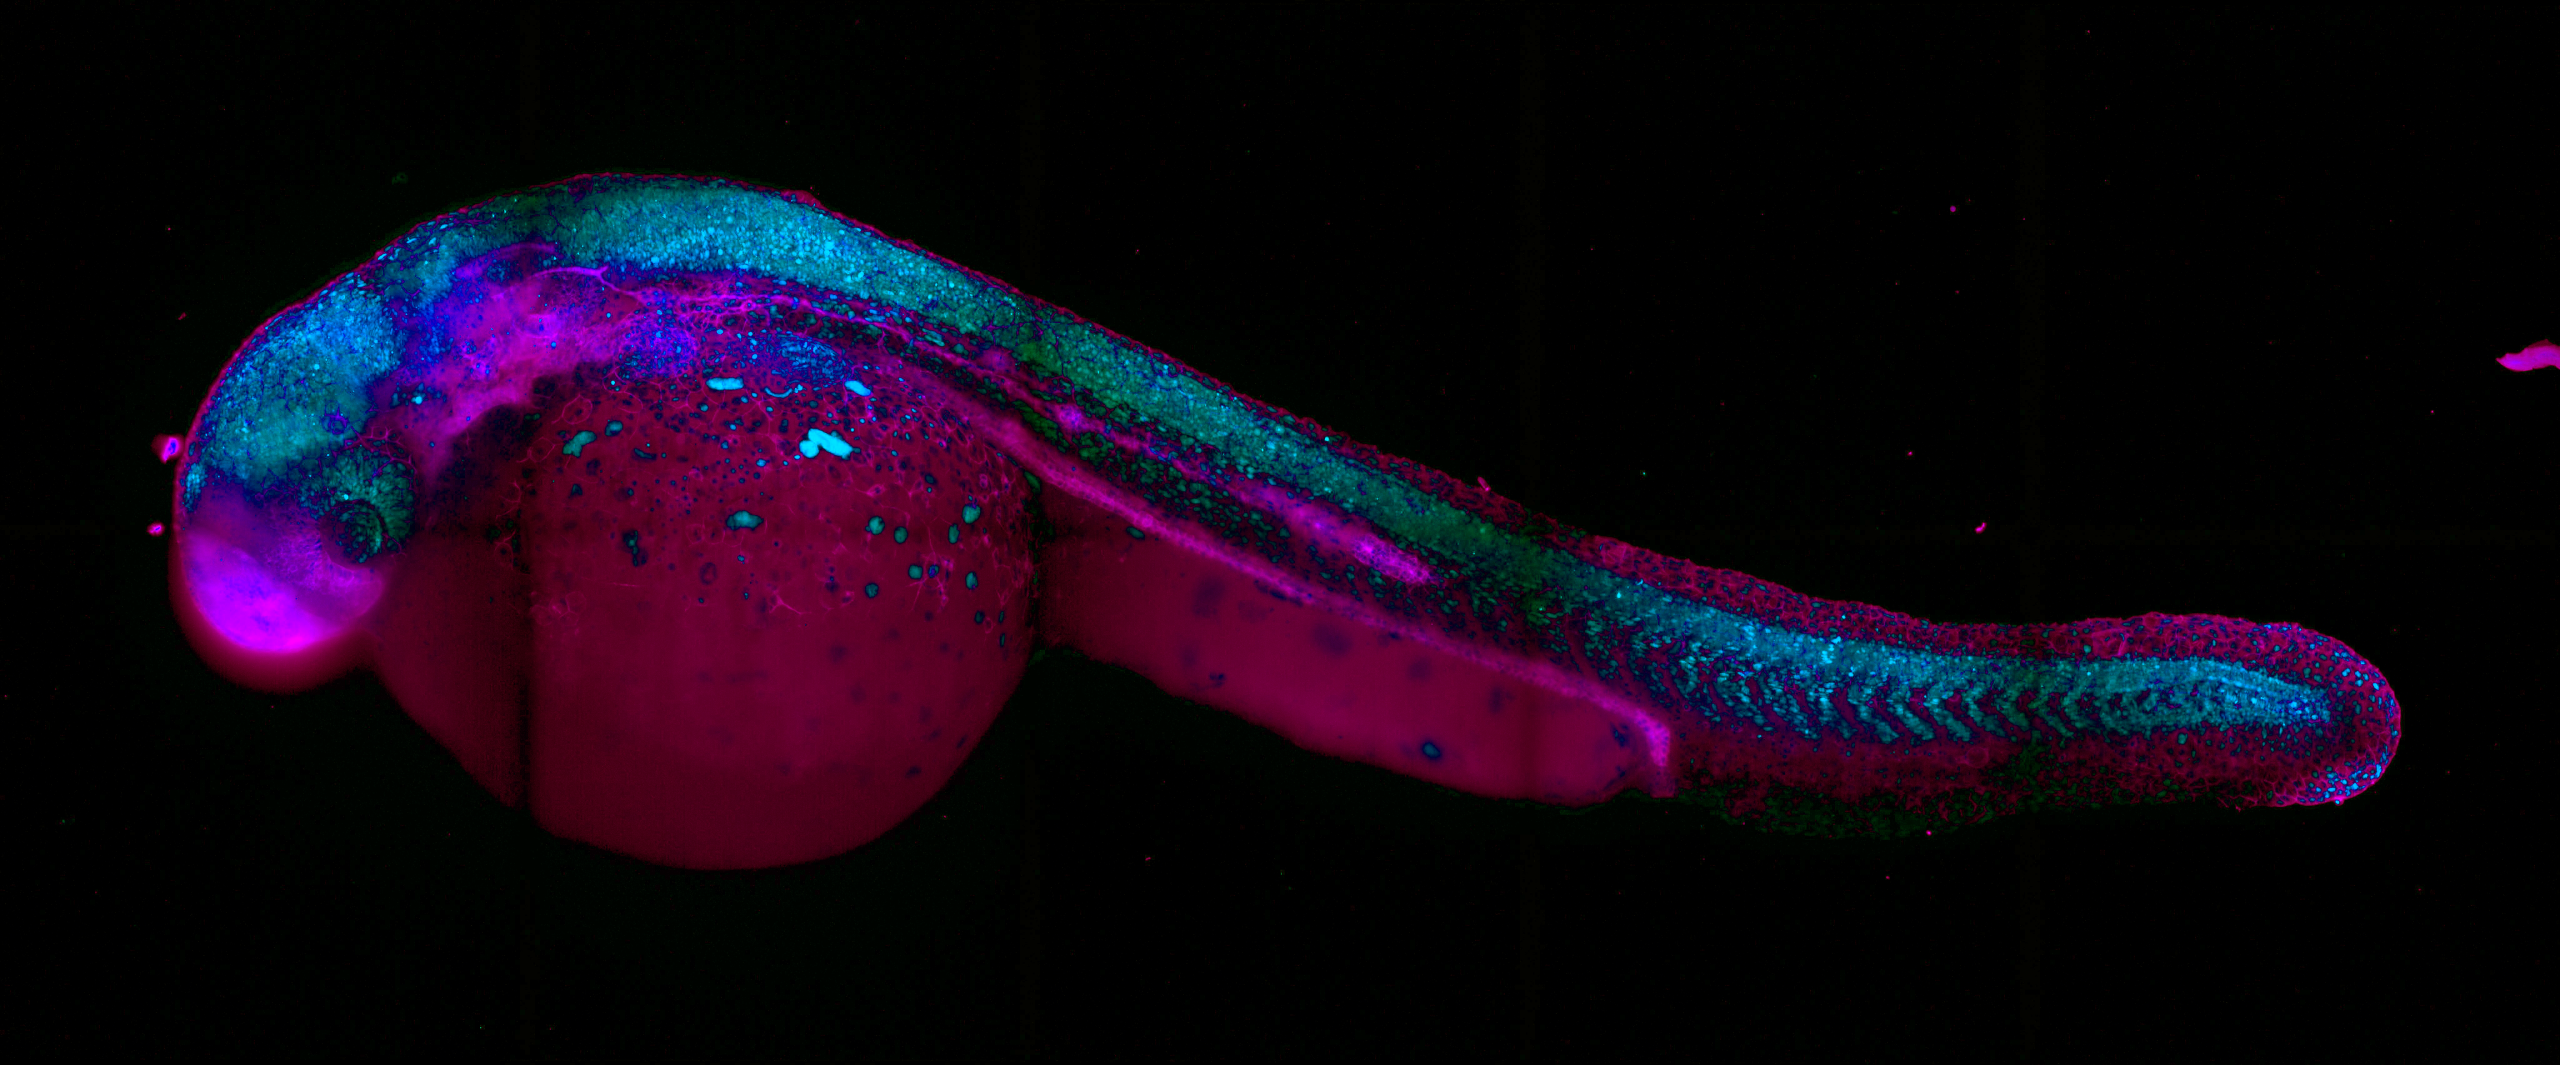
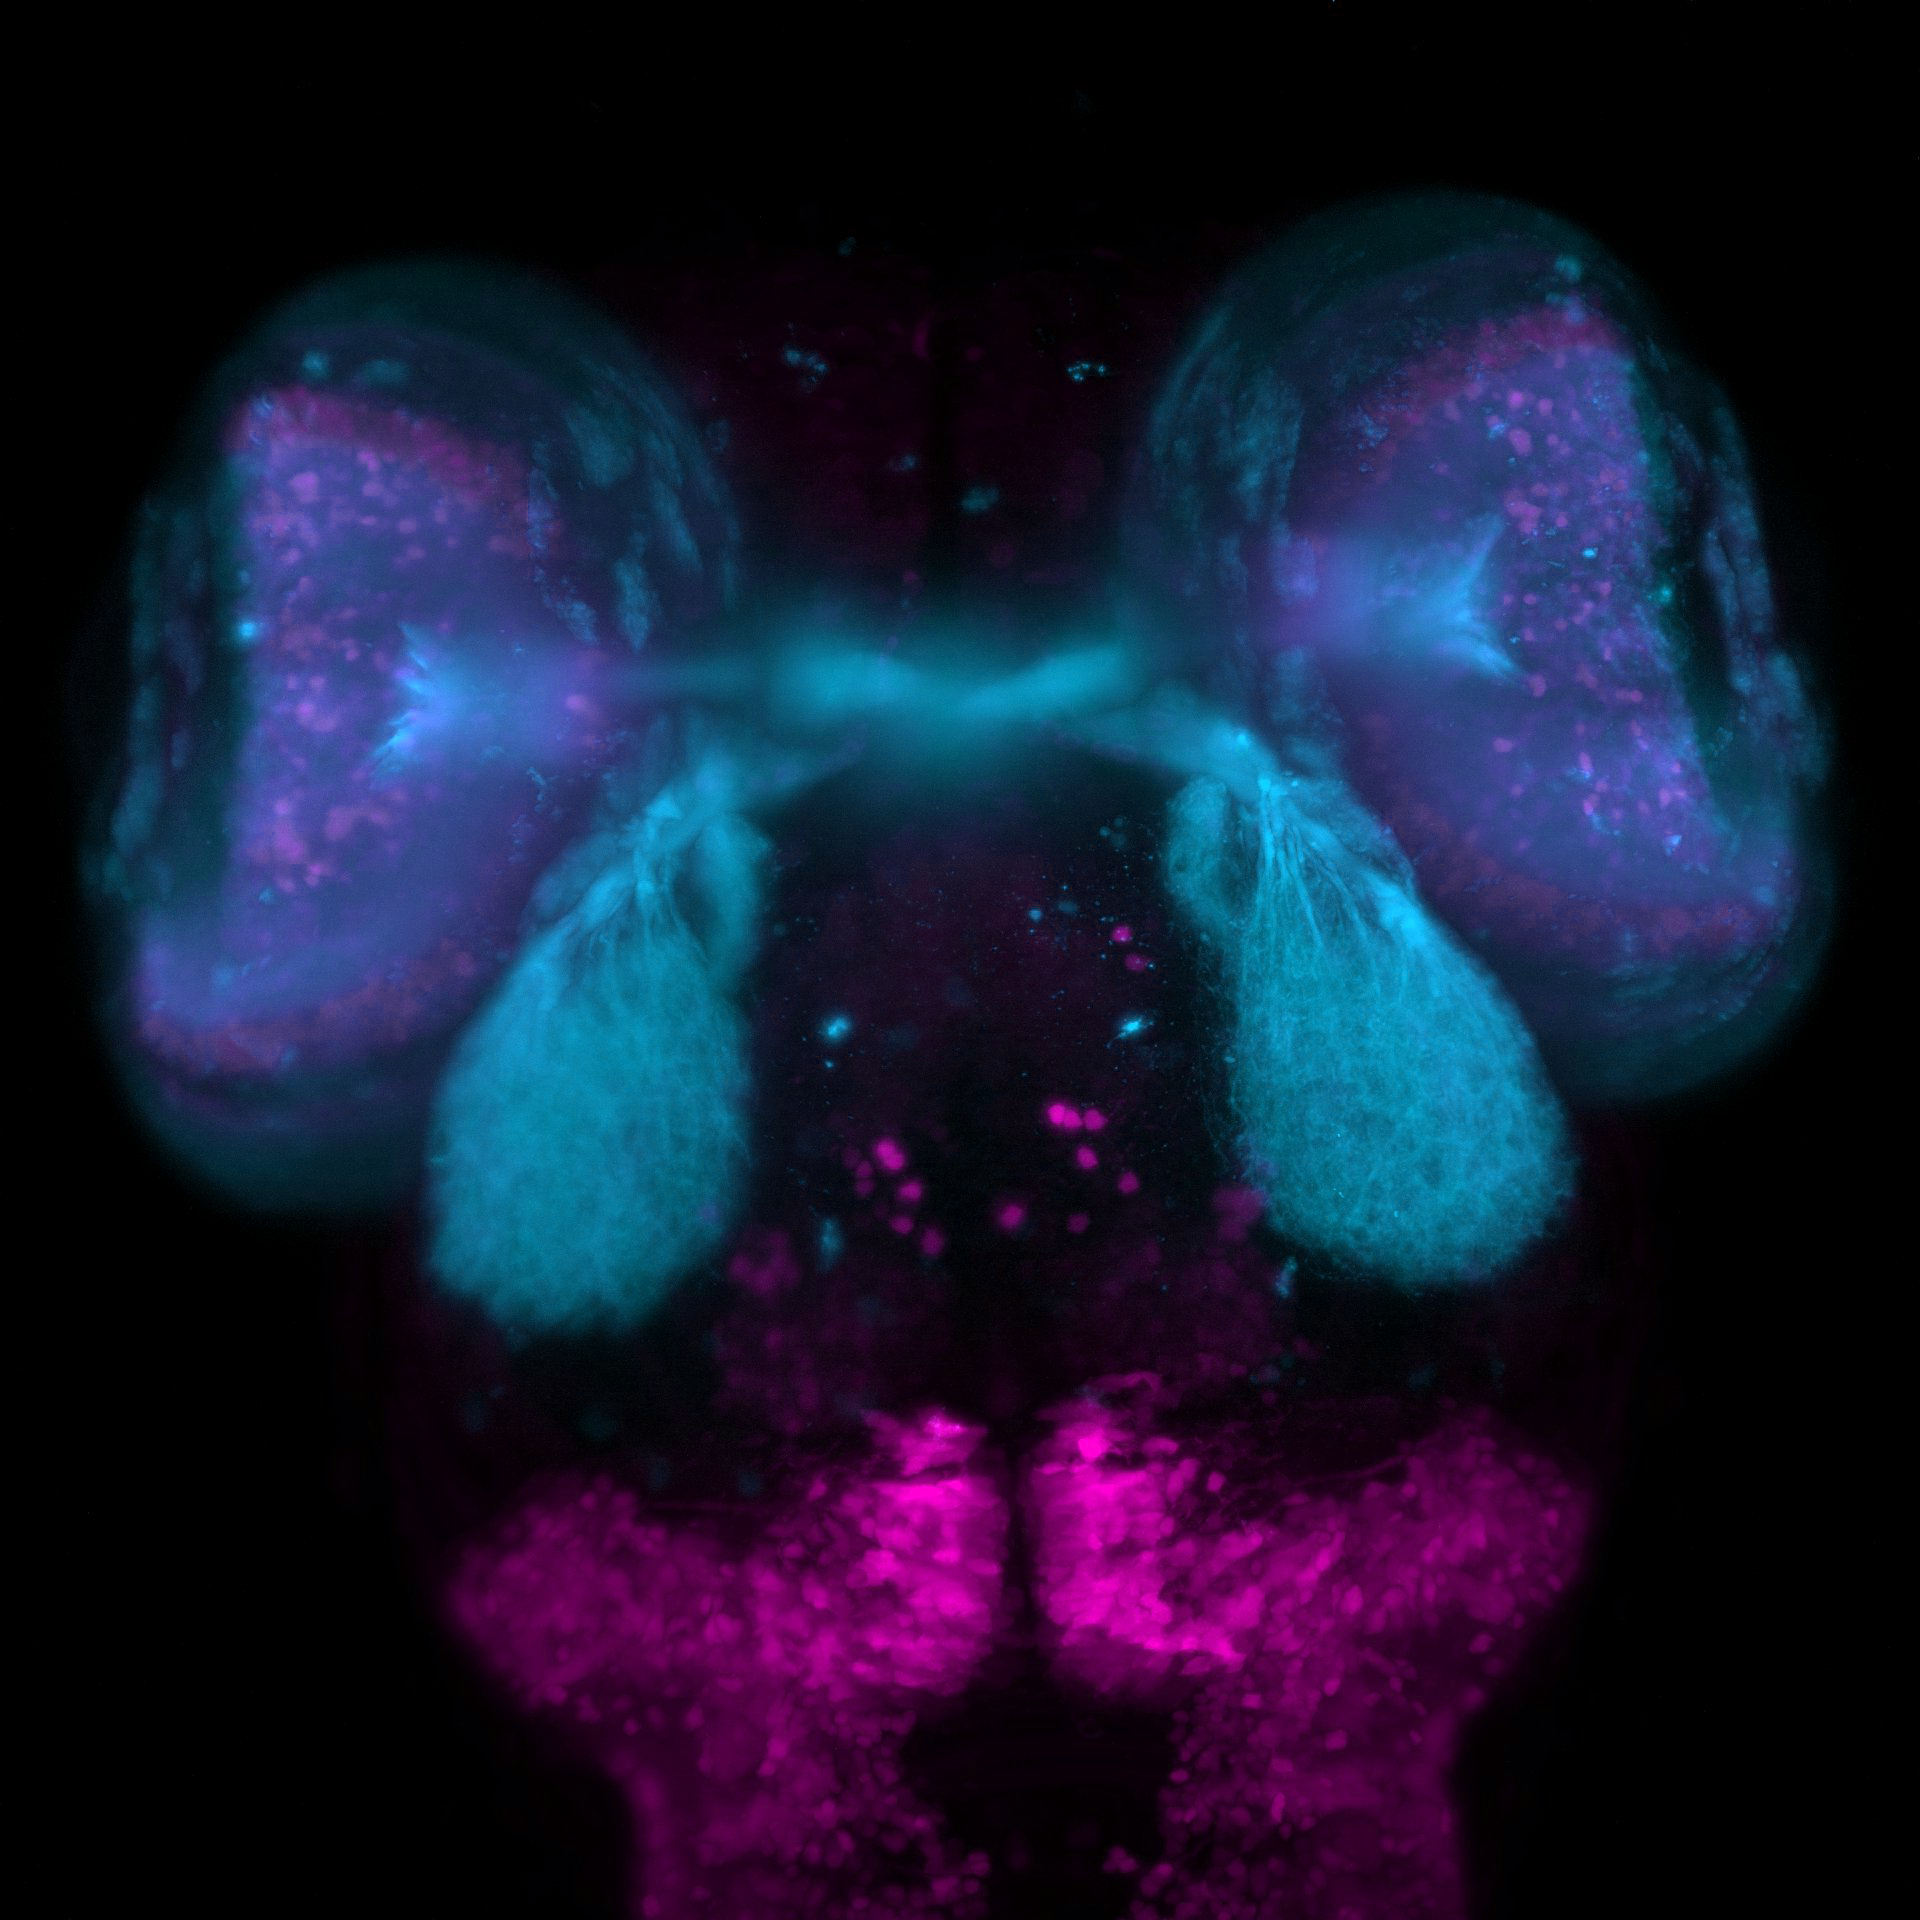
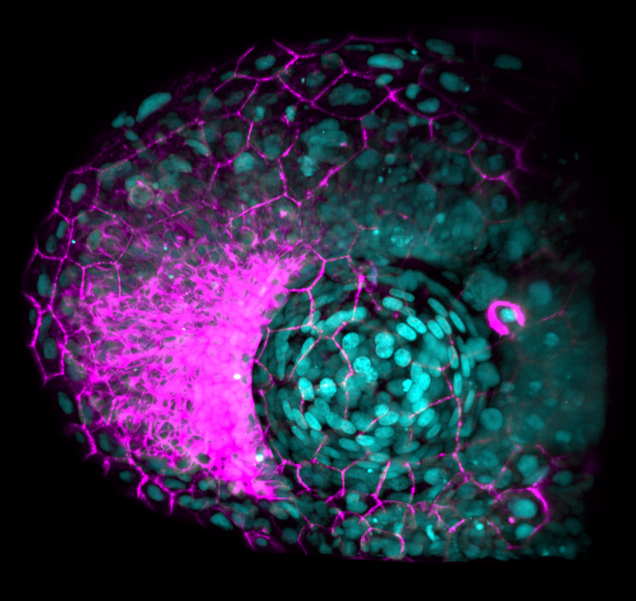
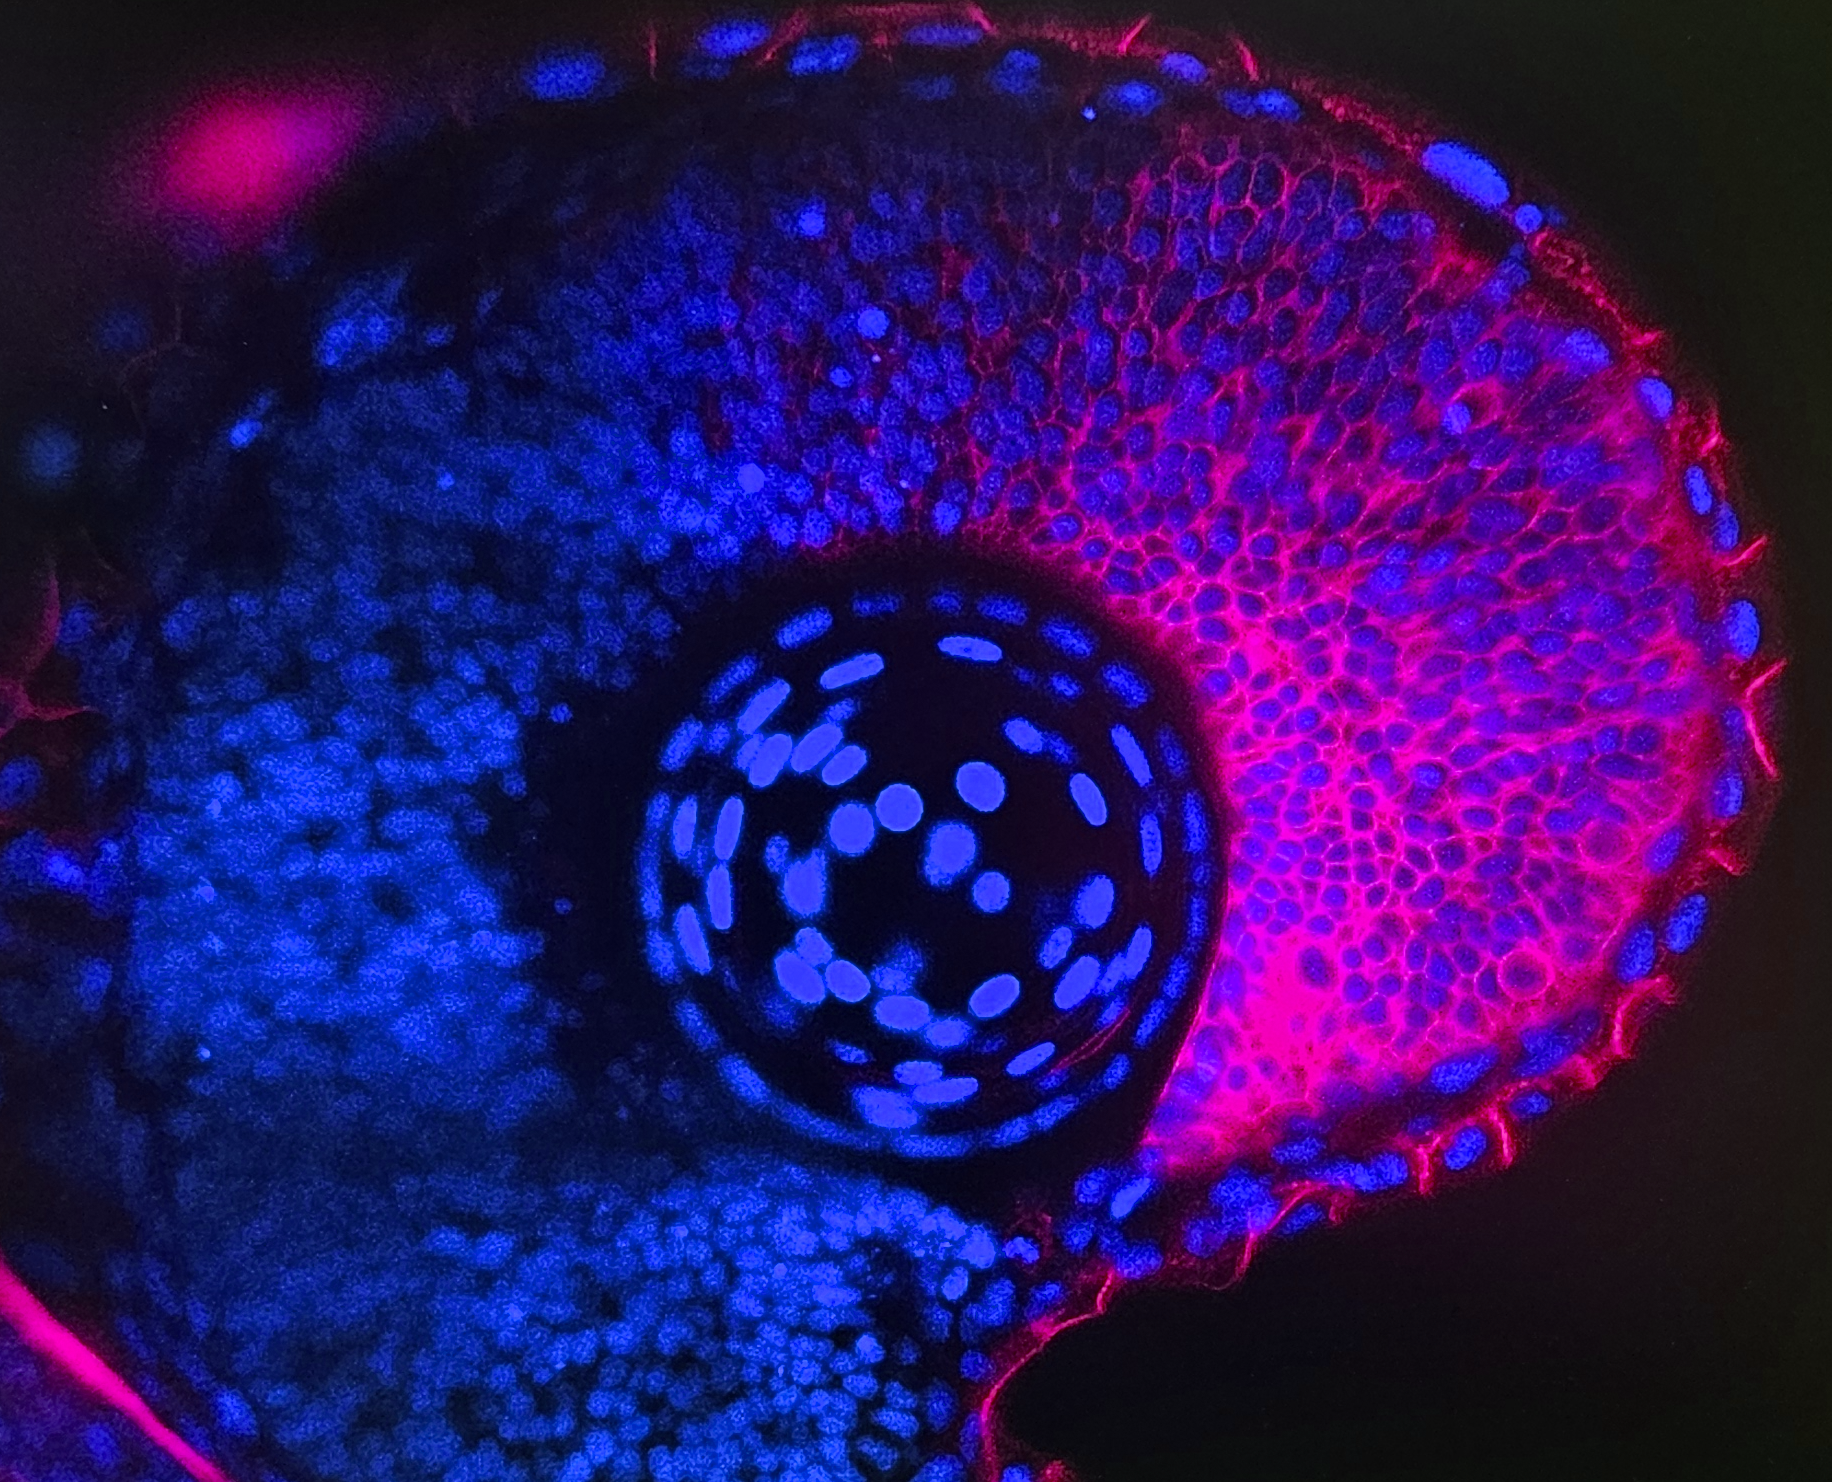
Browse through the gallery (click to view full image)
1. Amphipod. Amphipod collected in Quintay Bay by students of the 2025 course, and stained with phalloidin and DAPI.2. Chicken embryo. Live chicken embryo observed under a stereomicroscope.3. Late-stage Drosophila embryo. Confocal micrograph captures a late-stage Drosophila melanogaster embryo viewed from a ventrolateral or lateral perspective. It features triple-fluorescence labelling targeted at the developing musculoskeletal and nervous systems.4. Blastoderm-stage Drosophila embryo. Segmentation and homeotic (Hox) gene expressions in a blastoderm-stage Drosophila melanogaster embryo5. Tadpole Xenopus laevis. 6. Transgenic zebrafish embryo. Transgenic zebrafish embryo (Danio rerio), 24 to 48 hours post-fertilisation. Cyan: GFP; Magenta: DAPI7. Developing zebrafish brain. Micrograph of a developing zebrafish brain, showing cellular circuits and asymmetrical structures in cyan and magenta8. Zebrafish ocular structure. This image captures the developing ocular structure of a zebrafish embryo, visualised using high-resolution confocal/light-sheet fluorescence microscopy.9. Zebrafish embryo eye. Fluorescence microscopy image of a developing zebrafish embryo eye. Blue: DAPI, Magenta: retinal tissue
Our April webinar featured two of the papers named as finalists of Development’s 2025 Outstanding Paper Prize. Two of the papers were presented by Deputy Editor, Steve Wilson. Here, we share the talks from Xi Yang (Purdue University, USA) and Bénédicte Lefèvre (Institut Curie, France). Learn more about the finalists in our Editorial and read the full shortlist of nominated papers in Development’s subject collection.
In this SciArt profile, we meet Ramin Rahni, a developmental plant biologist from New York, USA, who recently moved to London, UK, to focus on his creative work. In his artwork, Ramin works across graphic design, motion graphics/animation, music, and video art, integrating precision and noise in ways both dramatic and understated.
Can you tell us about your background and what you work on now?
I’m trained as a developmental plant biologist and did my PhD and postdoc at New York University, USA. I’m also a multidisciplinary artist and have always had creative projects going alongside my research, working across graphic design, motion graphics/animation, music, and video art. I just relocated from New York to London to focus more fully on creative work.
02. “postcard_016” from my video art series, post-CAD
Were you always going to be a scientist? And what about art – have you always enjoyed it?
As a child, I really wanted to be an artist. To try to and encourage me to get more into science, my parents would get me these science coloring books on biology, astronomy, etc. Those books really informed my love of the synthesis of art and science. When I got interested in science again, towards the end of my undergraduate studies, it was really through a love of the figures and the aesthetics of science graphics. The creative problem-solving and hands-on nature of benchwork and experimental biology were also always really appealing and rewarding to me. But a PhD and a postdoc later, my favorite part of research is still the visuals.
03. Animated title sequence for Pondlife, a web miniseries collaboration between Sally Warring and the American Museum of Natural History
What or who are your most important artistic influences?
I’m equally drawn to precision and noise. On the one hand, I love the clean line art of technical drawings, manuals and other documentation, scientific and medical textbook diagrams, and architectural drawings. At the same time, I love experimental media of all kinds: works by people at the margins of their fields, outsider art, non-linear storytelling, purely textural and abstract pieces, horror B-movies, and high-concept works that don’t take themselves too seriously. Trying to integrate those extremes, in ways both dramatic and understated, motivates a lot of my creative work. For example, in a recent project for Pioneer Works Science Studios, I got to combine a 2D line-art animation style with more abstract textures I made using my video synthesizer.
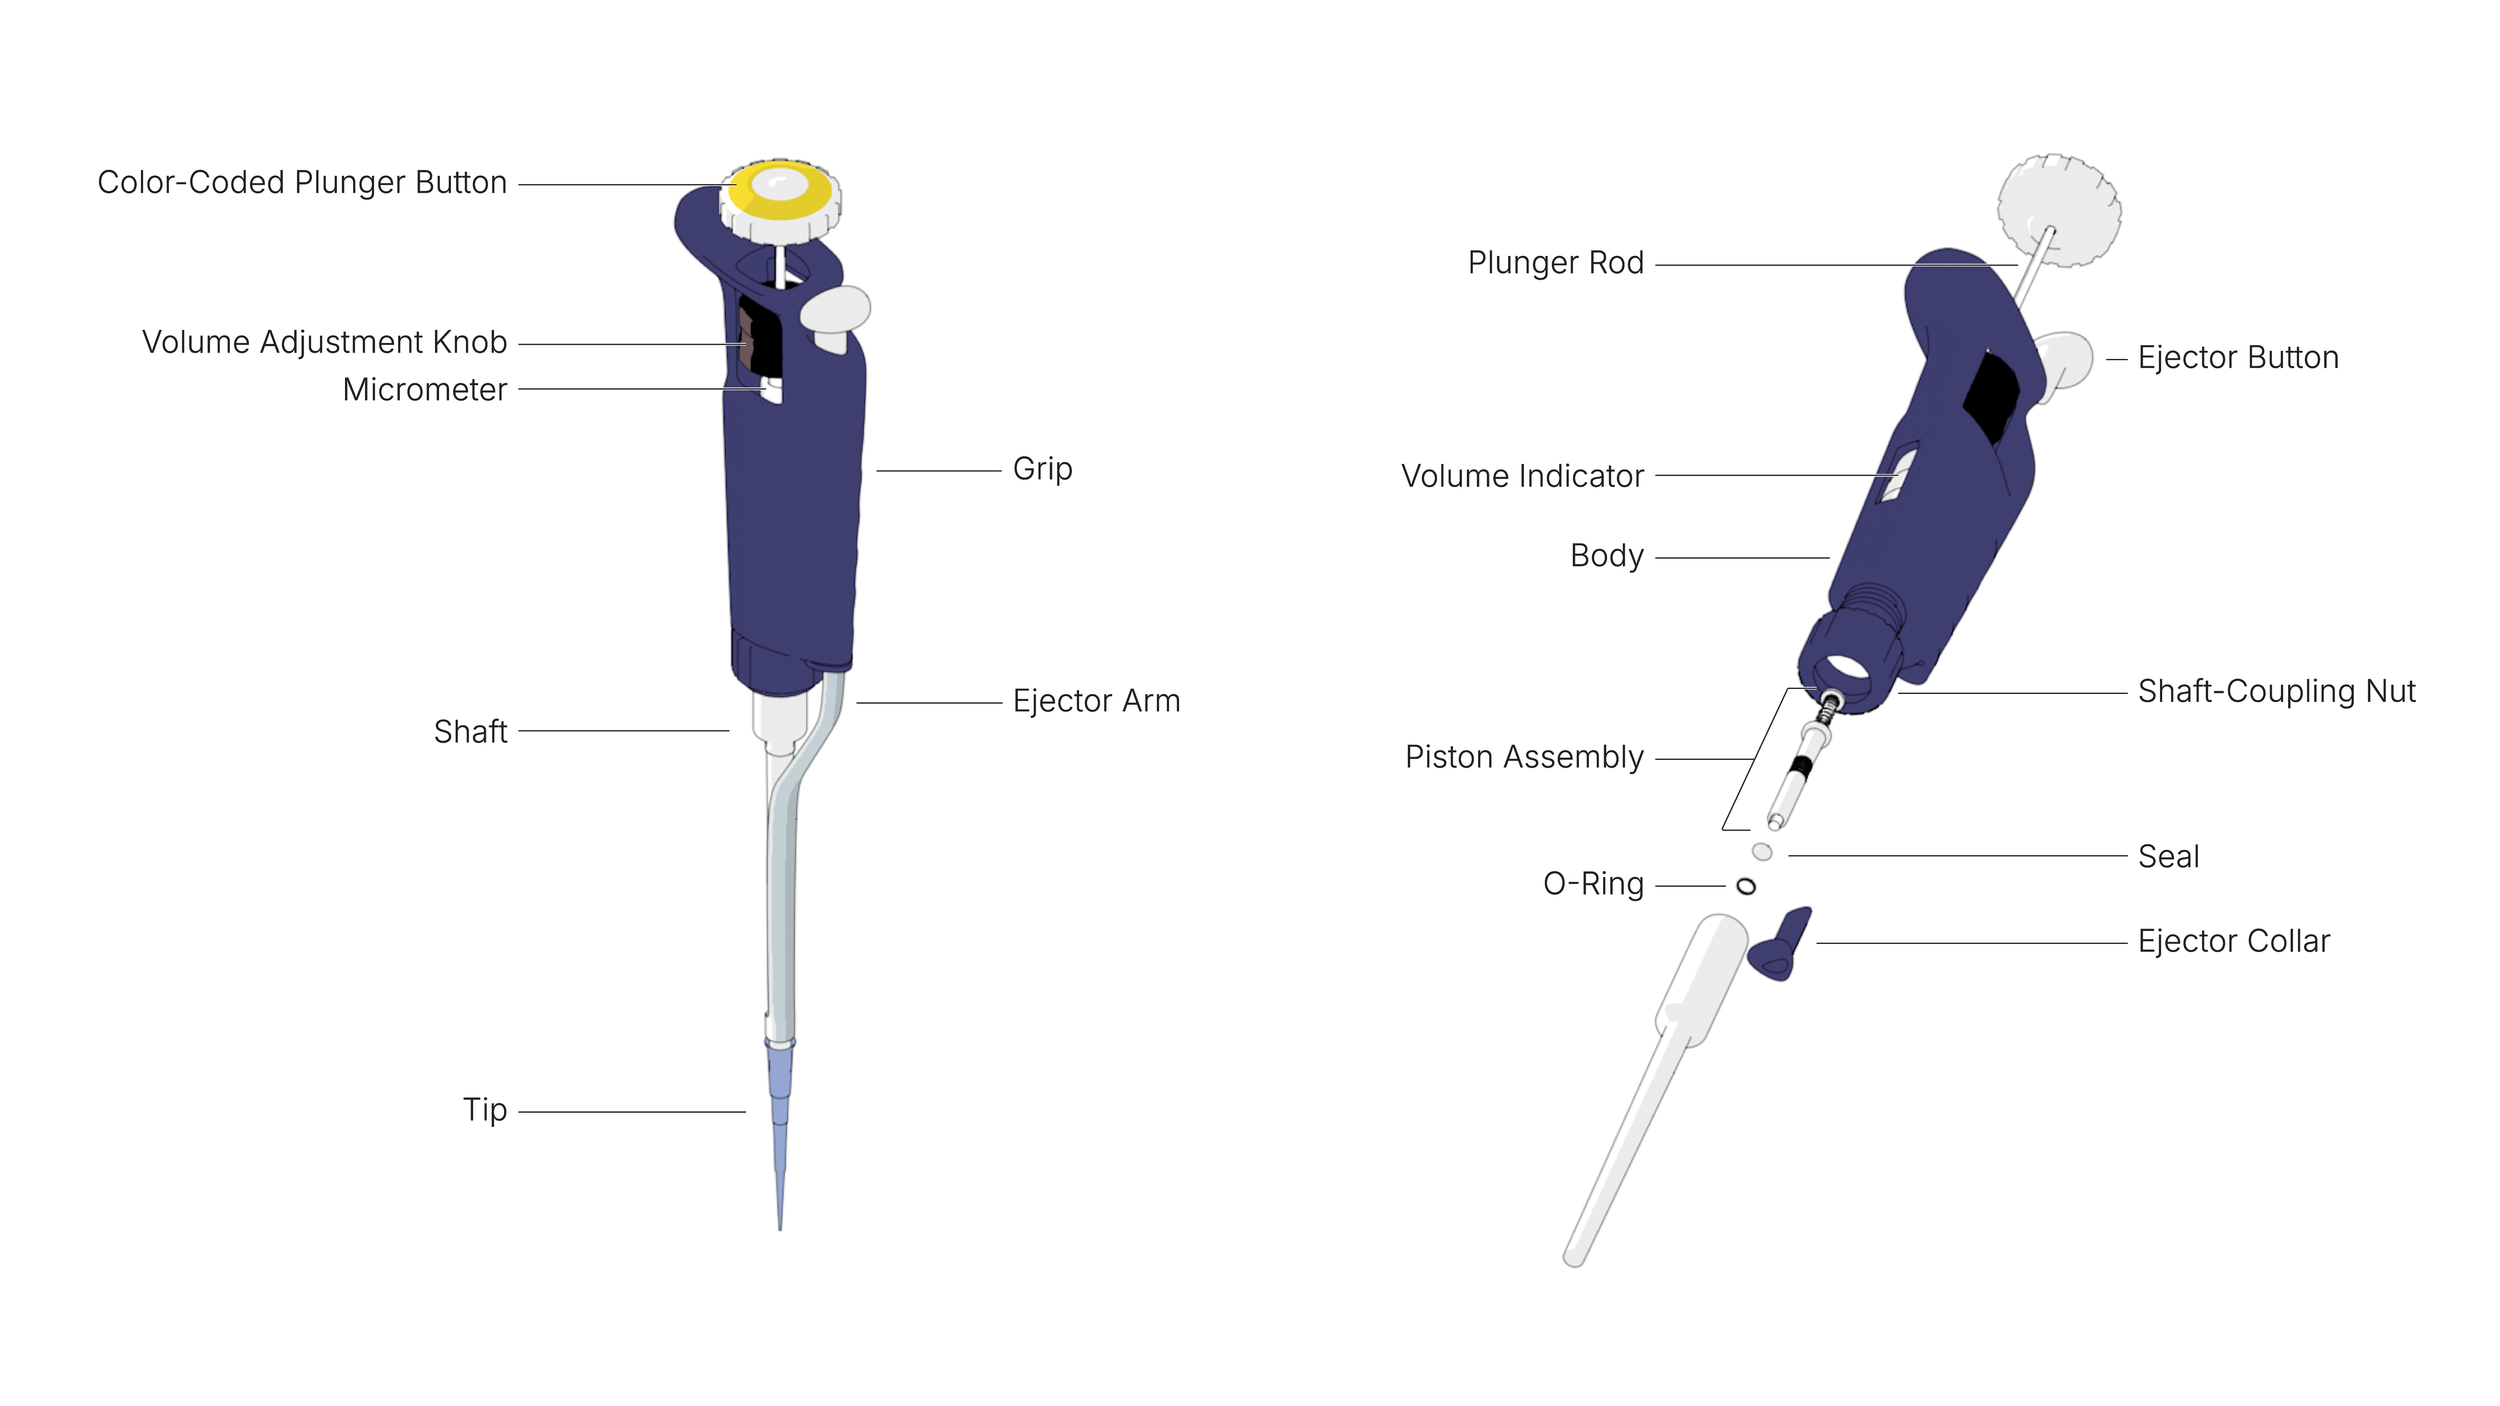
04. Annotated technical illustration of Gilson P200 pipette
I struggle with favorites, but here are a few works I’ve enjoyed recently: The Wax Child by Olga Ravn, the architecture of the Kyoto International Conference Center, the fresh-mint ice cream from Towpath in London (it tastes like actual mint!), and Good Morning Extra! by Water With Water.
For my graphic design projects, I primarily work in Figma, Illustrator, and InDesign. I use After Effects for motion graphics, 2D animation, and compositing. I also use 3D software for a lot of my static and animated work, but render everything using toon shaders to give it all a technical line-art feel. Lately, I’ve been experimenting with interactive animations using Rive and developing interactive biology learning materials. I make my video art using analog modular video synthesizers.
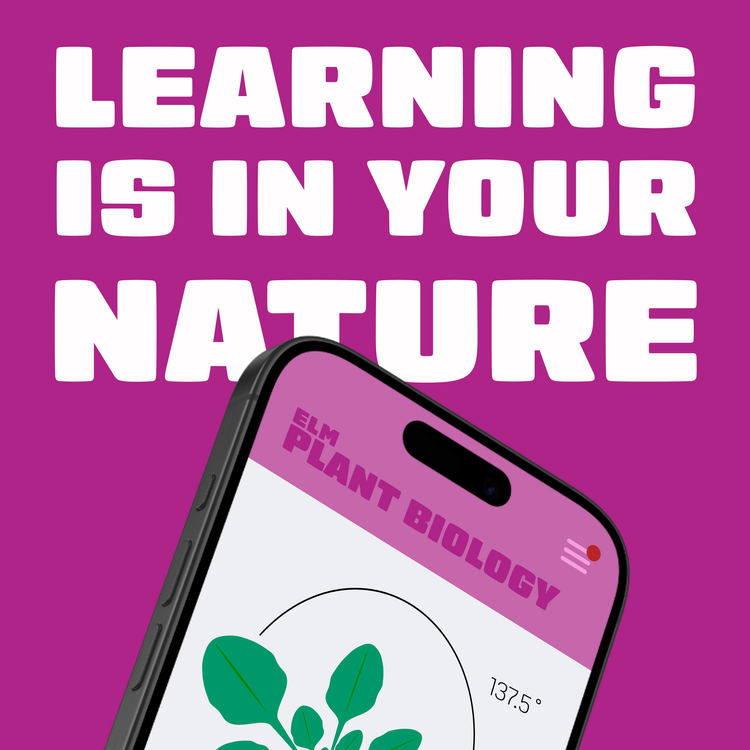
06. Brand application for ELM, an interactive life science learning app concept early in development
Does your science influence your art at all, or vice versa, or are they separate worlds?
They definitely mutually reinforce one another. The meticulous, organized, and cross-disciplinary nature of science lends itself well to the pixel-perfect and collaborative demands of graphic design. And being able to think in terms of systems, parts, and processes helps with the procedural nature of making art using analog video or other node-based workflows.
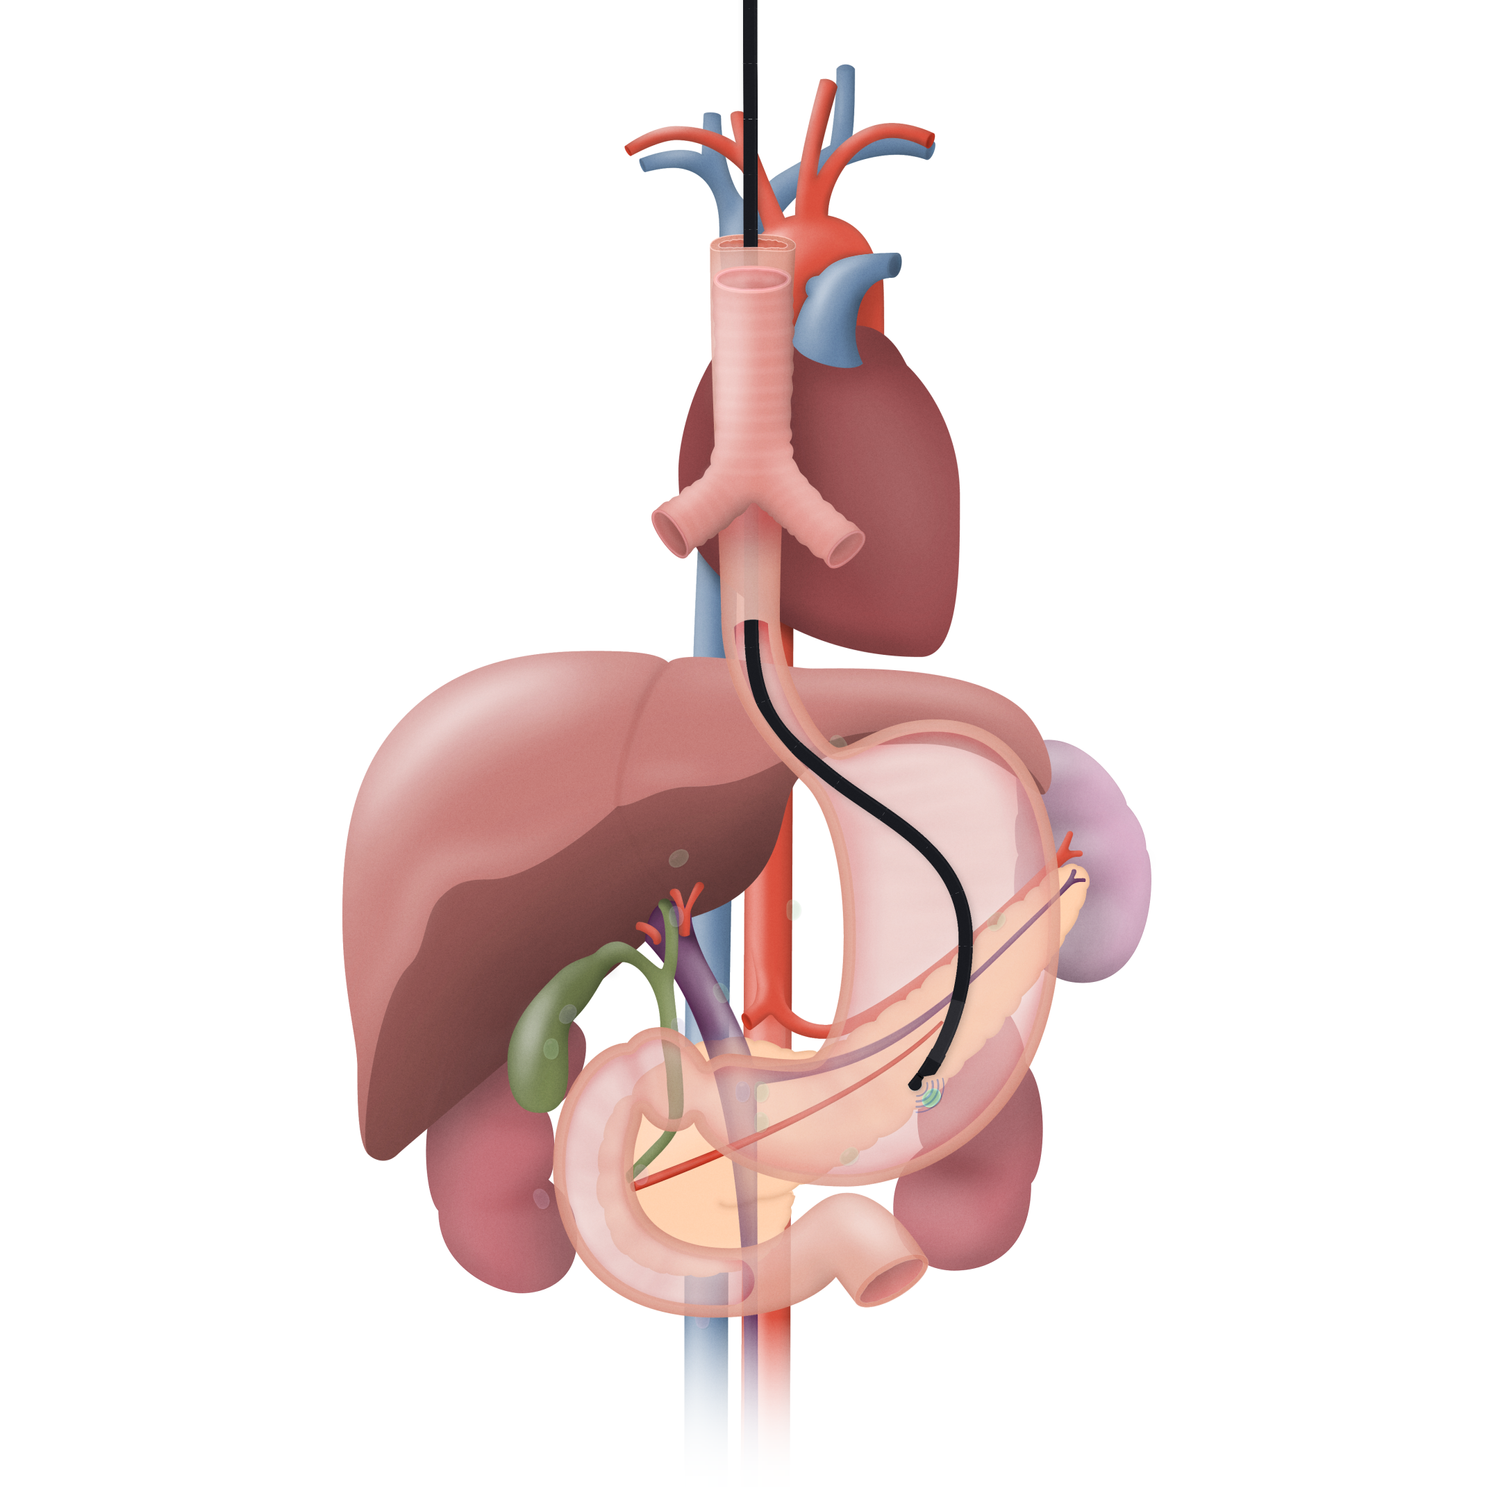
07. Still image from endoscopy animation for PENTAX Medical
What are you thinking of working on next?
On the personal side, I am working on an ongoing video art series called post-CAD that sits somewhere between postcards, graffiti, and thrift store re-paintings. Outside of my visual art practice, I play in the art rock duo Tar Of and the SWANA electronic duo Googoosh Dolls, and co-organize the annual technowruz series in NYC. We are about to mix a new Tar Of album so that’s next on my plate as well.
Professionally, I’m currently looking for opportunities where I can focus more fully on creative work informed by my science background, either in-house somewhere or within a studio or agency.
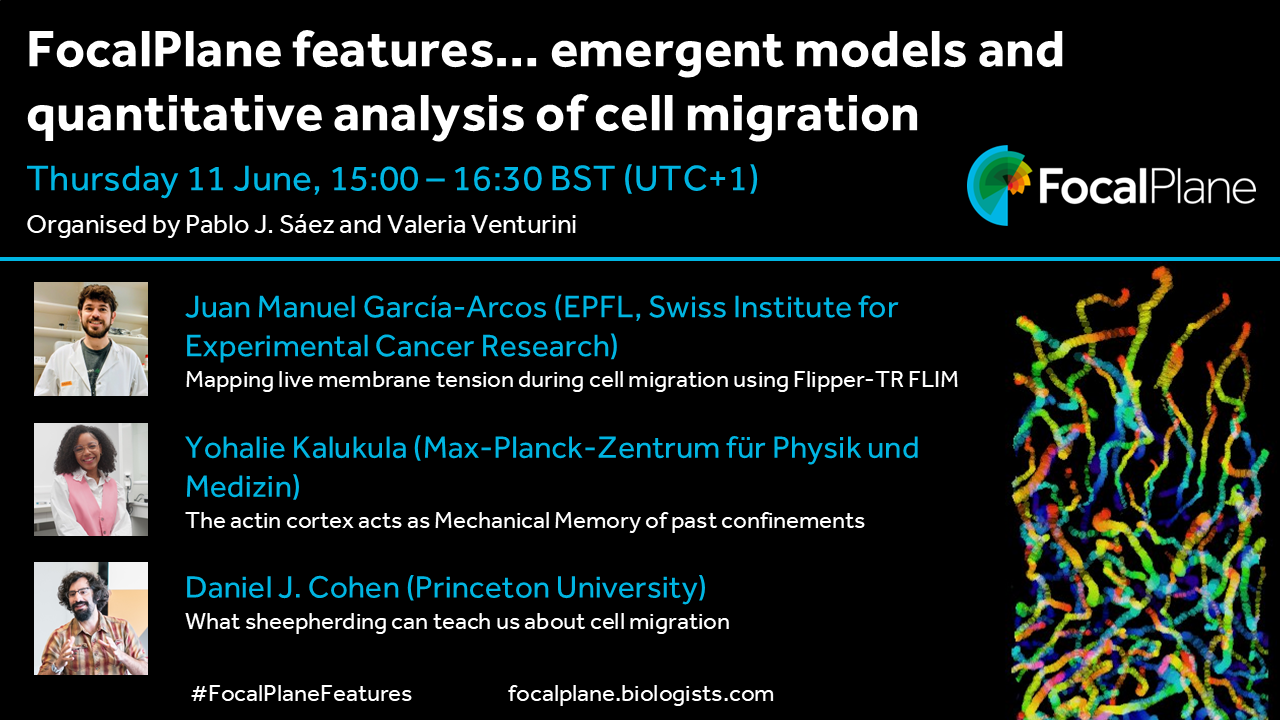
In this quarterly webinar series, hosted by Pablo J. Sáez and Valeria Venturini, we aim to showcase the latest research in the field, and we’d love to hear from researchers (especially early-career researchers) who would like to present their work. You can get in touch with us at focalplane@biologists.com or fill in our short application form.
Development, host of the Node, invites you to submit your latest research to our upcoming Special Issue – Plant and Algae Development. This issue will be coordinated by Academic Editor Dominique Bergmann (Stanford University, USA) and Guest Editor Susana Coelho (Max Planck Institute for Biology, Tübingen, Germany).
Developmental biology aims to understand how a single cell, the zygote, becomes a complex multicellular organism with specialised cell types organised into functional units. Derived from unicellular ancestors, algae, plants and animals use shared developmental principles, such as biophysical interactions, signalling, patterning and cell fate determination, to innovate and overcome obstacles for multicellular development, such as coordinating growth. The highly plastic development of photosynthetic organisms have long offered specific opportunities to answer questions regarding the origins of multicellularity, stem cell maintenance and regeneration, as well as environmental and microbial interactions and integration. In recent years, advances in genomics, imaging and synthetic biology are revealing how gene regulatory networks, mechanical biology and signalling interact to shape form and function in plants and algae. Furthermore, mathematical, computational and modelling approaches combined with traditional experimental biology have revealed, explained and predicted quantifiable properties behind phenotypes and across scales. We also see an exciting range of research organisms in use today, including species of algae, moss, ferns, flowering plants and others. In this special issue, we aim to showcase the contribution of plants and multicellular algae to our understanding of development, regeneration and evolution, highlighting quality research across the entire breadth of developmental biology.
The deadline for submitting research papers is 2 November 2026.
Note: it appears that some people are having issues with google forms, apologies if this has affected you. If you cannot use the form, please email your entry to us (see below for what is needed) and we will add it for you!
Looking forward to seeing all your images!
Many thanks,
Timothy
On behalf of YEN committee
Competition details:
Submit an original image you have generated related to developmental or stem biology. This may be a microscopy image, an image analysis output, or an artwork inspired by your scientific work.
Provide a title and a short description of the image, explaining the scientific context and techniques used (e.g. microscopy method or analysis strategy).
Provide your full name and affiliation. This information will be used for our internal records and future acknowledgement, but will not be displayed during voting.
You can view examples from the YEN 2025 Image Competition here.
Terms and Conditions
By sending us an image for the YEN Image Competition, you agree to the YEN Committee displaying the image publicly (including on our website and social media) and using it on YEN materials to promote future events. We will always credit you unless you request otherwise.
All submissions will undergo an initial review by the YEN Committee based on quality and visual impact. Applicants will be notified of the outcome of this selection through the email address provided in this form.
I was fortunate to receive an EMBRC-supported grant to carry out a small project on calcium imaging in sea urchin larvae at the Institut de la Mer de Villefranche (IMEV).
What makes IMEV special is not only its location on the French Riviera, but also the scientific history embedded in the place itself. Since the late 19th century, researchers have come to Villefranche-sur-Mer to study marine embryos, fertilization, plankton, and development; taking advantage of the bay’s extraordinary biodiversity and direct access to living marine organisms. In many ways, modern marine developmental biology was shaped in places like this.
And you still feel that spirit today.
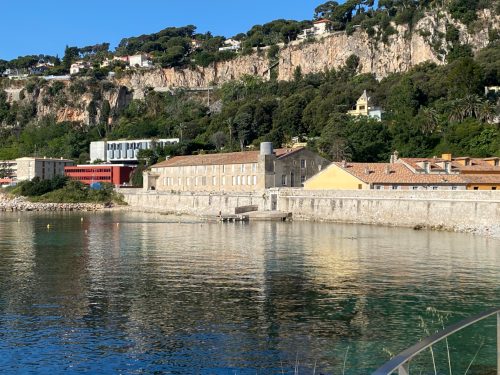
Although IMEV is relatively small, it is well equipped and highly efficient for experimental work (Fig. 1).
Fig. 1. Institut de la Mer de Villefranche (IMEV), Villefranche-sur-Mer, France.
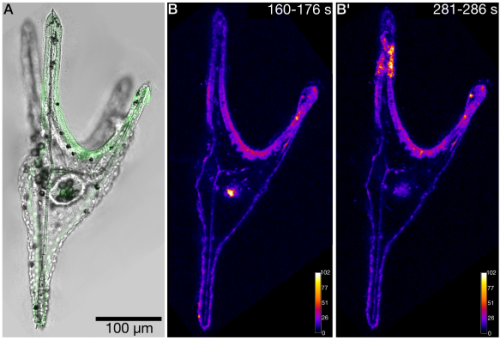
Access to marine organisms, imaging platforms, and technical support made it possible to rapidly test several GCaMP variants and explore live imaging approaches in sea urchin larvae (Fig. 2).
Fig. 2. Calcium imaging in the sea urchin larva Paracentrotus lividus expressing GCaMP6s. A. Brightfield image overlaid with GCaMP6s fluorescence signal (green). B – B’. MAX projections from selected time windows of an XYT recording, showing representative spontaneous calcium activity patterns. Fluorescence intensity is displayed using the Fire (LUT).
A key part of what made this project so productive was being hosted by Luis Bezares Calderon.
I had never met Luis before this visit. I knew his work on neuronal and behavioral mechanisms in Platynereis, so during the proposal stage I sent him a simple email asking whether he would consider hosting me at IMEV. He generously agreed.
From the beginning, he gave me full access to his lab resources and created a highly collaborative environment. But what shaped the experience most was not only the experimental support, it was the way he constantly challenged the thinking behind the experiments.
His questions were persistent and fundamental: Why this approach? How will it answer your question? Are you just going to look at traces forever, or understand their function?
Coming from a molecular biology background, I was used to thinking mainly in terms of genes, molecules, and cellular mechanisms. Working with Luis pushed me to think more directly about nervous system function and behavior. For the first time in my life as a researcher, I witnessed behavioral assays in sea urchin larvae with my own eyes while simultaneously trying to connect activity dynamics to biological function.
This connection between molecules, cells, neural activity, and behavior is something Luis actively builds into his science. I found that intellectually challenging, stimulating, and genuinely exciting.
This experience reminded me that marine stations are not just places to run experiments. They are environments where questions can evolve quickly because of access, collaboration, and the intensity of scientific interaction.
I am very grateful to everyone at IMEV, and especially to Luis, for making this possible.
“Why do some hearts regenerate, while others do not?”
This question has followed me for more than a decade. Not as a single project, but as a thread that kept resurfacing—each time forcing us to rethink what we thought we understood.
The idea of comparing regenerative zebrafish with non-regenerative medaka started as one of several proposals I discussed with Didier Stainier when I joined his lab in 2014. At the time, it felt simple: let biology provide the contrast, instead of trying to extract answers from a single system.
Zebrafish regenerate their hearts. Medaka do not. That difference was too striking to ignore (1).
I was in my second postdoc then, aware that I needed something I could carry forward. Didier encouraged me to pursue it, even though it was clearly high-risk. Looking back, that decision shaped everything that followed.
Didier visited IBMS at Academia Sinica in Taiwan in 2019 for an Institutional Lecture—a full-circle moment early in the journey.
When the data pointed to something unexpected
Together with Rubén Marín-Juez —who later became both a key collaborator and a close friend—we established a cryoinjury model in medaka and generated our first comparative RNA-seq datasets (2).
What we saw was not what we expected.
Instead of cardiomyocyte-centered differences, which at the time were widely viewed as the primary drivers of cardiac regeneration, the strongest signals pointed toward immune responses and angiogenesis (2). I remember hesitating. It felt like we were drifting away from what many would consider the “core” of cardiac regeneration.
But the data were clear, and we decided to follow it.
We used to joke that we were like the Maze Runners—moving forward without knowing what was coming next, or how things would end. Rubén focused on angiogenesis and uncovered how revascularization is an early and essential step in regeneration (3, 4). In parallel, I moved toward immunity—despite being warned, quite accurately, that “immunity is too complicated and messy to work with.”
In hindsight, that hesitation reflects something broader. Work in non-mammalian models is often judged by how directly it translates to human biology, rather than by the clarity of the biological principles it can reveal. Yet it is precisely these systems—and the people willing to pursue them—that allow us to uncover mechanisms that are otherwise difficult to see.
Rubén and I returned to Bad Nauheim, Germany, in 2025 for the 30th anniversary of the Stainier lab—revisiting the place where this journey first began.
A result we thought we understood—but didn’t
What stood out early was that macrophage infiltration appeared delayed and reduced in medaka (2). So, we asked a simple question: what happens if we delay macrophage recruitment in zebrafish?
Using clodrosome, we transiently depleted macrophages prior to injury and observed impaired regeneration.
At the time, we interpreted this primarily as a timing effect—an early delay that irreversibly disrupts regeneration.
This seemed to fit the data. Macrophages eventually came back, and their numbers recovered within about a week. Yet the heart still failed to regenerate.
Through temporal single-cell profiling—driven in large part by the careful and persistent work of Ke-Hsuan Wei, one of the first PhD students in my lab—we realized something we had completely missed before: clodrosome was not simply delaying macrophages—it was preferentially depleting the resident macrophage population (5).
These cardiac resident-like macrophage subsets turned out to be essential for heart regeneration—coordinating revascularization, cardiomyocyte survival, debris clearance, and extracellular matrix remodeling.
That realization reframed everything.
Even when we allowed extended recovery, giving circulating, monocyte-derived macrophages ample time to repopulate the heart, regeneration did not recover.
At that moment, the entire story finally made sense.
It was not only about timing. It was also about identity.
What initially appeared to be a delay in macrophage function was, in fact, the loss of a specific and irreplaceable cell population.
Turning a non-regenerative system on
We then asked the opposite question: instead of suppressing the immune response, could activating it change the outcome?
Poly I:C—identified through comparative transcriptomics—enhanced macrophage recruitment and, unexpectedly, enabled de novo regeneration in medaka (2).
That was one of those moments when you don’t immediately trust the data. We repeated the experiments, trying to convince ourselves it wasn’t an artifact.
But it held.
Regenerative capacity began to look less like a fixed property and more like something that could be modulated.
From immune identity to regenerative signal
Our recent paper in PNAS represents the latest step in this progression (6).
Led by Kaushik Chowdhury, this phase of the work brought together comparative analysis, single-cell profiling, and functional experiments to identify a regeneration-associated macrophage population induced by poly I:C.
These macrophages localize to the injury border zone and express Granulin.
What started as a candidate marker became a functional insight. Through a series of carefully executed experiments, the team showed that recombinant Granulin alone is sufficient to promote cardiomyocyte proliferation and reduce scarring—linking immune activation to a concrete regenerative outcome.
Closing the loop, granulin expression is also activated in zebrafish following cardiac injury and is essential for heart regeneration.
Basic science, unexpected translation
I always consider myself a basic scientist and a developmental biologist. None of this work started with a translational goal.
It was driven by curiosity—by a question that seemed fundamental, but not immediately “useful” or “applicable”.
And yet, it led us to a concept that is inherently translational: that regeneration might be induced through immune modulation.
As Didier once put it:
“One never really knows when a basic science finding will transform translational research… CRISPR/Cas9 is just one recent example.”(7)
That perspective has stayed with me throughout this journey. Especially at moments when the work felt uncertain, or when its relevance was not immediately obvious.
Still the same question
If there is one idea that has gradually emerged, it is that regenerative capacity is not fixed.
It is governed, at least in part, by the identity and function of immune cells—and therefore potentially modifiable.
That doesn’t make the problem simple. But it reframes it.
And in many ways, we are still following the same question.
Just with a clearer understanding of what actually matters—and with a team that made it possible to see it.
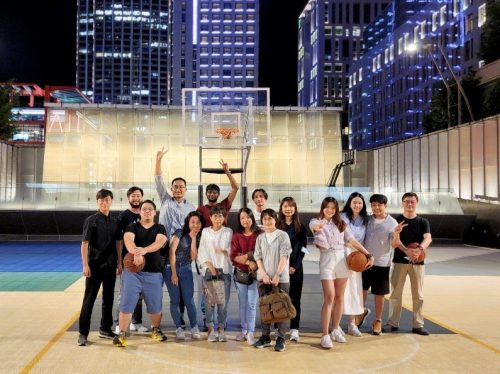
A glimpse of the team behind the work—reminding us that every figure is built on many shared moments that never make it into the paper. Kaushik (back row, fourth from the left) and Ke-Hsuan (fifth from the right).
References
1. Ito K, Morioka M, Kimura S, Tasaki M, Inohaya K, Kudo A. Differential reparative phenotypes between zebrafish and medaka after cardiac injury. Developmental Dynamics. 2014;243(9):1106-15.
2. Lai S-L, Marín-Juez R, Moura PL, Kuenne C, Lai JKH, Tsedeke AT, et al. Reciprocal analyses in zebrafish and medaka reveal that harnessing the immune response promotes cardiac regeneration. eLife. 2017;6:e25605.
3. Marin-Juez R, Marass M, Gauvrit S, Rossi A, Lai S-L, Materna SC, et al. Fast revascularization of the injured area is essential to support zebrafish heart regeneration. Proceedings of the National Academy of Sciences. 2016;113(40):11237-42.
4. Marín-Juez R, El-Sammak H, Helker CSM, Kamezaki A, Mullapuli ST, Bibli S-I, et al. Coronary Revascularization During Heart Regeneration Is Regulated by Epicardial and Endocardial Cues and Forms a Scaffold for Cardiomyocyte Repopulation. Developmental Cell. 2019;51(4):503-15.e4.
5. Wei K-H, Lin IT, Chowdhury K, Lim KL, Liu K-T, Ko T-M, et al. Comparative single-cell profiling reveals distinct cardiac resident macrophages essential for zebrafish heart regeneration. eLife. 2023;12:e84679.
6. Chowdhury K, Huang C-L, Lin IT, Hung Y-J, Lim KL, Liu H-W, et al. Immune modulation promotes heart regeneration through macrophage and Granulin functions in medaka. Proceedings of the National Academy of Sciences. 2026;123(16):e2524705123.
7. Grewal S. An interview with Didier Stainier. Development. 2015;142(17):2861-3.
From the helpimascientist.com archive, an in-depth discussion covering the many purposes of laboratory group meetings and why you should care about all of them.
The Marín-Juez laboratory, at the CHU Sainte-Justine Research Center, is recruiting PhD students and postdoctoral fellows (up to 5 years fully funded position). Our laboratory is interested in the cellular and molecular mechanisms regulating cardiac regeneration and development.
The successful applicant will join the Marín-Juez laboratory at the CHU Sainte-Justine Research Center, where they will have access to state-of-the-art facilities and technology platforms including Advanced imaging platform (light-sheet, spinning-disc confocal, multiphoton, STED super-resolution, etc.), genomics (DropSeq, 10x, Illumina Novaseq, Visium), IPSC Cell Reprograming and bioinformatics platforms. The CHU Sainte-Justine Research Center provides a thriving scientific environment where the successful applicant will have the opportunity to work with multidisciplinary scientific teams and to collaborate with talented clinicians and researchers.
Research project description
We have previously uncovered mechanisms governing coronary network replenishment, including the formation of a vascular scaffold that supports cardiomyocyte regeneration and mediates coronary-epicardial interactions and immune responses (Marín-Juez et al., PNAS 2016; Marín-Juez et al., Dev Cell 2019; El-Sammak et al., Circ Res 2022; Wang et al., Development 2024; Gupta et al. Dev Bio 2025; Rouf et al. Development 2026). Our recent work identifies the epicardium as a master regulator of cardiac fibrosis resolution and tissue replenishment (Kayman-Kürekçi et al. NCVR2026).
Building on these findings, we now aim to elucidate how the cardiac endothelium, epicardium, and immune system components cooperate to regulate tissue replenishment, as well as the specific mechanisms underlying their roles in cardiomyocyte regeneration and development.
PhD student position
Applicants should have training in molecular biology, cell biology, or related fields. Candidates should be enthusiastic about regenerative and developmental biology. Previous research experience with zebrafish and/or heart regeneration is highly valued but not essential. Candidates with experience in confocal/light-sheet imaging and/or genome engineering are strongly encouraged to apply.
Postdoc position
We are looking for candidates with a Ph.D. in the biological sciences and laboratory experience in tissue repair/regeneration, cellular, molecular biology, or genetics. Previous experience working with zebrafish, imaging and histology are highly valued but not essential. Candidates with experience in confocal/light-sheet imaging and/or genome engineering are strongly encouraged to apply. Preference will be given to applicants with excellent collaborative and communication skills.
How to apply
Candidates must send the required documentsto Rubén Marín Juez at ruben.marin.juez.hsj@ssss.gouv.qc.ca
 (201 votes)
 (No Ratings Yet)