Organ plumbing
Posted by Svend Dahl-Jensen, on 19 September 2018
Water is a fascinating substance. Its behavior sets a lot of interesting constraints on both how the surface of our world is shaped geologically and how life on said surface has adapted to optimize its use. Biology and geology, while vastly different in scale, share many commonalities that can we can learn from. Our work found one such connection: we found that the mammalian pancreas is like a river basin.
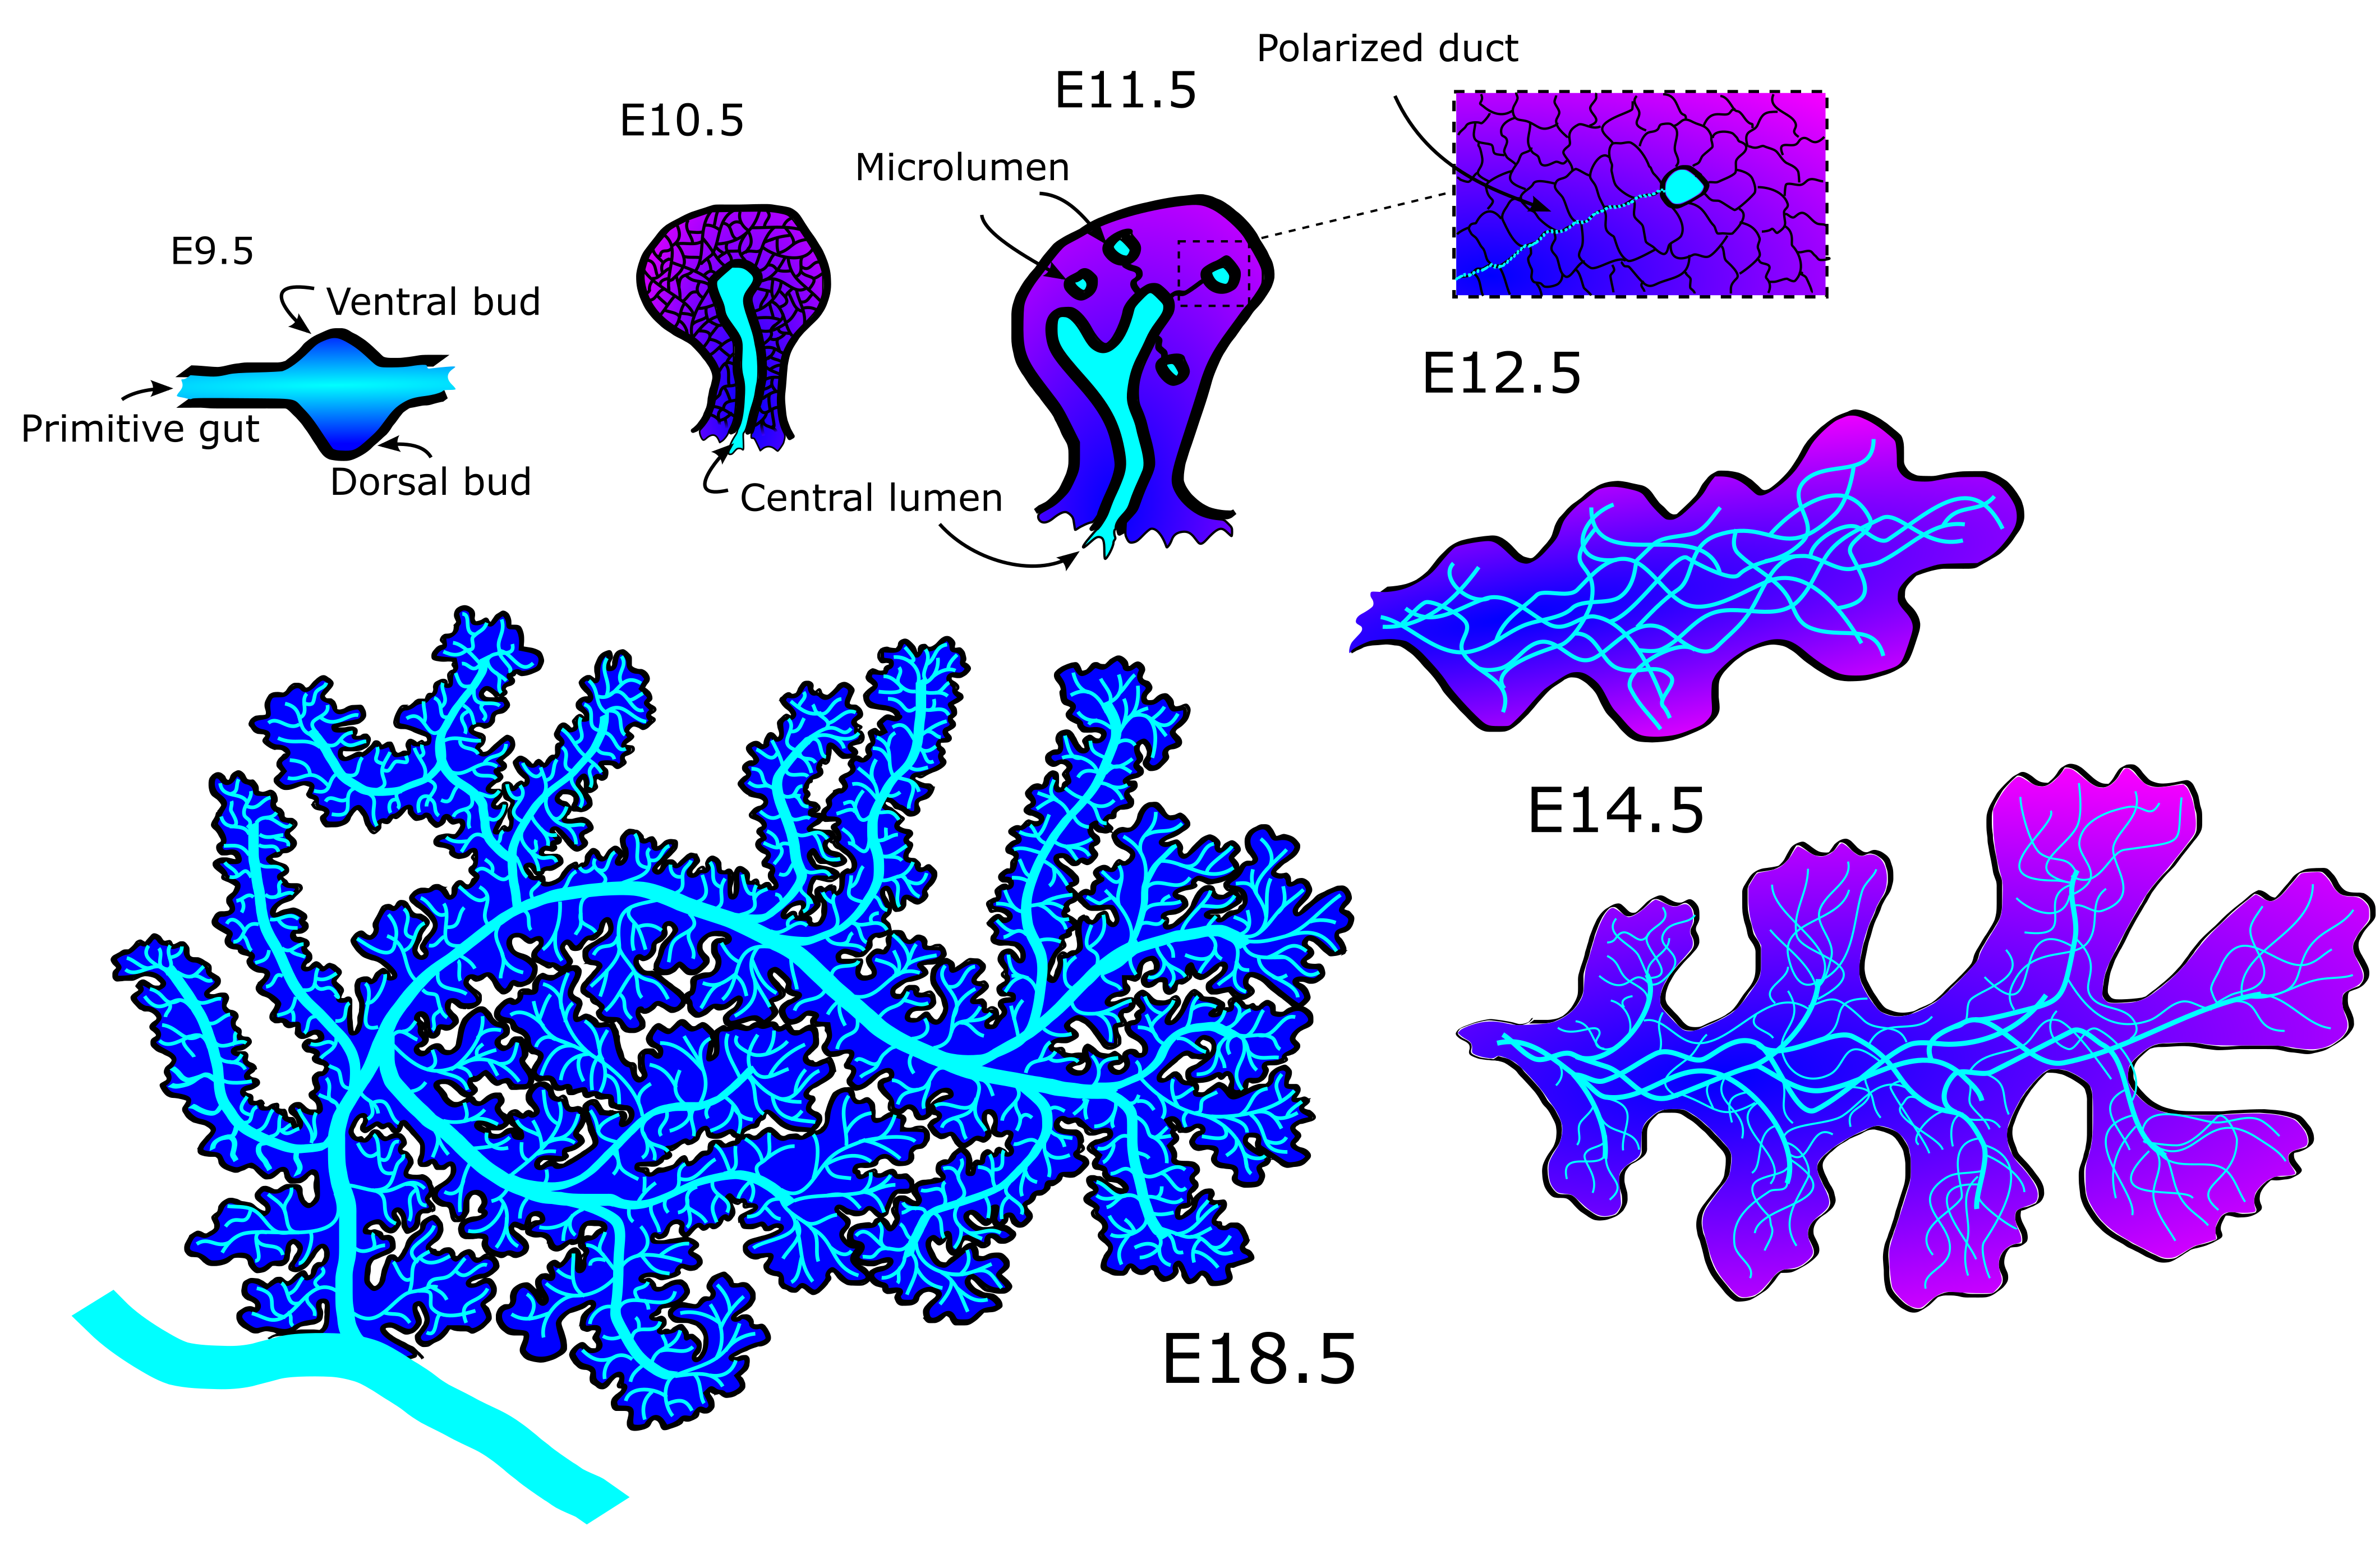
The mechanics behind the emergence and refinement of the ducts in the pancreas has been a mystery for some decades. First, the ducts form from unconnected microlumen in the pancreatic mass into a meshwork of interconnected tubes, connected seemingly at random (Fig 1). Later, as the pancreas nears maturity, it undergoes a transition from a mesh into a tree-like structure with no redundant ducts. The process does seem to have some stochasticity, as no two individuals has the exact same pattern of tubes when examined. Yet the function of delivering pancreatic juices to the duodenum is the same across healthy specimens.
In nature, simple rules can often result in very complex behavior. A good example is Turing patterns (1), in which fur and skin coloration can elegantly be explained by reaction-diffusion equations. It is for that reason that physicists often try to use simple models and derive universal laws in order to get some conceptual understanding of the phenomena they are analyzing. And it was with that mindset that we set out to study pancreatic development. Three years later we had made a great discovery by applying network theory and fluid mechanics to describe the developing pancreas.
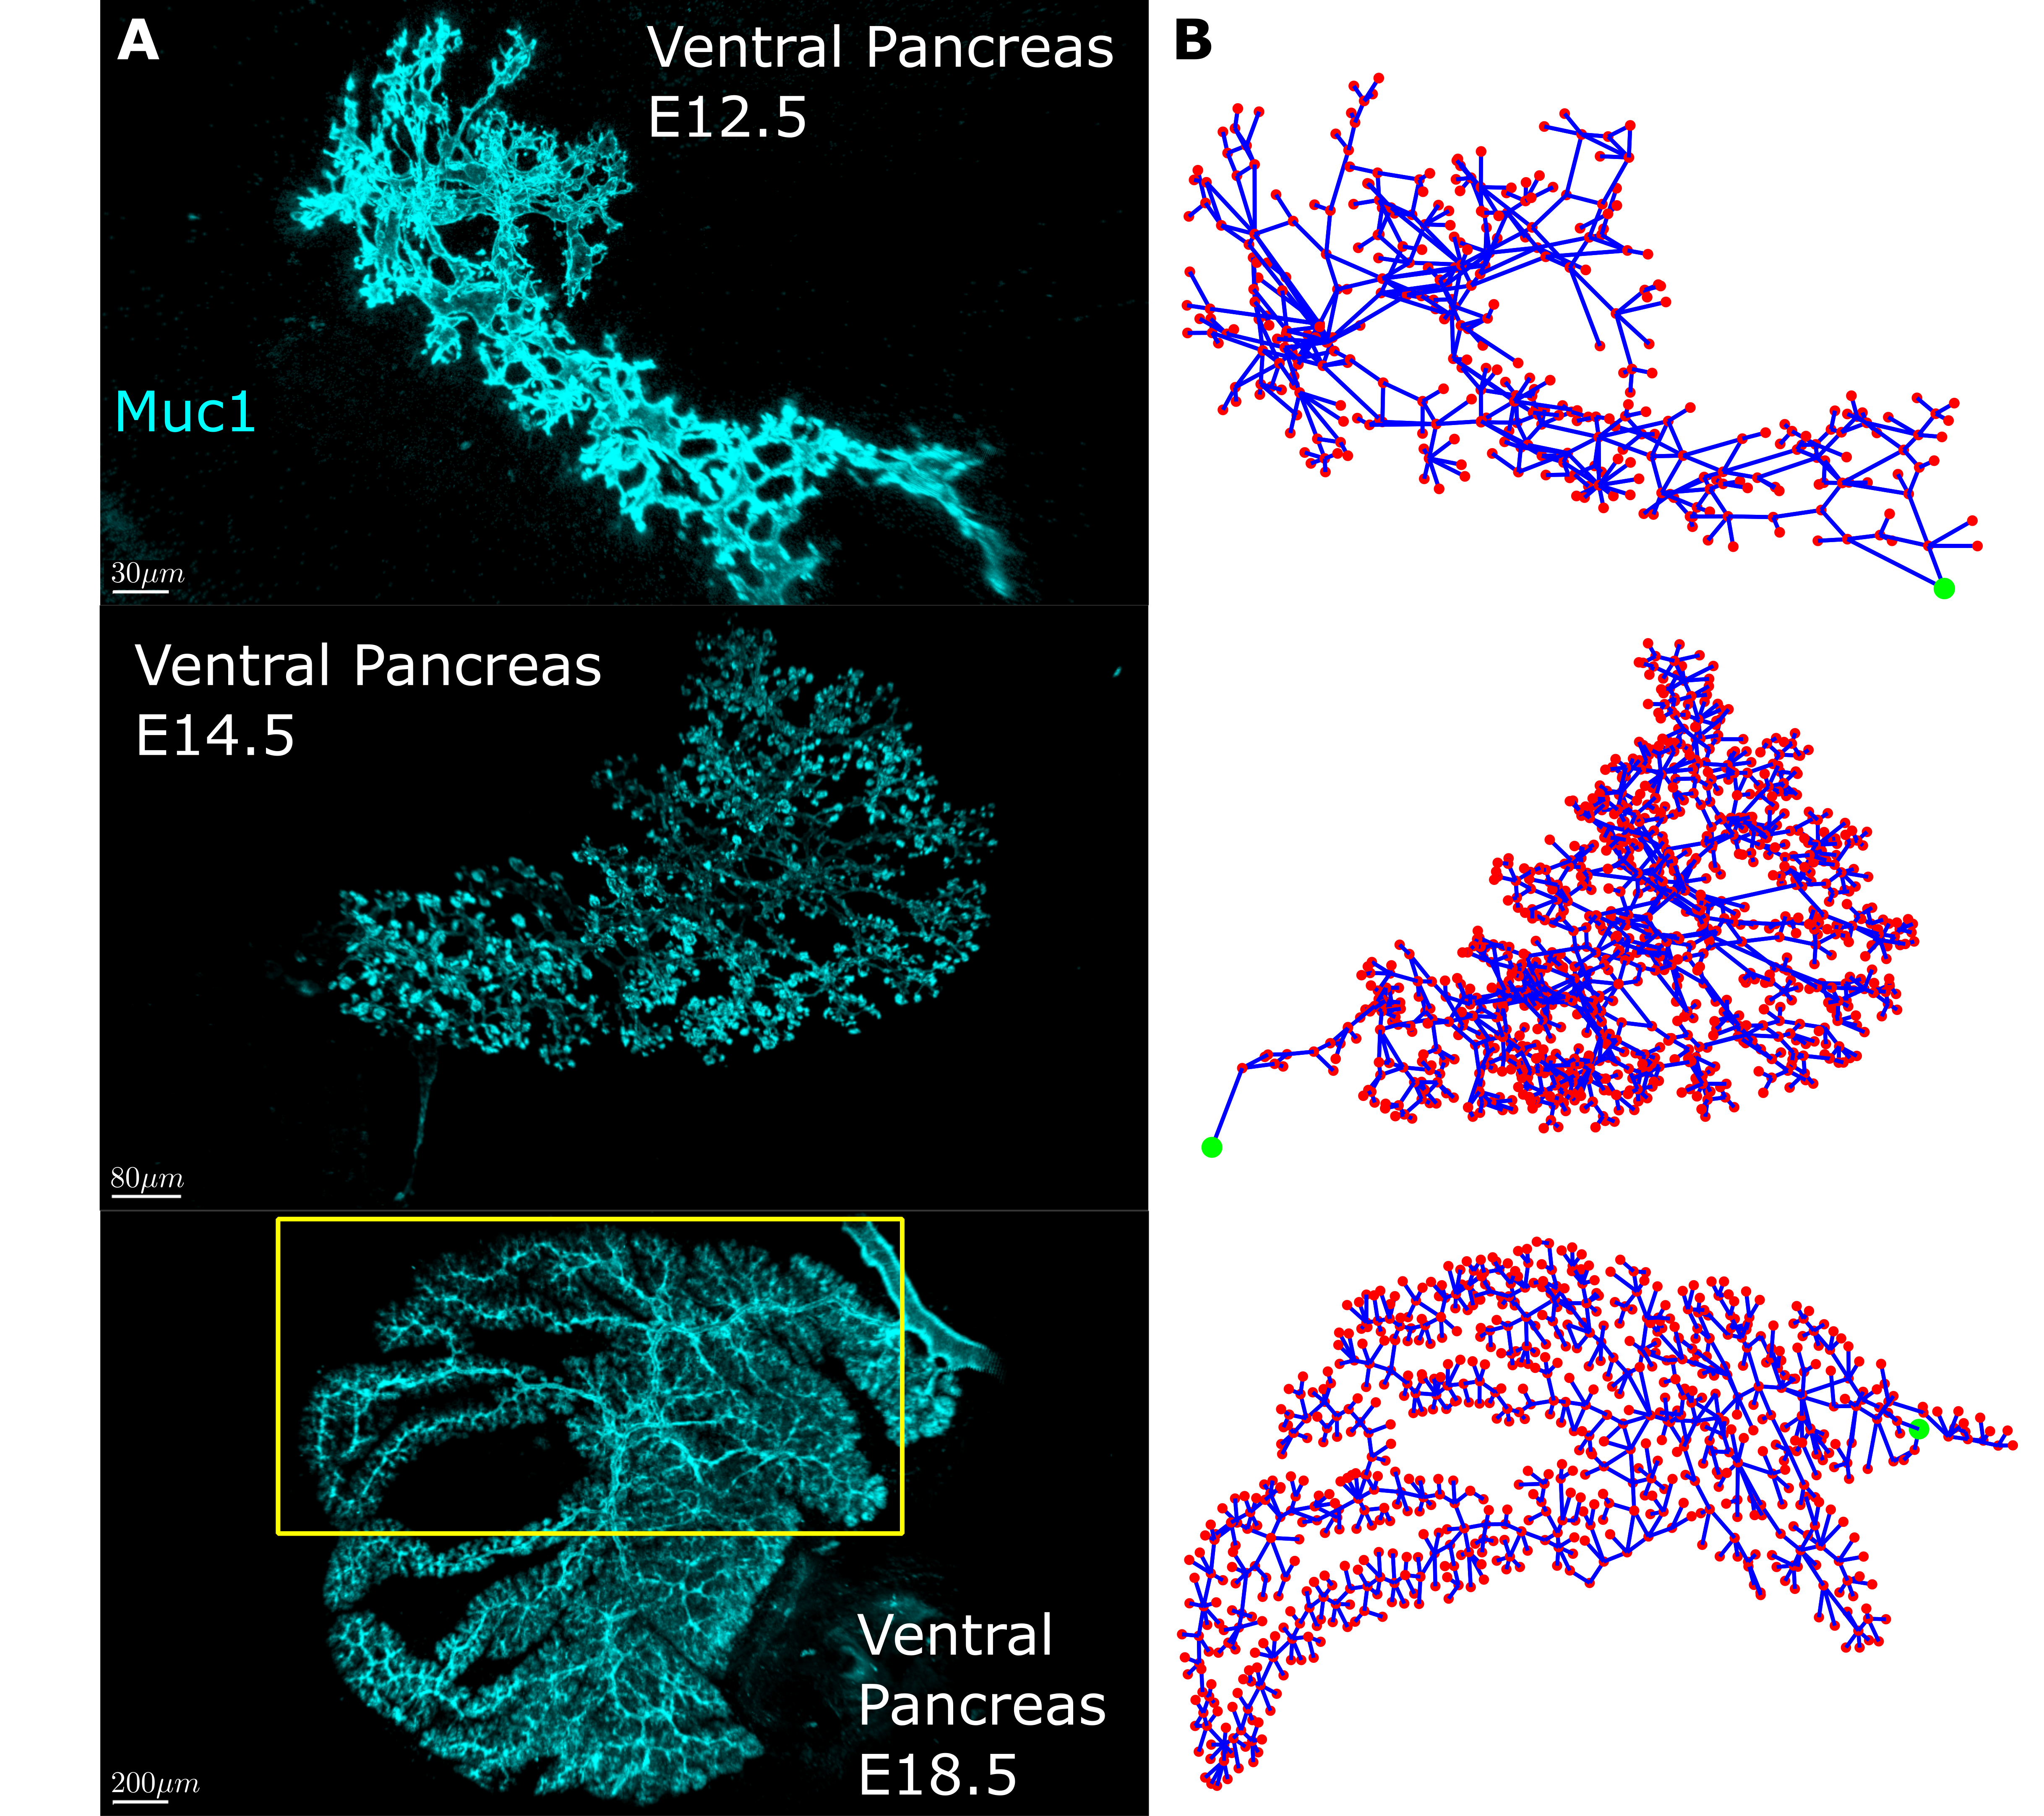
First, we needed quantifiable measures to describe how the pancreas tubes connect. We sought inspiration in network theory since the pancreas had all we needed – a network. Network (graph) theory is pretty simple at its core. Every network consists of nodes that serve as connection points and edges which are the connections between the points. The idea was to convert the pancreas tubes into edges and the tube intersections into nodes. The first snag we hit was that we found the images we had of the pancreas, while of excellent quality, were hard to automatically convert into a digitized network of nodes and connections between them. In the end we decided to go old school and digitize them by hand….
20000+ nodes later, we had an amazing dataset! We had digitized mouse pancreas networks at three different developmental stages: E12.5, when the network is very interconnected; E14.5, when the network is visually clearly beginning to change into a tree-like structure; and E18.5, when the network has almost fully transformed (Fig 2). What we found was stunning. It turns out that while the networks are visually very different, most of the quantitative features of the network are strikingly similar. Furthermore some of these quantities change with each developmental stage. This shows that the pancreas, while seemingly chaotic, must follow a set of rules when developing. To a physicist like me there is no sweeter thing because then you get try and uncover these rules. In the end, development of the pancreatic ducts can be explained on a macroscopic level by two models. One model creates the mesh, the other matures it into the tree-like structure.
In order to model the creation of the interconnected network that appeared we tried to naively model what we thought we saw: that the microlumen that emerged simply connected to some of the nearest microlumens. Our model therefore became the following:
- Create a node close to the bulk of the already existing nodes
- Form edges to some of the nearest nodes
- Reiterate 1 and 2 until you have the desired pancreas size
With the addition of some noise, our model makes a very nice approximation to the real pancreas from a network viewpoint.
In order to model the maturation of the pancreatic network from mesh to tree-like structure, we first had to figure out which mechanism could be the driver of such a selection. It is here that we drew inspiration from the flow of rivers. At this time point, we had also noticed that at the end of development the width of the ducts was wider and wider close to the exit, as seen in river basins.
The concept of the path of least resistance is that every entity will select the easiest path from a to b when selecting from multiple potential pathways. Water exhibits such behavior. If you pour water on the top of a hill of sand, all the water will flow on some select trajectories. There is another phenomenon hidden in this analogy: once water has passed through the sand, the water following it will experience less resistance. Therefore water seems to stick with its initial choice. This is why water flowing down hill is confined to specific paths. During a flood the water from a river can branch off in new directions, and if these newly created river branches are more favorable than the original, the river will change shape as the old river branch dries out and the new branch is widened. The end result is a river that is fairly optimal in delivering water from one or more source points to an end point.
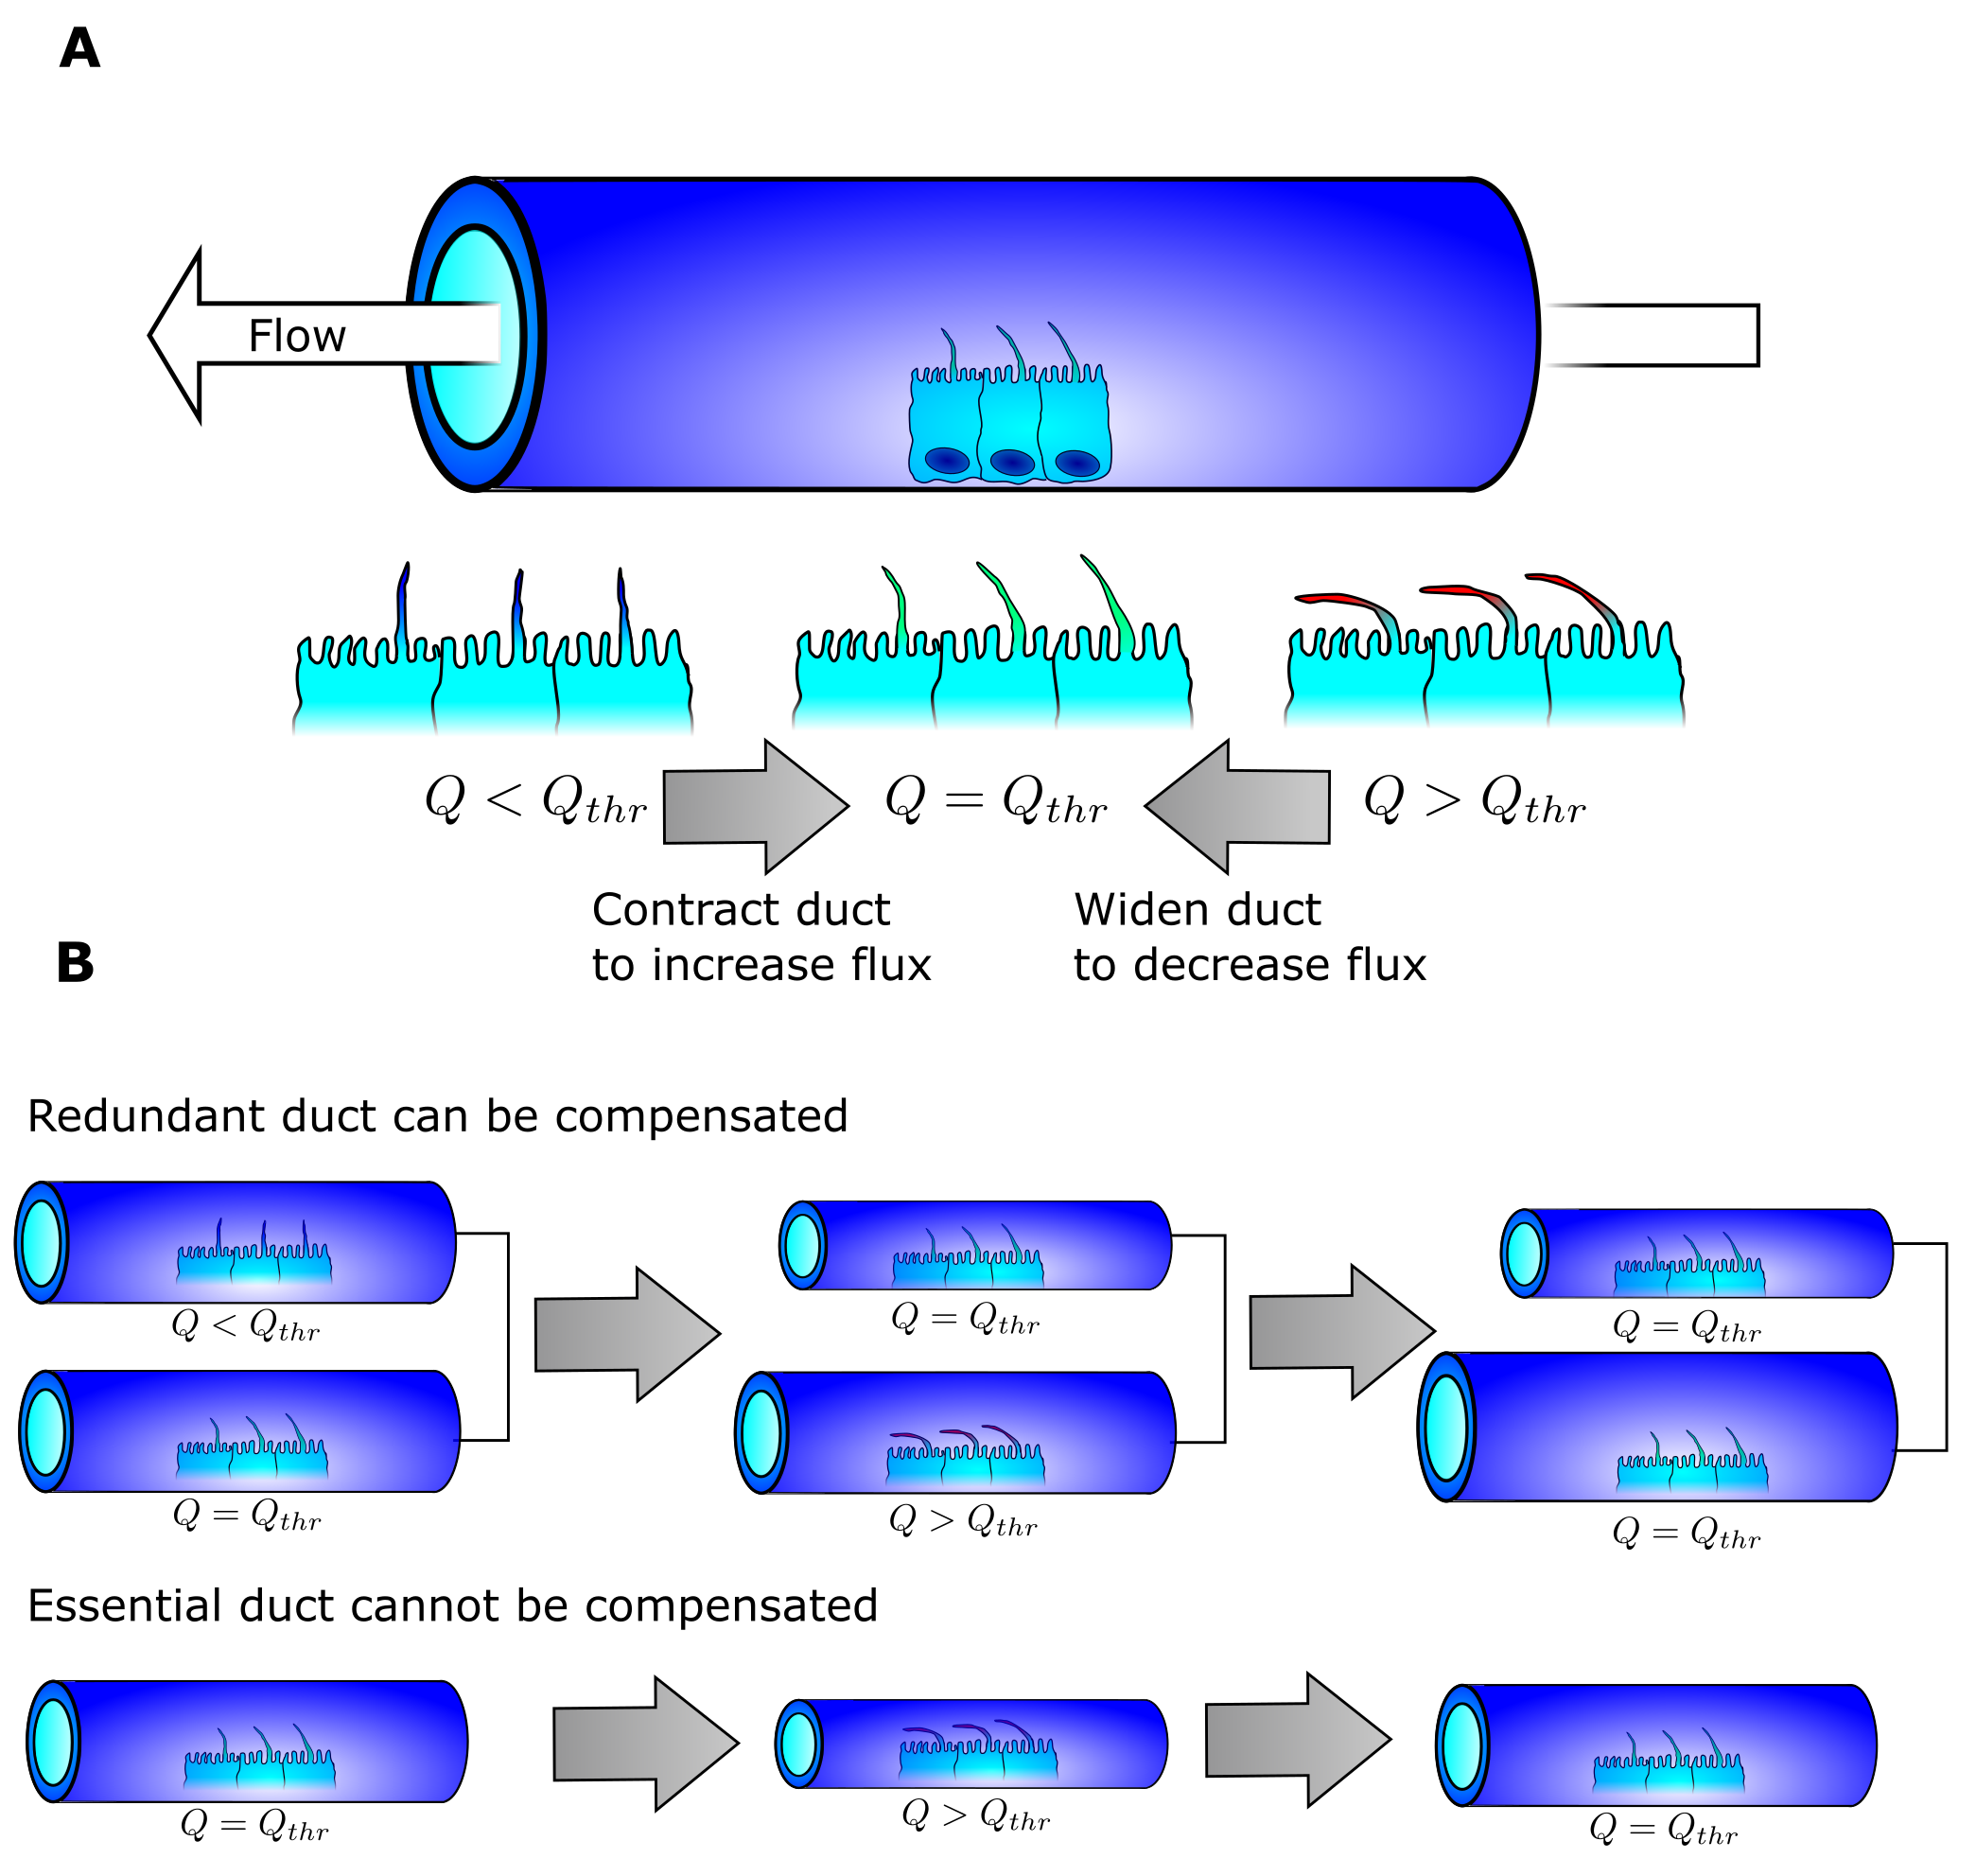
Our idea is that the pancreas may follow similar rules. By doing so, we postulate that the delivery of pancreatic juice from multiple source points (the pancreatic acini) into a single end point (the exit into the duodenum) finds the shortest path. Forming redundant ducts may enable this optimization. When fluid then runs through, the pancreas changes the duct diameter to correspond to the flow (Fig 3a). When the fluid flow is higher than a given threshold, the duct widens. When the flow is lower than the threshold, the duct shrinks in diameter. The ingenious detail in this simple scheme is that if redundant paths exist between the exit and the acini, the suboptimal paths can be shrunk until they no longer exist and the cells lining them may be reused by the surrounding tissue (Fig 3b). If a given path is the only path, it will stabilize into a duct with a diameter perfect for the flow it receives. The end-result is a structure with one optimized path from every acini to the exit that is homogeneous in fluid pressure as every duct has the ideal diameter for the given flow.
The concept was easy enough to test as we had the digitized networks. The model we constructed did the following:
- Let fluid run through the network either with the acini as the source or every point in the network as the source and wait until approximate steady state.
- Remove the redundant duct with least flow.
- Reiterate 1 and 2 until no redundant ducts exist.
The model can artificially mature an E14.5 into an E18.5 network, and optimize the average duct distance from every acini to the exit.
So there you have it: what the pancreas needs to optimize delivery of pancreatic juice is flow, a flow sensor, a duct diameter adjustment mechanism and a duct removal mechanism. Here it should be noted that while the pancreas is the basis of our discovery its task of producing fluid and move it somewhere else is not unique in the body. Other glands include the salivary (2) and lachrymal gland (3) and the mammary gland (4). It could be immensely interesting for future research to digitize these glands in the same way and see if any follows the same principle.
As a physicist I am happy to end here and say that the pancreas optimizes its own fluid delivering capabilities by locally following the path of least resistance, just like a river basin. My friends and collaborators who are biologists say that while we have seen that the exocrine cells actually secrete fluid as soon as they form a lumen, we have not yet measured flow, that we need to perturb it, that we only have hypotheses regarding the sensor and that we do not know the mechanisms leading to the disappearance of supernumerary loops … it will keep them busy for a while.
References
1 Turing, A. M. (1952). The chemical basis of morphogenesis. Philos. Trans. R. Soc. Lond. B Biol. Sci. 237, 37-72.
2 Patel VN, Rebustini IT, Hoffman MP. Salivary gland branching morphogenesis. Differentiation. 2006; 74(7):349–64. https://doi.org/10.1111/j.1432-0436.2006.00088.x PMID: 16916374
3 Gjorevski N, Nelson CM. Integrated morphodynamic signalling of the mammary gland. Nature reviews. Molecular cell biology. 2011; 12(9):581–93. https://doi.org/10.1038/nrm3168 PMID: 21829222
4 Dean C, Ito M, Makarenkova HP, Faber SC, Lang RA. Bmp7 regulates branching morphogenesis of the lacrimal gland by promoting mesenchymal proliferation and condensation. Development. 2004; 131(17):4155–65. https://doi.org/10.1242/dev.01285 PMID: 15280212
Link to our work
Deconstructing the principles of ductal network formation in the pancreas
Dahl-Jensen SB, Yennek S, Flasse L, Larsen HL, Sever D, et al. (2018) Deconstructing the principles of ductal network formation in the pancreas. PLOS Biology 16(7): e2002842. https://doi.org/10.1371/journal.pbio.2002842
 (No Ratings Yet)
 (3 votes)
