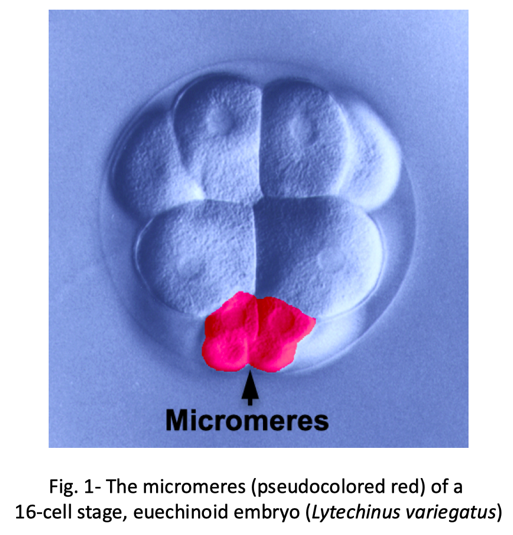
We know surprisingly little about how evolution has created new cell types. One of the best examples of a recently evolved cell type comes from early sea urchin development. Most sea urchins produce a group of early embryonic cells known as micromeres- four small blastomeres that form by unequal cell division at the vegetal pole of the early embryo (Fig. 1).
Micromeres give rise to primary mesenchyme cells (PMCs), a population of cells that moves into the blastocoel at the start of gastrulation and secretes a beautiful, biomineralized skeleton, which provides structural support for the larva. This is the developmental pattern seen in euechinoid sea urchins, a group that includes most species commonly used by researchers, and the pattern described in all developmental biology textbooks. Yet this developmental program is highly unusual within the echinoderm phylum. For example, the embryos of cidaroids, a small group of sea urchins that may be akin to “living fossils”, have variable numbers of micromeres and lack PMCs. In these embryos, mesenchyme cells migrate into the blastocoel and form a skeleton, but this occurs much later in development. A compelling body of evidence, including comparative studies in several echinoderm taxa, supports the view that the PMC lineage of euechinoids evolved relatively recently through the formation of micromeres and a heterochronic shift of an ancestral skeletogenic program into the early embryo.
Interestingly, like cidaroids, euechinoids produce late-migrating mesenchyme cells with skeleton-forming potential. These multi-potent cells, known as blastocoelar cells (BCs), ordinarily give rise to immunocyte-like cells. Their choice of cell fate is controlled by PMCs, which suppress the skeletogenic potential of BCs and direct them to instead to develop as immunocytes. The interaction between PMCs and BCs can be revealed by microsurgical experiments. If PMCs are ablated from the embryo, BCs undergo a striking change in phenotype; they adopt PMC-specific morphogenetic behaviors and secrete a correctly patterned skeleton. This switch in cell fate (a phenomenon that can be called “transfating”) is associated with the molecular reprogramming of BCs, which ectopically deploy a well-described skeletogenic gene regulatory network while extinguishing the expression of genes associated with an immunocyte fate. Remarkably, the effect of PMCs on BCs is titratable- the greater the number of PMCs that are removed from the embryo, the greater the number of BCs that transfate. The first indication of an interaction between PMCs and BCs came more than 50 years ago, but the molecular nature of the PMC-derived signal has remained a mystery.
In a recent study (Ettensohn CA, Adomako-Ankomah, A, 2019, The evolution of a new cell type was associated with competition for a signaling ligand. PLOS Biology 17: e3000460.), we discovered the elusive mechanism of the PMC-BC interaction. First, we showed through gene knockdown and inhibitor studies that an ectoderm-derived signaling ligand, VEGF3, and its cognate receptor, VEGFR-Ig10, are essential for the activation of the skeletogenic program by transfating BCs. Christian Gache’s laboratory first showed that these factors play an important role in PMC development and subsequent studies have revealed a conserved role for Vegf signaling in skeletogenesis throughout the phylum. One important gene activated by this signaling pathway in BCs is alx1, a gene that encodes a transcription factor with a pivotal role in controlling skeletogenic cell identity.
The requirement for VEGF signaling in BC transfating immediately suggested a possible mechanism for the PMC-BC interaction. Because PMCs express VEGFR-Ig10 from an early developmental stage, it seemed plausible that they might outcompete BCs for VEGF3, the ligand essential for activation of alx1 and downstream components of the skeletogenic gene network in BCs. This hypothesis led to two testable predictions. First, lowering the level of VEGFR-Ig10 expressed by PMCs should compromise their ability to suppress BC transfating. Second, over-expression of the ectoderm-derived ligand, VEGF3, should saturate receptors on the PMC surface and provide sufficient unbound ligand to induce the skeletogenic program in BCs, even in the presence of PMCs. Our study tested and confirmed both of these predictions, providing compelling support for the ligand-competition model (Fig. 2).
Of course, these results raise new questions. For example, we do not yet know the molecular connection between VEGF signaling and alx1 activation in BCs. Nevertheless, the findings are exciting for two reasons. First, to developmental biologists, they provide an example of the regulation of early embryonic cell fates by direct competition for a secreted signaling ligand, a developmental mechanism that has not been widely recognized. Second, to evolutionary biologists, they reveal that a novel cell type evolved by out-competing other embryonic cell lineages for an essential signaling ligand that regulates the expression of a transcription factor controlling cell identity. In the future, the micromere-PMC lineage will continue to be a powerful experimental model for elucidating developmental and evolutionary mechanisms that have led to the appearance of new cell types.
The Company of Biologists, publisher of Development, is excited to announce a two-year pilot transitional open access (OA) agreement with Jisc from January 2020.
The ‘Read and Publish’ deal will permit researchers at participating institutions unlimited access to all three subscription journals from The Company of Biologists, including the full archive dating back as far as 1853, and will allow the accepted articles of corresponding authors to be published open access by default and without limit.
Matthew Freeman, Chairman of The Company of Biologists and Head of the Dunn School of Pathology, University of Oxford said:
“We are thrilled to sign our first transitional agreement with Jisc. As a small not-for-profit publisher, the establishment of Read & Publish deals strengthens our support for the biological community and represents an important step in our open access journey.”
The Company of Biologists is a not-for-profit publishing company dedicated to supporting and inspiring the biological community. We do this by:
publishing five specialist peer-reviewed journals: Development, Journal of Cell Science, Journal of Experimental Biology, Disease Models & Mechanisms (open access) and Biology Open (open access)
funding meetings and Workshops to encourage cross-fertilisation of interdisciplinary ideas
providing grants, ranging from support for societies to Travelling Fellowships for graduate students and post-doctoral researchers.
The Company of Biologists staff photo
Kathryn Spiller, licensing manager at Jisc said:
“We are delighted that The Company of Biologists has joined the small group of not-for-profit publishers who are pushing the open access agenda in offering an affordable ‘read and publish’ agreement to UK universities for 2020.”
About Jisc
Jisc’s vision is for the UK to be the most digitally advanced education and research nation in the world. At its heart is the super-fast national research and education network, Janet, with built-in cyber security protection. Jisc also provides technology solutions for its members (colleges, universities and research centres) and customers (public sector bodies), helps members save time and money by negotiating sector-wide deals and provides advice and practical assistance on digital technology. Jisc is funded by the UK higher and further education and research funding bodies and member institutions.
A short-term post-doc position is available with Professor Kate Storey, School of Life Sciences, University of Dundee – immediately until 31 January 2021, with some flexibility if required. There may also be a possibility to extend this end date. The project involves developing our ongoing work with a human iPS cell derived neural differentiation assay to investigate cell biological mechanisms regulating neurogenesis. This will include generating and characterising reporter hiPS cell lines and their use in live cell imaging experiments to monitor neuroepithelial cell behaviour and how this changes in stress conditions. We are looking for a thoughtful and enthusiastic researcher to join our lively team – you will need a PhD in a relevant subject and expertise in molecular and cell biology as well as imaging – although training in our specific imaging approaches will be provided. Informal enquiries welcome k.g.storey@dundee.ac.uk
Richard Bailleul, Jonathan Touboul and Marie Manceau
Patterning in question: 60 years of mathematical and biological studies
The coat of Vertebrates displays a stunning diversity of motifs created by the spatial arrangement of appendages and pigments across the skin surface. Strikingly, many have similar periodicity (i.e., number of repetitions within a period of space or time) or orientation along body axes within taxa or species. This reproducibility, key to fitness, is likely shaped by developmental constrains. A long-standing scientific challenge has been to understand the tissue, cell and molecular mechanisms underlying the emergence of natural patterns and to what extent these processes contribute to pattern evolution.
Alan Turing’s milestone 1952 paper “The chemical basis of morphogenesis” (ref 1) conceptualized the principles of pattern formation through self-organization: instabilities within an initially homogeneous surface or volume may cause the spontaneous arrangement of distinct characters in a pattern. The mathematical model Turing described involved two diffusing factors, an activator and a repressor, as well as a catalyst, and since his pioneering work, a plethora of models based on Turing’s theoretical framework have been used to generate a great diversity of patterns that visually resemble those observed in nature through in silico computer simulations (ref 2). Biological validation of mathematical models such as Turing mechanisms is however a difficult task, because a single pattern can often be reproduced by a variety of models that may represent very distinct biological processes. Conversely, a single model can often generate a variety of patterns when its parameters are changed. In addition, models often allow reproducing patterns arising at equilibrium (i.e., stable states) but are not developed to anticipate progressive steps in dynamics of pattern emergence. They thus rarely produce realistic hypotheses on the developmental paths to pattern formation.
Biological studies of animal patterns have identified patterning molecules and cellular events through the use of mutant screens in genetic systems such as fish or mice, or expression analyses of “usual suspect” factors (refs 3, 4). These studies showed that diffusing molecules called morphogens dictate cell fate depending on their local concentration, creating spatial differences and tissue boundaries within developing organs (ref 5). However, interpreting empirical tests has been limited by the difficulty to link a given pattern to prior events occurring in the initially homogeneous tissue devoid of spatial reference, and to date, only a few pattern-forming factors have been identified in vivo. The current culprits for applied mathematicians and developmental biologists are on the one hand, designing mathematical models able to realistically guide biological experimentation of patterning mechanisms and on the other, validating (or contradicting) theoretical predictions through in vivo experiments.
Using natural variation to engage a math-bio dialogue
To engage efficient crosstalk between theoretical and empirical approaches, Richard Bailleul, a PhD student in applied mathematics, joined the laboratories of Jonathan Touboul, which focuses on mathematical modeling of living systems, and of Marie Manceau, which studies developmental processes of pattern formation. Richard took advantage of the highly reproducible, stereotypical arrangement of feather follicles in bird plumage and designed a modeling approach whereby a unified mathematical model is to be confronted not only with final plumage patterns in one bird species, but also with its dynamics of developmental emergence for several groups chosen across the bird phylogeny. Our idea was that by being more restrictive, modeling would be more powerful to design simple empirical tests.
From one-by-one to all at once: a breadth of patterning dynamics
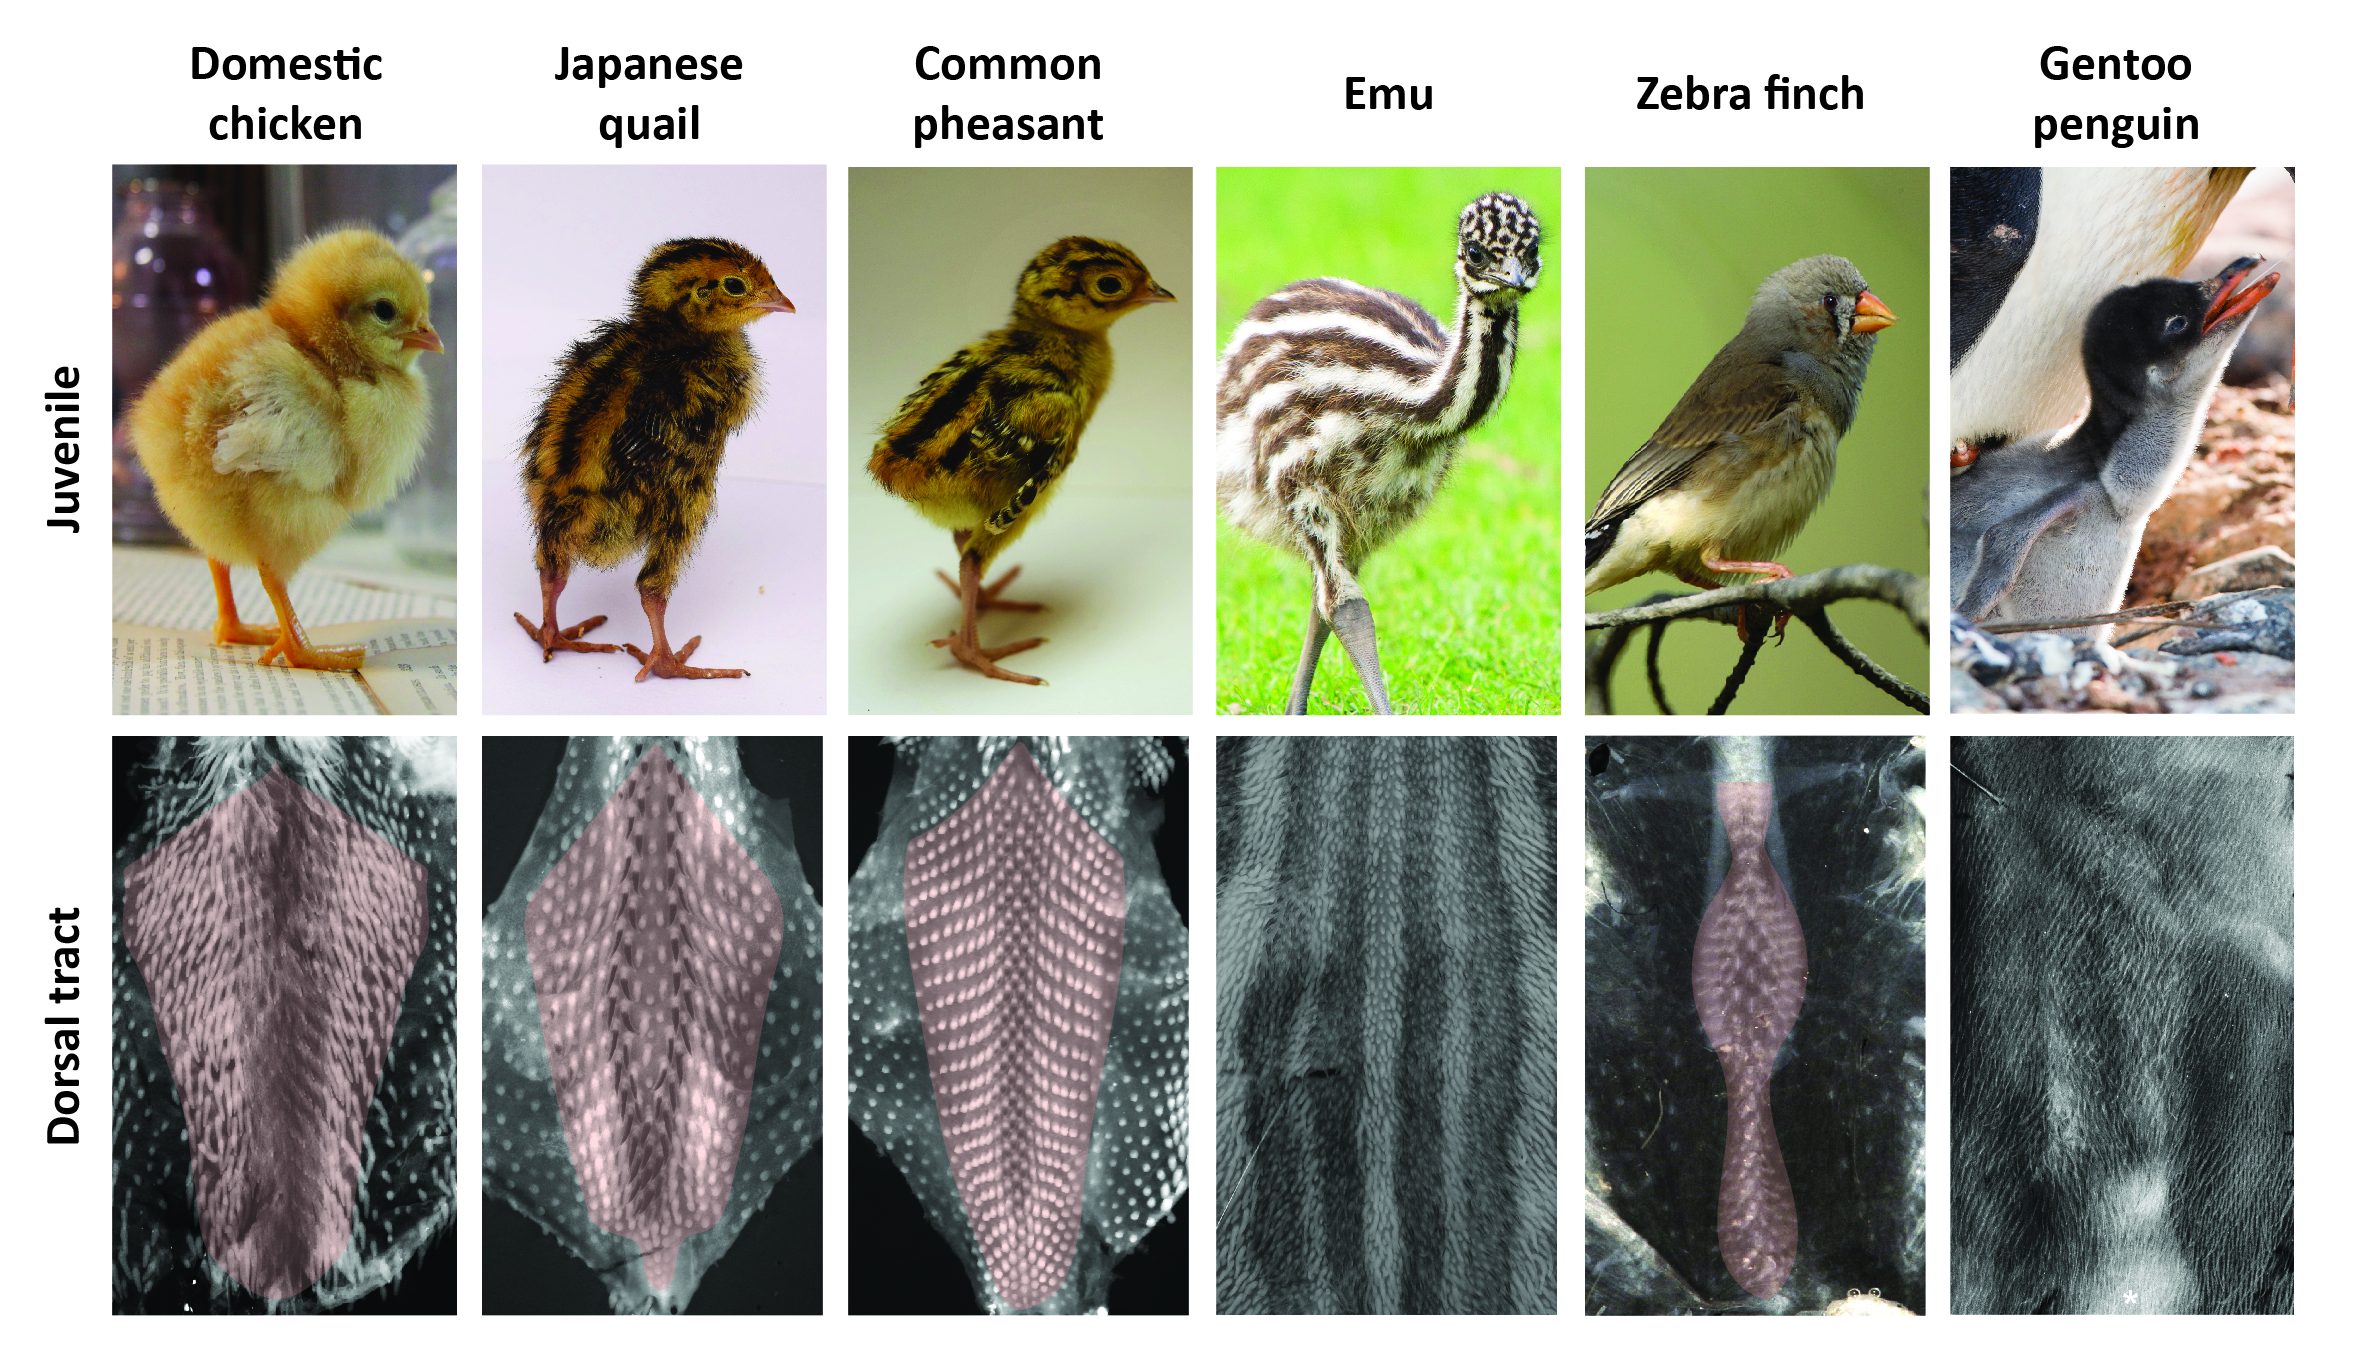
The timely emergence of feather follicles had been previously meticulously described in the domestic chicken: follicles individualize gradually, forming longitudinal rows in a medial-to-lateral “wave” of differentiation. This row-by-row dynamics results in a regular dotted pattern covering the “tract”, which is the area of the skin covered by feathers (ref 6). We performed a comparative spatio-temporal survey by marking feather follicles throughout completion of the dorsal tract (using in situ hybridizations for ß-catenin). In addition to the domestic chicken we used other poultry birds, namely Japanese quails and Common pheasants, collected from local farmers. All three species represent Galloanserae, one of the three major bird groups (ref 7). To represent the second group, Neoaves, we chose the zebra finch, a passerine songbird widely studied for its inherited singing behavior for which we have a breeding colony at the Collège de France, and the emblematic Gentoo penguin whose eggs were collected directly from breeding colonies in the Falkland Islands. Finally, emus (eggs were provided by local breeders) were studied to account for the derived, ancestral group of Paleognathes, which also comprises ostriches or tinamous. Much like penguins – used here for the first time in developmental studies – emus do not fly, which we suspected would provide more sizable variation in plumage patterns and their emergence. Richard’s results demonstrated that this is the case: we observed extensive variation in the final shape and width of the dorsal tract (Figure 1).
In all poultry birds and the zebra finch, this tract forms in a row-by-row sequence of follicle-forming lines, patterning duration for tract completion being similar despite differences in hatching times. Species vary however in the location and shape of the first-formed, medial-most rows. Emus and penguins sharply contrast with other species: their feather follicles individualize simultaneously and in a comparably shorter developmental window within wide competent areas (Figure 2). Follicle size also varies between species (e.g., much bigger in the quail than in the zebra finch), as well as their local geometrical arrangement (ranging from sparse and irregularly distributed in the emu to a striking, extremely dense and highly symmetrical pattern in the penguin). Variation in patterning dynamics is thus a combination of differences, with not only duration and transitory states of plumage patterning changing substantially between species, but also follicle size, regularity or spacing constituting very diverse attributes. With such imbrication, it was time for math to take the baton.
Initial conditions trigger directional reaction-diffusion, chemotaxis and proliferation
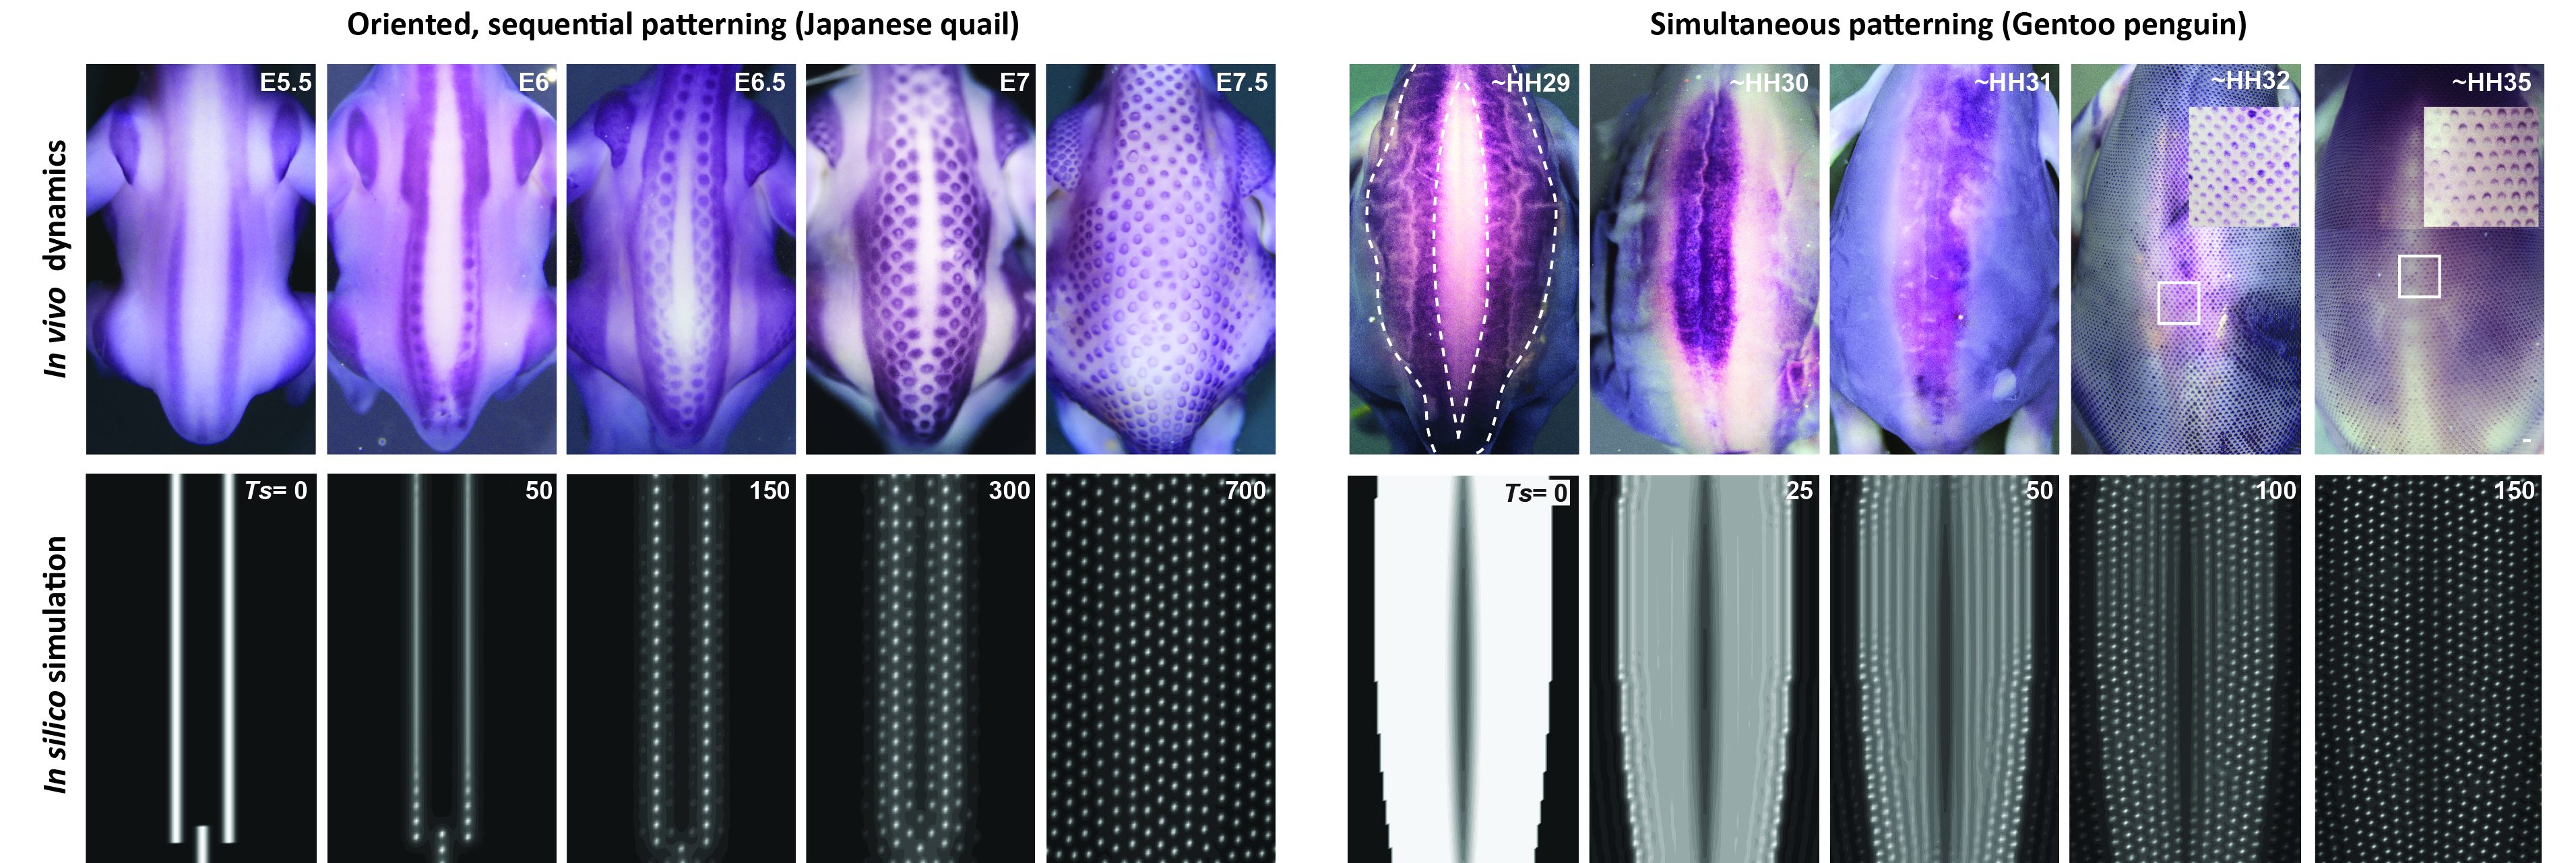
Inspired by the extensive literature that followed Alan Turing’s work – in particular modeling studies of virus spreading and population behavior – we developed a model combining two preeminent processes previously used to explain feather patterning, namely reaction-diffusion equations akin to Turing’s original model and chemotaxis that represents cell movements towards chemical factors (ref 8, 9), with an explicit mathematical term describing cell proliferation as an autonomous logistic function. This term implements growth in systems with resource limitations [Ref 10] and classical theories of diffusion equations with logistic growth are known to develop traveling waves, spreading initial perturbations through directional nearest-neighbor contagion. Simulations of the resulting unified model reproduced final pattern differences as well as species-specific patterning dynamics, without forcing onto an extrinsic wave as was previously done (Ref 11), but only by applying measured axial initial conditions corresponding to the position of first-formed follicles on simulation frames of species-specific sizes (Figure 2).
Figure 2: In vivo vs. in silico dynamics of dorsal feather patterning. (Upper panels) In poultry birds and the zebra finch, dorsal feathers appear in a sequential manner from narrow longitudinal domains, while in emus and penguins they appear simultaneously within large areas. (Bottom panels) Computer simulations of our unified model recapitulate both solely through changes in axial initial conditions.
We played with parameter values, the geometry and orientation of initial conditions, or proliferation rates, and formulated two major predictions:
– Initial conditions trigger the follicle wave sequence and control its species-specific sequence (i.e., in a row-by-row dynamics when initial conditions are spatially restricted and sharp enough, or simultaneously otherwise)
– The proliferation rate of the logistic source controls the duration of the patterning process by governing the timely lateral propagation of an increase in cell density.
Equipped with these predictions, Richard went back to the bench.
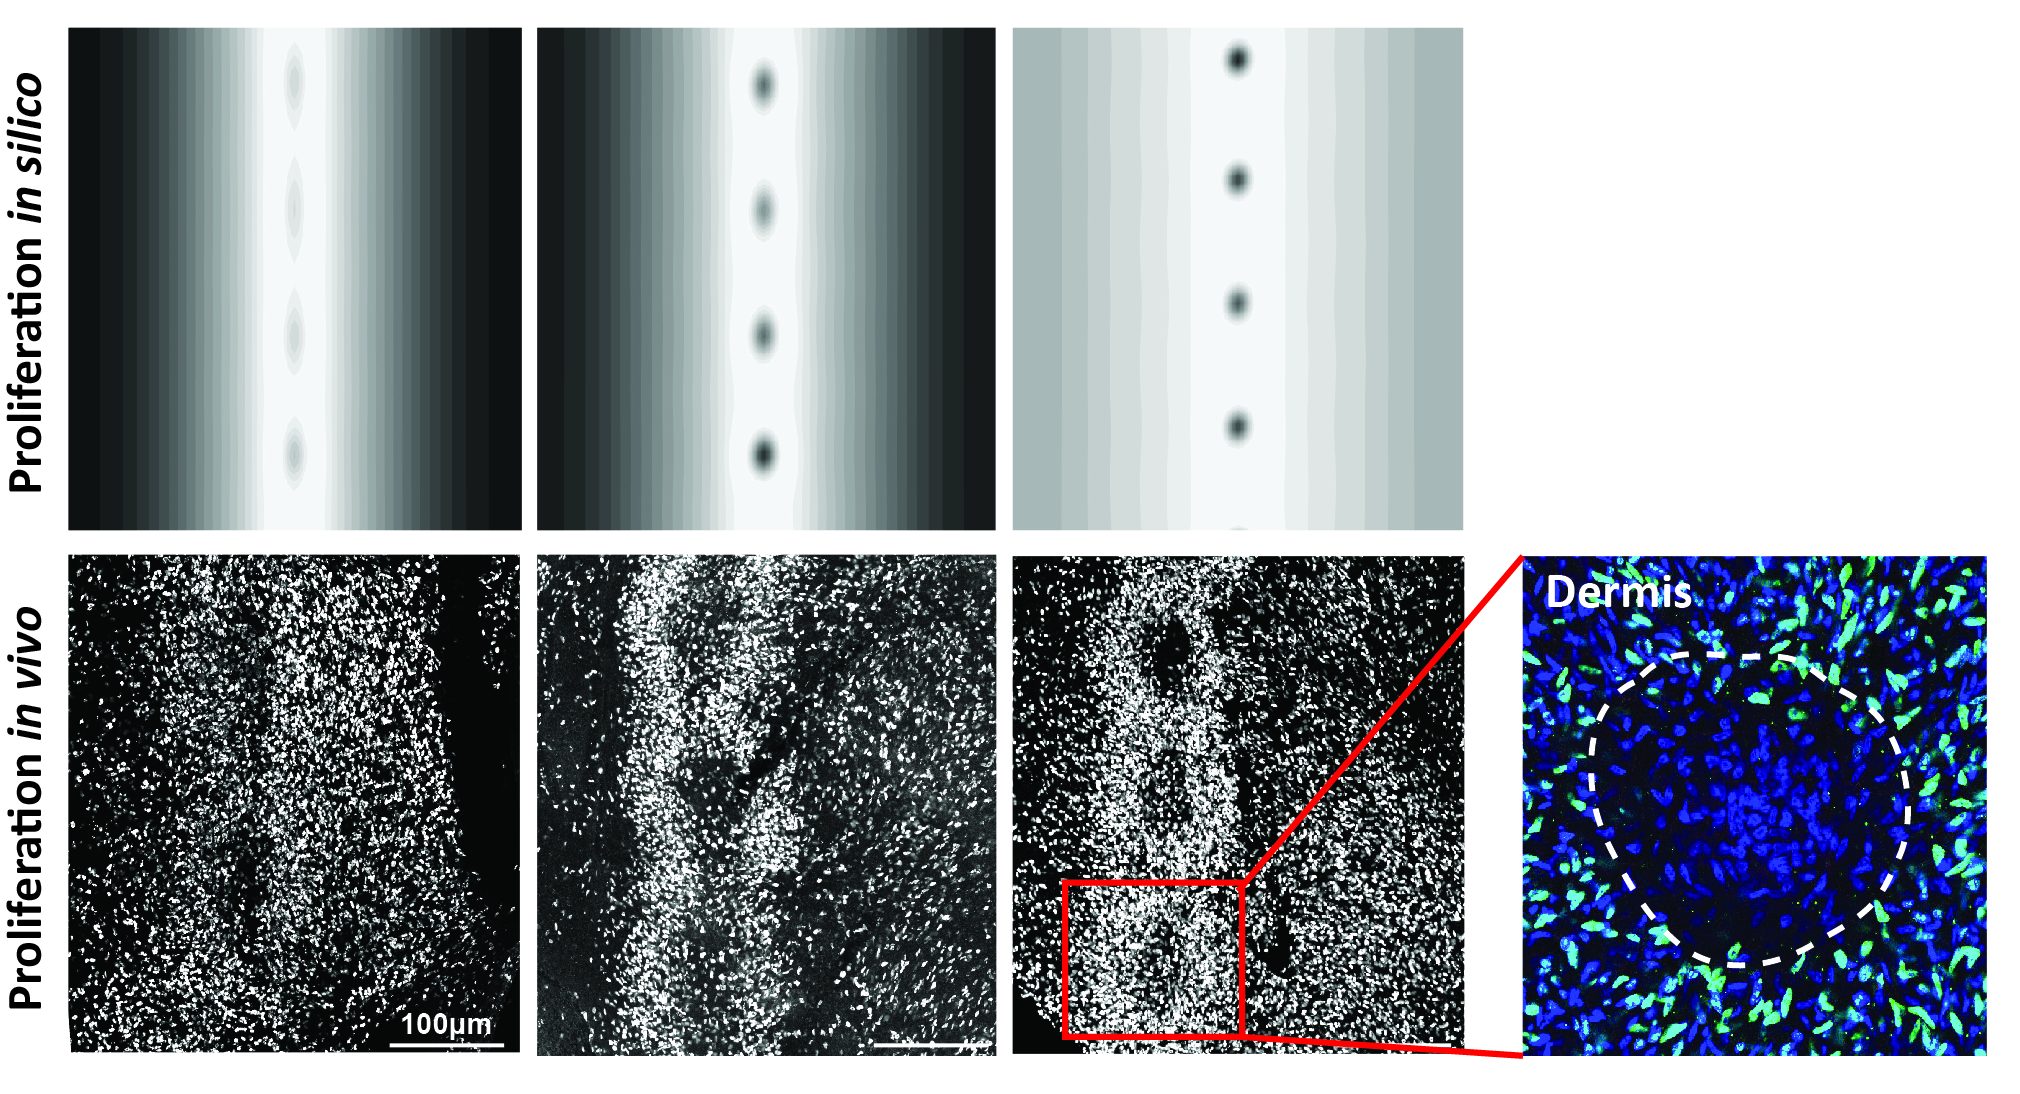
We chose to investigate the relevance of model-based predictions by analyzing dynamics of cell proliferation throughout tract differentiation in the Japanese quail. We confirmed the existence of a travelling front of increased cell density that progressively provides follicle-forming competence to longitudinal domains as it propagates laterally. Was it acting in a logistic-like fashion? We thoroughly analyzed confocal images of BrdU-stained developing skins and showed that the ratio of proliferative cells, linearly decreasing with respect to cell density, ceases when the skin tissue attains a certain carrying capacity (i.e., a cell density threshold; Figure 3). Cell proliferation thus occurred exactly according to predictions of a logistic growth term. This result represents a unique in vivo validation of this widely used mathematical equation. Drug treatments on skin explants inhibiting proliferation without altering the carrying capacity of the skin demonstrated that proliferation rate governs pattern duration, also supporting the predictions of the model.
Figure 3: Skin cells proliferate in a logistic fashion at the onset of follicle appearance. Simulating components of the implemented logistic proliferation function of our model (upper panels) reproduces the proliferating behavior of proliferative cells (stained in white or shown in green on the higher magnification image on the right) on skin explants of Japanese quail embryos. In both cases we observe a linearly decreasing rate of proliferation with respect to cell density and a carrying capacity of the skin above which proliferation ceases.
On feather pattern evolution… and what about penguins?
This study established a fruitful dialogue between theory, numerical simulations and in vivo experimentation and thereby showed that if a self-organizing feather follicle individualization recipe is conserved among birds, initial conditions in the naïve skin system differ. This variation produces changes in the directionality and sequence of developmental paths to pattern establishment. Competence to form feather follicles travels through the lateral transfer of increased cell proliferation, at a rate controlling a certain lapse of pattern duration, eventually completing tract patterning in a species-specific time.
As we tracked various developmental paths, we can propose that in emus and penguins, the converging loss of featherless area in the dorsum, and potentially, of flight ability, may be due to an absence of sequential patterning. Whether sequentiality has been lost during evolution remains to be studied, although it is likely the case in the penguin, which is part of otherwise flying Neoaves birds. Moreover, we suggest that the loss of flight is likely unrelated to local pattern geometry and regularity, attributes that differ in emus and penguins with the latter displaying an extremely dense, squared geometrical arrangement of its follicles. Despite implementing realistic sizes of computational frames to our simulations, our mathematical framework does not explain some singularities observed in the penguin, suggesting that additional patterning mechanisms are at stake in these emblematic birds; this is the promise of further back and forth between the computer and the bench.
The Company of Biologists’ journals – Development, Journal of Cell Science, Journal of Experimental Biology andDisease Models & Mechanisms – offer Travelling Fellowships of up to £2,500 to graduate students and post-doctoral researchers wishing to make collaborative visits to other laboratories. These are designed to offset the cost of travel and other expenses. There is no restriction on nationality.
They really are an amazing opportunity for ECRs to learn new things, meet new people and travel to new places.
The current round of Travelling Fellowships closes on 29 November 2019 (for travel after 14 January 2020)
We invite applications for an ERC funded postdoctoral research position to study divergence in brains and behaviour in Heliconius butterflies with Dr Richard Merrill’s research group at Ludwig-Maximilians-Universität (LMU) Munich. The project will run in close collaboration with Dr Stephen Montgomery at the University of Bristol, with project partners at Universidad Regional Amazónica (Ecuador) and Universidad del Rosario (Colombia). The position is funded by an ERC starting grant awarded to Dr Merrill, and is initially available for 2 years, with a further 2 years of funding available dependent on progress and interests. The position would be available at the earliest from February 2020.
The postdoc will focus on the evolution and genetic basis of differences in neuroanatomy and associated behaviours between divergent Heliconius taxa. The major aims of the position are to:
a) develop and execute assays of olfactory and visual sensitivity and integration using behavioural experiments,
b) quantify heritable variation in neuroanatomy between populations,
c) determine the behavioural effects of intermediate traits in interspecific hybrids.
The postdoc will also determine whether divergent behavioural and neuroanatomical phenotypes are functionally linked by assaying interspecific hybrids. By combining these data with genomic techniques the researcher will then investigate the genetic basis of shifts in brain and behaviour. The successful candidate will be required to spend substantial periods in the tropics (predominantly Ecuador), which will require excellent project management skills and considerable self-motivation.
Applicants should have a PhD, completed or completion imminent, in evolutionary biology/genetics, sensory biology, neuroethology, animal behaviour, or a related field. Experience of managing animal stocks and conducting behavioural analyses in insects would be desirable. Candidates are expected to work collaboratively, within the group and across the community more generally, and to take an active role in the supervision of students and management of insectaries. Enthusiasm, determination and the capacity to work independently are essential.
LMU is recognized among Europe’s premier academic and research institutions, being consistently ranked among the top Universities worldwide. Within the Division of Evolutionary Biology (http://www.evol.bio.lmu.de), the postdoctoral researcher will be part of vibrant international communities of scientists. In addition, the researcher will join a collaborative and driven community of Heliconius biologists. The working language of the lab and the Division of Evolutionary Biology is English.
Further information can be found at (https://richmerrill.wordpress.com), and questions should be directed to Richard Merrill (merrill@bio.lmu.de). Applications, made up of a single pdf (file name = candidates surname), should include a current CV, letter of motivation and names and contact details of two referees. Please send applications by email (subject: ‘Brain postdoc’) to Richard Merrill (merrill@bio.lmu.de) before the deadline of 30 November 2019.
We are looking for ambitious and motivated postgraduate candidates to join our new computational biology group at the MRC Centre for Regenerative Medicine in Edinburgh. We are using expertise in mathematical modelling of cell interactions to answer biological questions in development and regeneration in close collaboration with experimental colleagues.
There are four projects, competition-funded through the eastbio and Precision Medicine programmes. All projects involve computational as well as experimental or data analysis work. Click through the links below for more information on each project:
Please don’t hesitate to get in touch if you are interested in any of the above projects. Find a list of all opportunities at the Centre for Regenerative Medicine here.
Our understanding of many fundamental aspects of early human development is still in its infancy, but a promising avenue for research uses advanced in vitro culturing techniques. For instance, confining human embryonic stem cells to micropatterned substrates and directing differentiation with signalling molecules has proved a powerful system to mimic (and readily perturb) events usually hidden in the embryo. A paper in Development now applies this technology to the question of how the embryonic ectoderm is patterned into defined domains of progenitor cells. We caught up with first author and graduate student George Britton and his supervisor Aryeh Warmflash, Assistant Professor in the Department of Biosciences at Rice University in Houston, Texas, to find out more about the paper.
George (L) and Aryeh (R)
Aryeh, can you give us your scientific biography and the questions your lab is trying to answer?
AW I was originally trained as a theoretical physicist and spent a good deal of time in graduate school developing techniques for modelling non-equilibrium systems, in Aaron Dinner’s lab at the University of Chicago. I also got involved in creating mathematical models of the development of the immune system and became convinced that the most interesting questions were in developmental biology. I realised that, although we had great collaborators for my graduate work, if I didn’t learn to do experiments, I would always be dependent on others to generate data. It really isn’t possible to make progress in biology from a purely theoretical standpoint. I was interested in working on symmetry breaking and spatial patterning, so, for my postdoc, I moved to Rockefeller University to work with Eric Siggia (a theoretician) and Ali Brivanlou, who studies early development using Xenopus frogs and human embryonic stem cells. I actually started out working with frogs, but found it to be a difficult system for quantitative imaging, and eventually switched to cell culture. During my time there, I developed the two main research directions which I have continued in my own lab – understanding the dynamics of morphogen signalling and how cells interpret them, and understanding how these signals are organised in space to generate patterns. In my lab, we are particularly interested in addressing these questions in early mammalian/human development. This is an attractive area because a lot is known about the identity of the signals that govern development during this time, and the phenotypes associated with their disruption, but much less is known about how these signals operate in space and time. I think that we know enough now to say that mammalian development works quite differently from other systems that have been dissected quantitatively – such as the Bicoid gradient in fly – and so it will be interesting to see what new mechanisms emerge. We have focused a lot of effort on understanding how the germ layers are patterned at gastrulation, and in our new study we extended these methods to a slightly later developmental time point – patterning one of those germ layers, the ectoderm.
George, how did you come to work in the Warmflash lab, and what drives your research today?
GB My previous research training involved the development of ultrasound-guided therapeutic nanoparticles functionalised to reduce necrotic and apoptotic cell death following a traumatic head injury, such as an ischemic stroke. Although our work led to significant improvements in neurological outcomes in animal models, the benefits were limited to early administration. Naturally, it was during this time that I became interested in harnessing the regenerative potential of neural progenitors to overcome the loss of functional tissue due to injury. At that time it was not clear to me what information a collection of transplanted neural progenitors needed and whether the same information could be used to repopulate neural function at any position in the brain. It was then serendipitous that I had the opportunity to join Aryeh’s lab at Rice University as a graduate student. He had developed a reductionist approach to understanding how human embryonic stem cells make fate-based decisions during gastrulation. I thought this was a powerful approach to untangling how a collection of spatiotemporally regulated signals give rise to particular arrangements of fate patterns. Although we aren’t regenerating functional brain tissue, I believe the approach and many of the principles learned can be applied to solve such problems in the future.
Before your study, how much was known about human ectodermal patterning and the extent to which studies in model organisms would translate to it?
GB & AW A great deal has been learned about how ectodermal patterning works in model organisms, but for the most part it wasn’t (and still isn’t) clear how much of this will translate to human. Most of what we knew about specifically human ectodermal development prior to the project was limited to directed differentiation protocols, which were formulated with knowledge gained from decades of experiments in model organisms. For example, the application of BMP and TGFβ inhibitors instructs the formation of neural progenitors from pluripotent stem cells, while appropriately timed BMP or WNT application can generate neural crest or placodes, respectively. So, much of the signalling appears to be conserved but there are also differences – for example, the order in which neural progenitors activate the key transcription factors SOX1 and PAX6 is different. One of the exciting things about micropatterned systems is the ability to compare species while standardising the geometry and culture conditions. However, this also requires the development of analogous systems with pluripotent cells from different species, which is a big job. This has begun to be done for gastrulation micropatterns: a system for mouse embryonic stem cells has been developed in Kat Hadjantonakis’s lab, and it would be interesting to do this for our system as well.
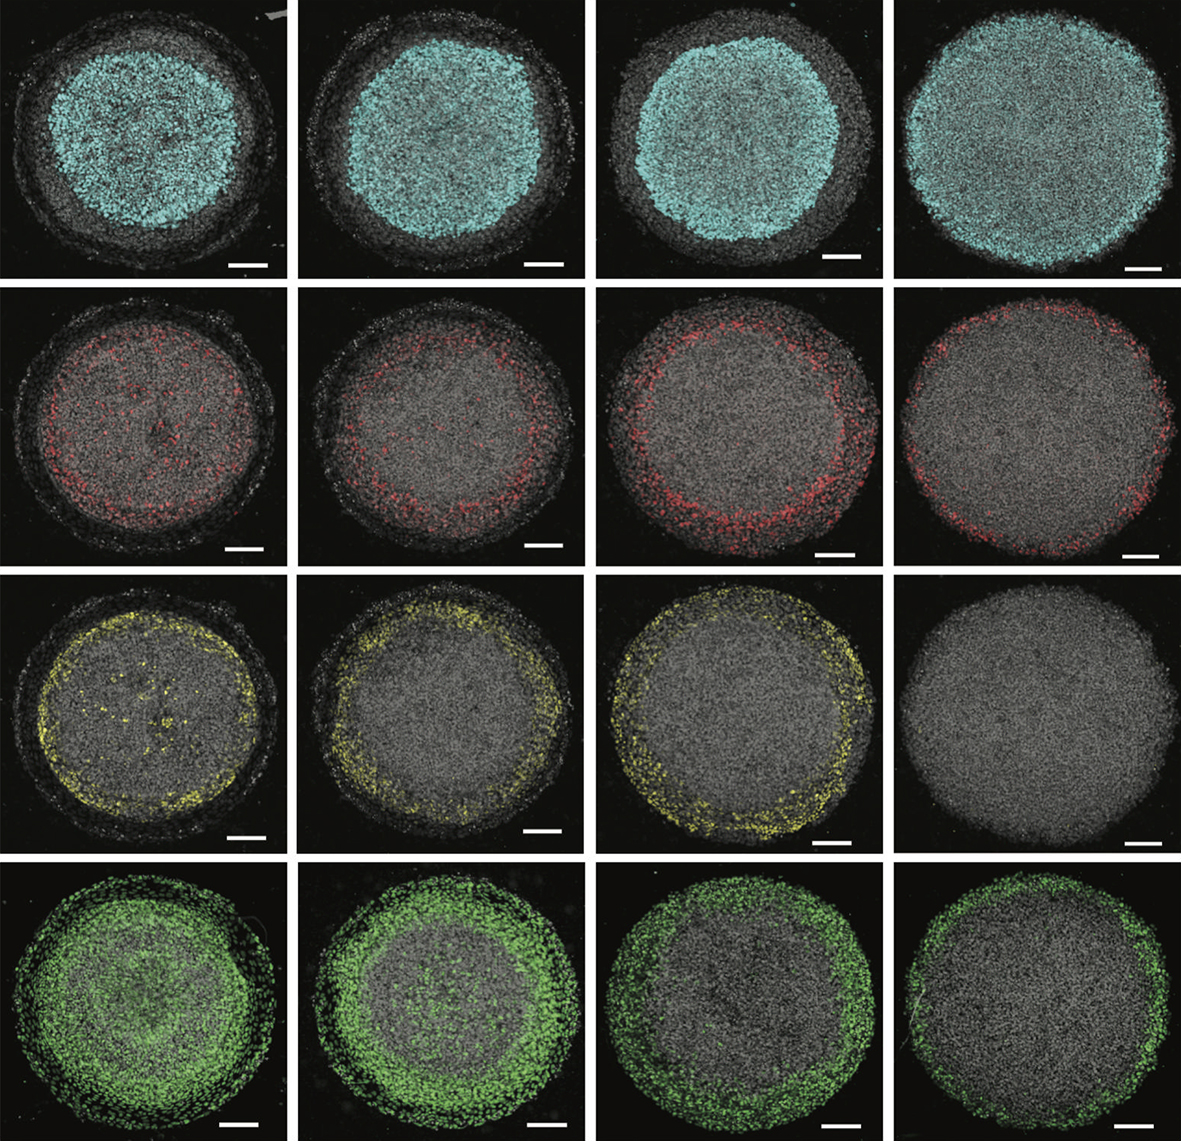
A selection of micropatterned colonies stained for different differentiation markers following a three-step ectoderm induction protocol followed by patterning with different concentrations of BMP4.
Can you give us the key results of the paper in a paragraph?
GB & AW We first mapped the competence of human embryonic stem cells to be diverted to alternative fates during ectodermal differentiation, and identified a time period when cells were primarily restricted to ectoderm but still capable of generating all ectodermal fates. We used this information to develop a platform that generates self-organised patterns of human neural, neural crest, placodal and epidermal progenitors on micropatterned surfaces with a similar organisation as found in vivo. While developing the protocol, we realised that inhibiting endogenous WNT signals was essential for limiting the extent of neural crest differentiation, which led us to identify WNT signalling duration as a crucial parameter controlling the decision between neural crest and placodes. We also showed that both BMP and WNT are involved in this decision, and that it is the relative rather than absolute levels of signalling that determines the patterns. Surprisingly, we also found that manipulating these signals during the initial ectodermal differentiation phase could influence their later competence. For example, early inhibition of BMP signals prevents cells from forming surface ectoderm in response to BMP later during patterning. Finally, we used the ease of manipulating the system to establish the necessity and sufficiency of these signals in activating particular key genes for neural plate border formation and patterning.
You find that the duration of WNT signalling can control ectodermal fates: how do you think this relates to what might be happening in the embryo?
GB & AW This is an interesting question and the answer is likely to be complex. At one level, the requirement to inhibit WNT signalling in our model probably arises because we only model one germ layer, not the interactions between germ layers. WNT inhibition in vivo has been shown to come from the visceral endoderm as well as the head mesoderm. Another role of WNT signalling is to set the coordinate along the anterior-posterior (AP) axis, and what we see is consistent with this – shortest WNT signalling yields anterior patterns with placodes and no neural crest, while the longest WNT signalling gives posterior patterns with neural crest and no placodes. Other studies within the nervous system and neural crest have shown that longer durations of WNT signalling are needed for more posterior fates. However, as WNT seems to induce neural crest specifically, it needs to do so at a particular position along the medial-lateral (ML) axis as well. So at each AP position, WNT signalling must also be controlled to give the correct ML pattern. How the AP and ML patterns are coordinated is an interesting open question.
How do you think cells measure the relative levels of WNT and BMP signalling at the molecular level?
GB & AW Another interesting question, and we are investigating two possibilities. It is possible that cells perform this calculation at the level of signalling through interactions between BMP and WNT, several of which have been described in the past. Alternatively, pathway interaction may not be required, and the computation could be performed by the downstream networks that govern cell fates. In the simplest example, if two mutually repressive transcription factors formed a toggle switch that implemented a binary cell fate decision, and one signal induced each of these transcription factors, this circuit would naturally take ratios between the transcription factor levels in making the cell fate decision. Of course, the real circuit is much more complex, but this serves to illustrate that transcriptional networks could definitely perform these computations on multiple inputs. To sort this out, we will need to measure the signalling activity through both pathways under different conditions as well as how different transcription factors interpret those levels.
When doing the research, did you have any particular result or eureka moment that has stuck with you?
GB There was definitely one instance that I will remember for a long time. In the beginning of the project I had formulated a basic micropatterning protocol (the two-step induction protocol) that generated patterns of neural, neural crest and surface ectoderm. It was nice that patterns emerged at all, but I had grown frustrated with the lack of placodal expression. Thankfully, I had a patient advisor and a great platform to scan a range of signalling perturbations. Then, one late evening in the ‘scope room I observed a beautiful ring of SIX1 expression (a placodal marker) as a result of WNT inhibition. Thinking I was alone, I jumped and danced out of excitement but soon after noticed I wasn’t alone. In my moment of celebration, the janitor had stepped into the room for cleaning but found a grad student dancing alone with no music. It was a bit embarrassing at the time, but she had a great laugh.
I jumped and danced out of excitement but soon after noticed I wasn’t alone
And what about the flipside: any moments of frustration or despair?
GB I don’t think there is a single moment that stands out. It’s natural to run into roadblocks or become frustrated when developing a project from scratch. However, one point of frustration I learned to manage was the longer time required to conduct a single experiment compared with my lab mates, as most of them were studying gastrulation stage patterning with experiments that take 1-2 days. When it was time to present at lab meetings I consistently had fewer results to share, which led to feelings of self-doubt or insufficiency as a member in the lab. Eventually, with more experience, I developed strategies to increase the throughput of my experiments, which has helped push the project in directions I didn’t expect.
So what next for you after this paper?
GB Eventually I need to graduate, but I plan to conduct single cell analysis of signalling and fate in our ectoderm patterns as a follow-up paper. Unfortunately, I am still unsure what direction I should take for a postdoc but I am actively searching.
Where will this work take the Warmflash lab?
AW We are building on this system in a few different ways. We are quite interested in directly measuring the signalling dynamics of BMP and WNT with reporters that we have previously developed and used to study signalling during germ layer patterning. We are also interested in whether we can determine the AP position at which we are achieving this patterning and in developing protocols to control it. Finally, we are interested in extending this system to three dimensions to try to recapitulate some of the morphogenesis that the ectoderm undergoes during patterning, and to be able to look at how patterning and morphogenesis are coordinated.
Finally, let’s move outside the lab – what do you like to do in your spare time in Houston?
GB Unfortunately, most of my hobbies require a mountainous landscape. However, Houston makes up for its lack of interesting topology and good weather with an awesome food scene and a consistent line-up of touring indie bands. Tickets for live shows rarely get sold out and prices are student friendly, so it usually takes minimal advanced planning.
AW I have three kids aged 12, 9 and 5 so that keeps me quite busy outside the lab. We like travelling with the kids and doing things outdoors. It is very hot in the summer here, but the weather is nice the rest of the year and there are some great state parks not too far from Houston. We also like going to the Texas Hill Country and to the beach in Galveston.
Non-coding DNA regulatory elements or enhancers control tissue and region-specific expression of critical developmental regulators thus playing a crucial role in the correct formation of the embryonic body. However, not much is known how regionalized gene expression is achieved through enhancer action. The proposed PhD project aims to address this issue using the development of the nervous system as a paradigm. During embryogenesis, the brain and the spinal cord are derived from different progenitors and this process is controlled to a large extent by the transcription factor Sox2. Sox2 expression into these two components of the nervous system is directed by two distinct enhancers, N1 in the spinal cord and N2 in the brain. This PhD project will employ brain and spinal cord progenitors derived from human pluripotent stem cells (hPSCs) in order to dissect the function of these two enhancers. Using hPSC differentiation in combination with a variety of techniques including ChiP-seq and CRISPR/Cas9 approaches we aim to:
1) define the molecular hallmarks that may distinguish the N1 and N2 enhancers
2) examine the differential binding of candidate transcription factors on these enhancers
3) identify critical sequence parameters influencing their function.
Funding Notes
– a tax-free stipend at the standard Research Council rate (~£15,009, to be confirmed for 2020) for 4 years
– tuition fees at the UK/EU rate for 4 years.
– research costs
Required qualifications
At least a 2:1 honours degree in a relevant subject or equivalent. The interdisciplinary nature of this programme means that we welcome applications from students with backgrounds in any biological, chemical, and/or physical science, students with mathematical backgrounds who are interested in using their skills in addressing biological questions.
Studentships are available to UK and EU students who meet the UK residency requirements. Further information on eligibility: View Website.
Deadline: Monday, January 06, 2020
For informal enquiries contact: a.tsakiridis@sheffield.ac.uk
Summary: Plant shape is a primary determinant of productivity and yield because it affects light interception and photosynthesis. As plant cells are bound by a cell wall and cannot move, shape arises as an outcome of the plane of new cell divisions, and subsequent cell growth. Flowering plant models such as Arabidopsis have complex tissue organizations that can mask cell division plane defects. There are also many genes per gene family, which can make it hard to identify mutants. For these reasons, few genetic regulators of cell division plane orientation have been discovered. In contrast to flowering plants, mosses have simple tissue organizations and there are few genes per gene family. I established a moss model to study plant cell division plane orientation [1], and recently determined that the CLAVATA receptor-like kinase sets the plane of cell divisions [2, 3]. Although mosses are distantly related to flowering plants, our findings were transferable to Arabidopsis, and we are now manipulating CLAVATA function in wheat to improve productivity [4]. Harnessing the benefits of the moss model, this project aims to discover how CLAVATA determines the plane of cell divisions in plants to affect their overall shape and productivity.
To determine how CLAVATA orients division planes in moss the project will:
1. Identify downstream targets of CLAVATA by RNAseq and bioinformatic analysis
2. Generate mutants of a candidate target and analyse mutant phenotypes
3. Analyse gene regulatory network architecture using computational approaches
4. Identify novel cell division plane regulators using a suppressor screen.
Training: By combining computational and wet lab approaches, the project will provide training at the cutting edge of the plant development field. It will benefit from further formal teaching and internships included in the SWBioDTP programme. The skills and techniques the student will learn will be broadly applicable in the academic biology and biotech sectors and widely transferable amongst areas such as science policy, publishing and computing.
Funding Notes
A fully-funded four year SWBio DTP studentship will cover:
– a stipend* (at the standard UKRI rate; £15,009 per annum for 2019-2020)
– research and training costs
– tuition fees (at the standard UKRI rate)
– additional funds to support fieldwork, conferences and a 3-month internship
References
[1] Harrison et al. 2009. Local cues and asymmetric cell divisions underpin body plan transitions in the moss Physcomitrella patens. Current Biology 19: 1-11.
[2] Whitewoods et al. 2018. CLAVATA was a genetic novelty for the morphological innovation of 3D growth in land plants. Current Biology 28: 2365-2376.
[3] Bergmann 2018. Taking development to three dimensions. Developmental Cell 17: 678-679.
[4] Fletcher 2018. The CLV-WUS stem cell signaling pathway: a roadmap to crop yield optimization. Plants 7: 87.

 (4 votes)

 (No Ratings Yet)