The community site for and by
developmental and stem cell biologists

On the scaling of the skeletal system

Posted by , on 28 October 2015

By Tomer Stern, the skeletal development laboratory of Prof. Elazar Zelzer, Department of Molecular Genetics, Weizmann Institute of Science, Israel.


Proper shape-size relation is essential for the function of all organs and organisms. Thus, one of the key challenges shared by developing organs is the adjustment of physical dimensions to the massively growing body, known as scaling. There are two basic modes of scaling: isometric, in which the physical proportions are maintained throughout growth, and allometric, in which the proportions undergo changes. A well-known example for the latter is the change in relative size of the human head from early infancy to adulthood. Despite the fundamental importance of this phenomenon, our understanding of the mechanisms underlying scaling is surprisingly limited.


The question

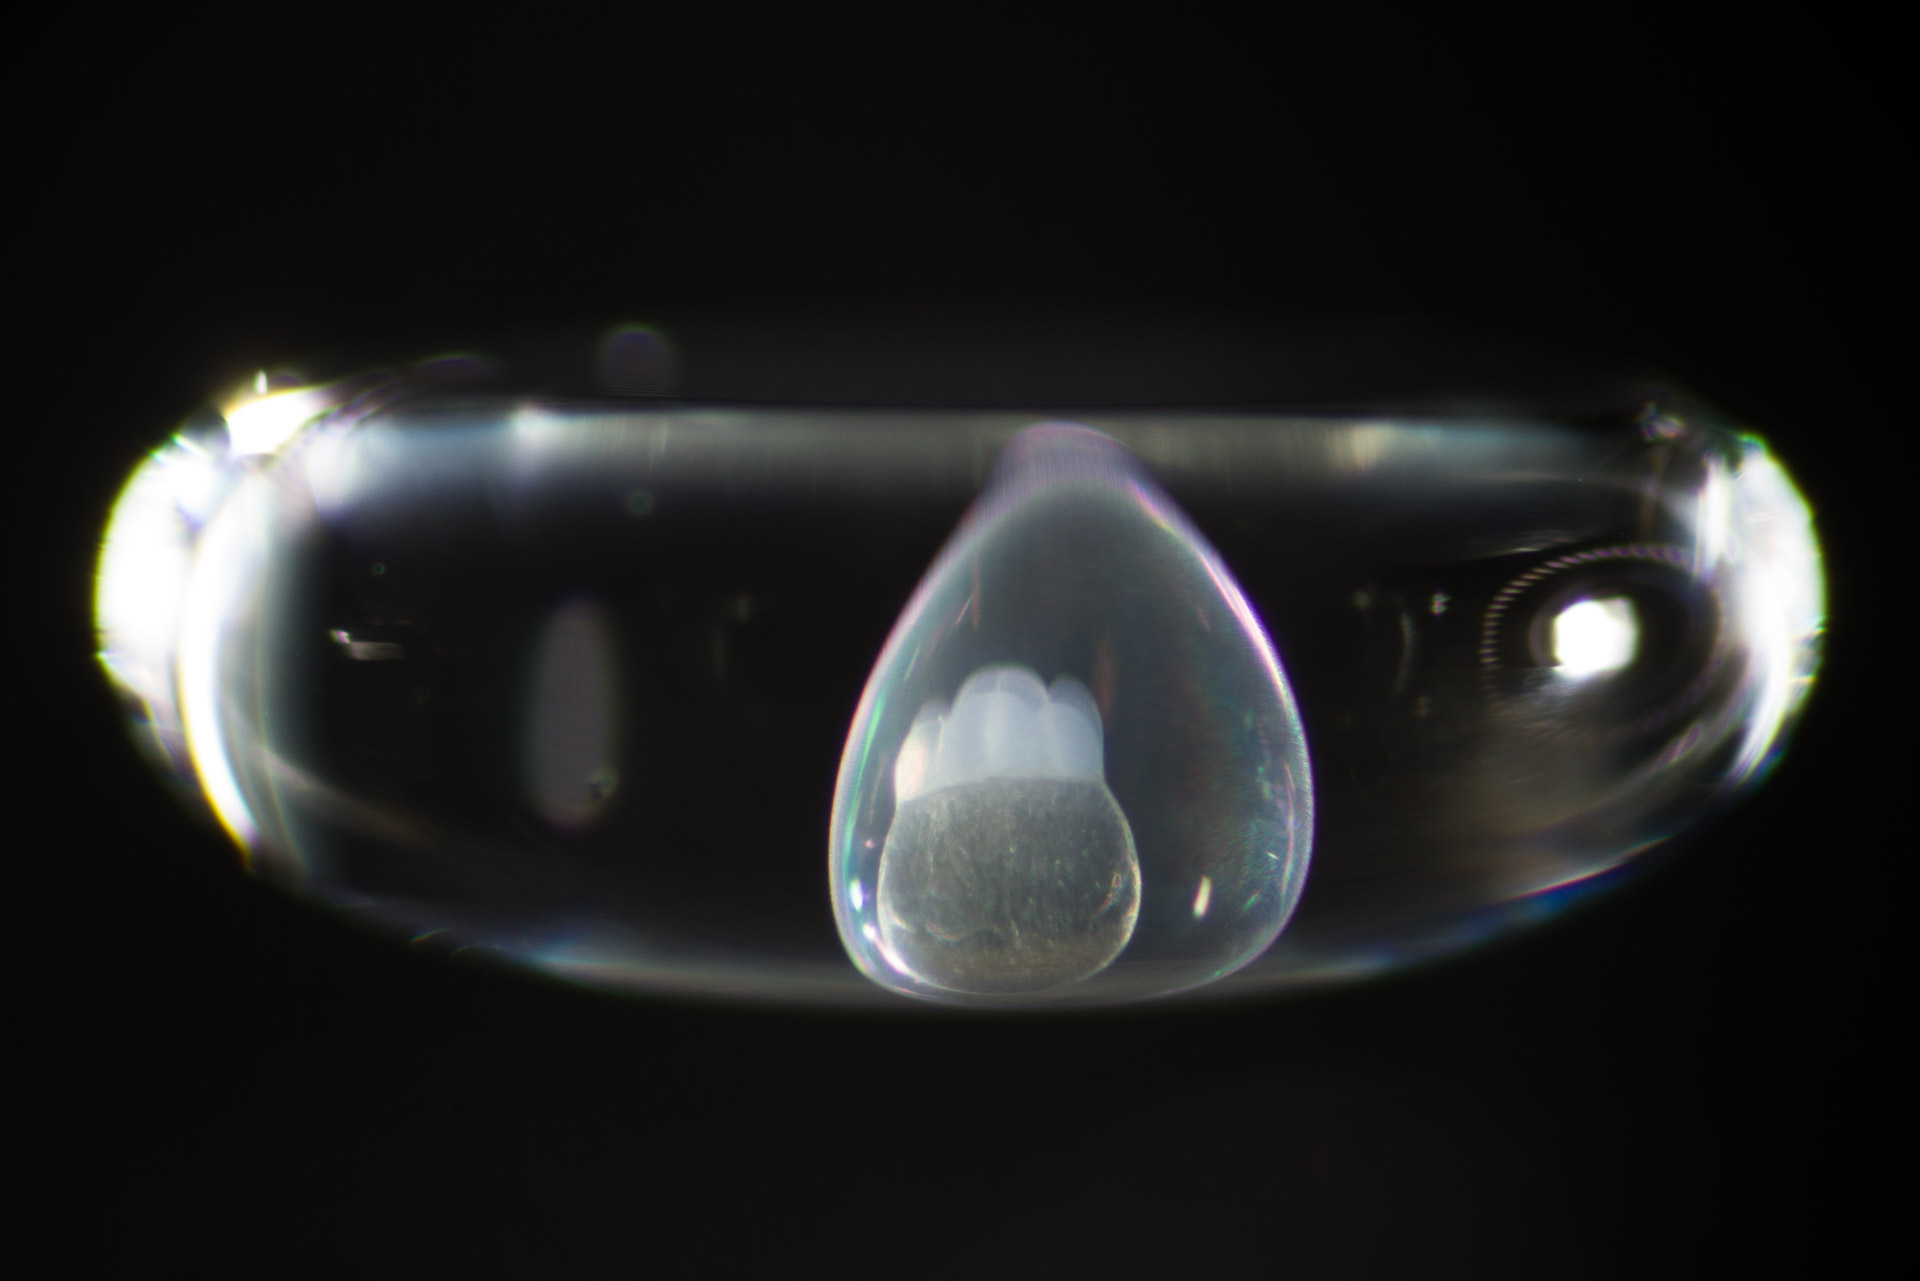
In a Walt Disney cartoon, bones are typically depicted as smooth cylinders with a round joint popping at each end. However, it only takes a quick glance at a 3D micro-CT image of a bone to realize how complex and unique the morphology of each bone is. Much of this complexity is due to the existence of various asymmetrical protrusions located at specific positions along the bone, which allow the attachment of muscles and the formation of complex joint structures. As such, the specific position of these protrusions directly dictates the ability of the organism to control the movement of the bone while chasing prey or escaping from predators, as well as the mechanical efficiency of movement. Thus, any inaccuracy in the positioning of protrusions during development is likely to significantly compromise motility. Interestingly, although the average bone elongates by more than 5 times during development, its protrusions constantly remain in the same relative positions, to say, long bones scale isometrically. However, since bones are rigid organs that elongate only from their ends, the question is: How is the relative position of each protrusion between the two ends maintained during growth?


The answer

Our starting point for addressing this question was a prevalent hypothesis proposed more than 60 years ago. In an iconic work, Nigel Bateman1 argued that bone protrusions continuously drift along the bone, as they are destroyed and rebuilt by bone-absorbing and bone-depositing cells. As this hypothesis offered a straightforward mechanism for regulation of the longitudinal position of protrusions, we saw it as an elegant way to explain how long bones scale isometrically. Filled with scientifically inappropriate optimism, we were on the direct track to solving our enigma!

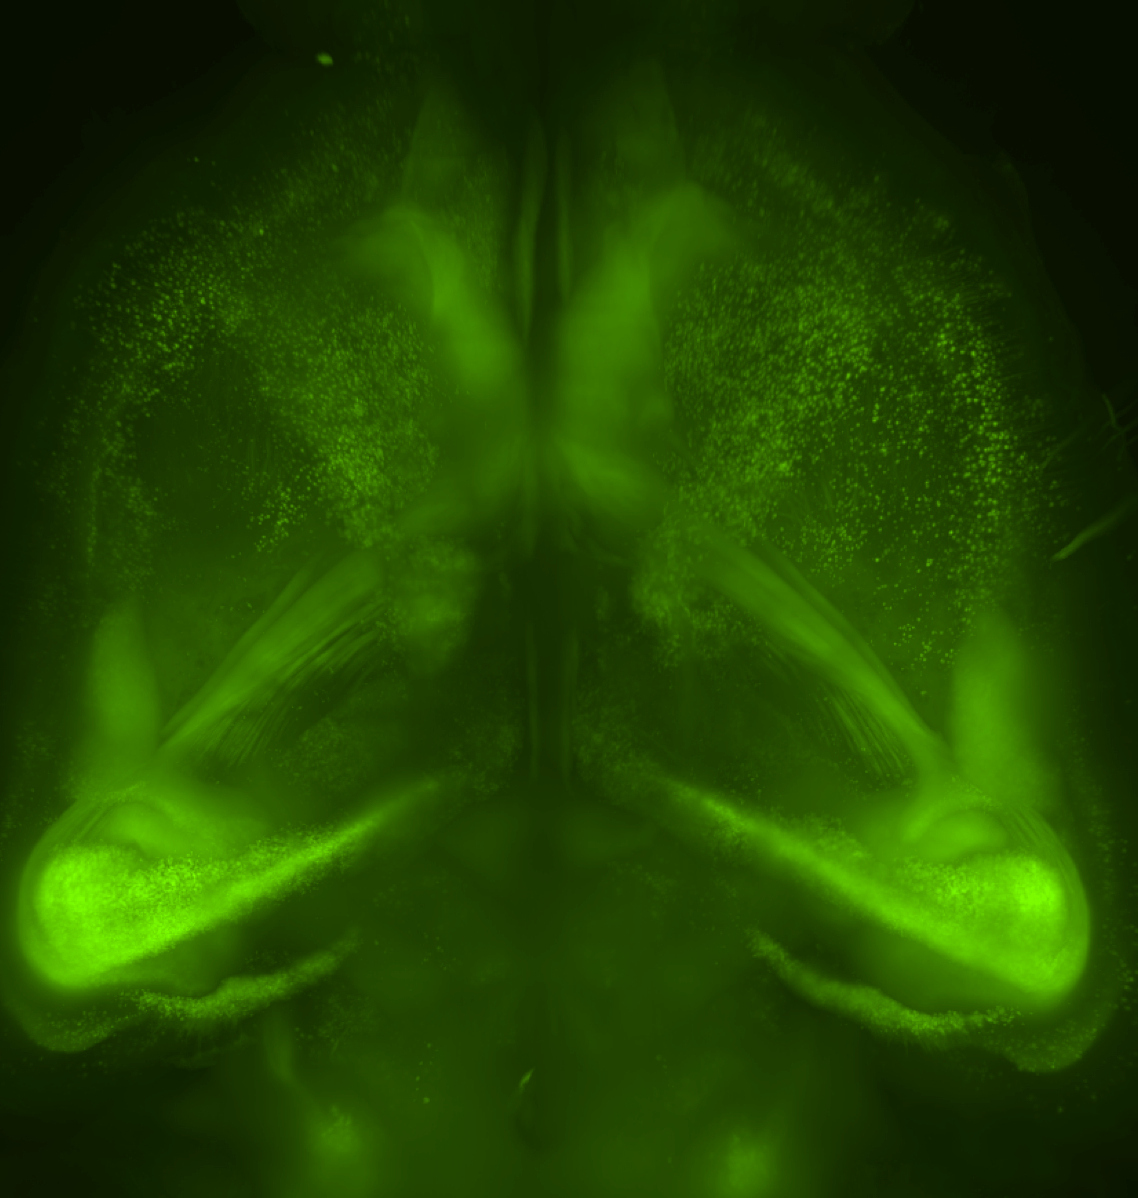
To do so, we generated a massive database of 200 three-dimensional micro-CT images of long bones, ranging from early developmental stages to adulthood. Then, to allow proper comparison between the morphologies of all bones, we developed an automated computer algorithm that accurately aligns all imaged bones to one another. Lastly, we documented the exact physical position of each protrusion in each bone at each time point. Under these settings, any change in the position of a protrusion over time would indicate that it has undergone drift, as predicted by Bateman’s hypothesis. Yet, to our surprise, most protrusions drifted very little if at all. Rather, bone shape was maintained by a completely different mechanism.


The right answer

As mentioned, the rigid bones elongate solely from their ends. The driving force behind elongation is a thin layer of cartilage called the growth plate, which is composed of chondrocytes that undergo a well-defined differentiation program resulting in their replacement by ossified tissue. Without prior knowledge, it would be reasonable to assume that the rate at which each growth plate lengthens the bone is the same at both ends. However, the interesting fact is that each of the hundreds of growth plates in our body has a unique growth rate. The first indications for this variability have been provided almost 300 year ago. However, the developmental rationale behind it and the biological code that determines the specific activity rate of each growth plate have remained open key questions in the field of skeletal biology.

Our finding that the relative positions of protrusions are kept throughout development without drifting has led us to hypothesize that the balance between the rates of growth at the two bone ends may be the mechanism that underlies isometric scaling. This may happen if when a protrusion is much closer to one end of the bone, that end will grow more slowly, while the opposite end will grow more quickly. In this manner, no matter how much the bone increases in size, the protrusion will always maintain its relative location. Such a growth ratio-based mechanism would render drifting unnecessary. To test this hypothesis, we constructed a mathematical model for the relation between the balance of the growth rates and the relative position of protrusions. When we fed the model with real growth data, it predicted the positions of non-drifting protrusions and the rate at which drifting protrusions moved with striking accuracy, thus providing strong support to our hypothesis. Lastly, through additional mathematical analyses, we showed that the newly discovered mechanism also minimizes the total drift activity of each bone during development. As the mineral deposition and absorption that occur during drift are assumed to be highly energy consuming, this finding suggests that the mechanism we have discovered follows the energetically optimal path for achieving the challenging goal of isometric scaling of developing bones.


For the full article: “Isometric scaling in developing bones is achieved by an optimal epiphyseal growth balance” 2, and for a synopsis of the article: “Make no bones about it: Long bones scale isometrically” 3.

  1. Bateman, N. Bone growth: a study of the grey-lethal and microphthalmic mutants of the mouse. J Anat 88, 212-262 (1954).
  2. Stern, T. et al. Isometric Scaling in Developing Long Bones Is Achieved by an Optimal Epiphyseal Growth Balance. PLoS Biol 13, e1002212, doi:10.1371/journal.pbio.1002212 (2015).
  3. Sedwick, C. Make No Bones about It: Long Bones Scale Isometrically. PLoS Biol 13, e1002211 (2015).
Thumbs up (5 votes)
Loading...

Tags: ,
Categories: Research

Navigate the archive

Use our Advanced Search tool to search and filter posts by date, category, tags and authors.

New intern at the Node!

Posted by , on 27 October 2015

Hello readers of the Node!

IMG_0688My name is Helena, and for the next few months I’ll be helping to run the Node, while Cat concentrates on other projects to make the Node even better! I am Spanish, but I moved to the UK five years ago to study Biochemistry. I am currently doing my PhD in Alfonso Martinez Arias’ lab at the Department of Genetics in Cambridge: I use mouse embryonic stem cells to study patterning in the embryo, and to try and elucidate how different signalling molecules coordinate this patterning during gastrulation. My PhD programme (the BBSRC DTP in Cambridge) includes a PIPS (Professional Internship for PhD Students, you can see some discussion on these internships here), and this is how I came to the Node.

Although I trained as a biochemist, my passion is in developmental biology. While I find work at the bench (or in the hood) incredibly fulfilling, I also love discussing science. A good conversation about science can be inspiring, eye-opening, but most of all, great fun. Good science becomes even better when it’s well communicated, and part of my reason for doing my PIPS at the Node was the opportunity to help a community exchange views, opinions and news about a field I really enjoy. I want to help the community grow and keep sharing research at the very highest level, so please keep posting and getting in touch with any suggestions and comments!

Thumbs up (8 votes)
Loading...

Categories: News

A day in the life of a siphonophore lab

Posted by , on 27 October 2015

I’m Cat Munro, a third year PhD Candidate in Casey Dunn’s lab at Brown University. The Dunn lab has an even split of lab members that work on the evolution, development, and systematics of siphonophores, and members that focus on building tools and phylogenetic methods, with an eye to understanding the relationships at the base of the animal tree.


So what are siphonophores, and why would anyone study them?


Siphonophores

Siphonophores are cnidarians, more specifically, they are found within the clade Hydrozoa. Like many other hydrozoans they are colonial, reproducing asexually to produce a colony of clonal, physiologically integrated, and physically attached bodies. However they have such a high degree of physiological integration that we consider each of these ‘bodies’ (termed zooids) to be homologous to a solitary, free living individual (think of a solitary polyp, like Hydra or Nematostella). Each of these zooids is also functionally specialized, and show a division of labour – some zooids are specialized for locomotion, others for feeding, reproducing, digesting, protecting and so on. As a lab, we study siphonophores in order to understand the evolution of this type of functional specialization.

This siphonophore species is found locally off the coast of Rhode Island. Siphonophores consist of a gas filled float (top left), swimming bodies (directly below the float), and a series of feeding, defensive, digestive and reproductive bodies (arranged on the stem below the swimming bodies). Photo credit: C. Munro


There is a sexual phase in the life cycle, where fertilized eggs develop into a primary feeding zooid with a gas-filled float, that subsequently forms two growth zones (in some species there is only one). The growth zones are the site of asexual budding. In most species the zooids are produced from a single probud, that subdivides further to form various zooid types along the stem. The zooid types are always produced in the same reiterated sequence. What’s great about this form of development is that we have access to an entire ontogenetic sequence along the stem of the colony, with the oldest zooid at one end and the youngest probud at the other end in the growth zone. Additionally, because the organization is highly organised and predictable, we always know the zooid identity of each bud in the growth zone.   

The lifecycle of the siphonophore Nanomia bijuga. From fertilized egg, to planula, to a siphonula larva with a primary feeding polyp, tentacle and gas filled float. Finally a fully formed "polygastric" siphonophore. Credit: FreyaGoetz, wikimedia
The lifecycle of the siphonophore Nanomia bijuga. From fertilized egg, to planula, to a siphonula larva with a primary feeding polyp, tentacle and gas filled float. Finally a fully formed “polygastric” siphonophore. Credit: FreyaGoetz, wikimedia


A typical (field) day

A typical day in a siphonophore lab might include time at the bench working up samples for sequencing or time at the computer working on data analysis. We also spend time on the microscope working with fixed and stained samples. However, these late Summer/Fall field days provide us with hundreds of samples that last for months until we get back out to the field in the spring and summer.


0430: The alarm clock rings. After a few minutes feeling disorientated by the early wake up, I remember – it’s dive day. I get up, throw on my swimsuit and clothes, and make a quick breakfast.


0500: Just before heading out the door, I check the marine weather forecast. We check the weather a lot in the days before a field day. If the wind is blowing faster than ~25 knots and wave height is higher than 5 ft/1.5 m, then it becomes harder (and even dangerous) to get in the water and collect specimens. The seas were rough the past few days, but the weather looks good, so I jump in my car.


0630: I arrive at Point View Marina, South Kingston, Rhode Island. The sun is rising, and a few fishermen are already starting up the engines of their boats, coffee in hand, to start a day of fishing. The dock poles here are adorned with billfish bills and tails from other successful fishing expeditions.


Along with the rest of the lab, we empty the truck and load up the boat with our equipment (coolers with plastic collecting jars; buckets and a plankton net; dive gear and tanks).

Early morning at the marina. Photo: C. Munro


0700: The Captain gets the engine going and we leave the dock. The boat slowly makes its way out into Point Judith Pond, a well sheltered body of water that opens out into Block Island Sound. To our right, we pass sleepy vacation homes, some still occupied by a few holdouts at the end of summer; and to our left, a large fishing vessel is docked in the port of Galilee, where among a flurry of seabirds, fishermen are already unloading the day’s catch.


As we leave the relative calm of Point Judith Pond, the waves are higher and the boat speeds up. We settle into our seats, we have a few hours until we reach our destination.


~0900: The engine cuts. The captain has been waiting for the waters to get bluer, and perhaps also some indication of a scattering layer in the sonar. We check the water to see if we can see any gelatinous organisms below.


All the divers start to gear up, and in the meantime our other lab members fill the collection jars. The jars are prefilled with seawater, without any bubbles, so that there aren’t any issues with the pressure at depth crushing them or making them hard to open. They are loaded into mesh bags that the divers can clip on to their buoyancy control device (BCD).


0930: We get into the water. The type of diving we do is called blue-water diving which, due to some of the unique issues related to diving in the open ocean with no seafloor in sight, requires special procedures. We need a constant connection to the boat, and so we use a slightly weighted ‘down line’ that connects to a buoy and then to the boat. Each of the divers are connected to their own tethers that are attached to a loop of metal called the trapeze. The trapeze can be clipped onto the down line at any depth, and each of the divers can then spread out to collect our specimens. One diver is the ‘safety diver’ and stays near the trapeze and the down line and keeps an eye on all of the divers.  


Blue water diving is unlike any other diving experience. Without the seafloor as a frame of reference, it can be quite disorientating, and it is possible to shift depths quite rapidly (this is part of the reason for the tether system). On a sunny day, when you look down, you can see shafts of sunlight that extend down and gradually fade into a dark blue. Sometimes there are Sapphirina copepods below us that flicker back blue light from their skin as they move; against the background of the darker deep water they look like shimmering stars. It’s beautiful, but unless you’re the safety diver, you don’t have much time to take it in. We’re on a mission to spot and catch siphonophores, and today it isn’t hard – they’re all around us, alongside several species of ctenophore, various hydromedusae, and pteropods. It’s a gelatinous soup.


Catching siphonophores can be hard. They are largely transparent, and in very clear waters you often need to angle your head to catch the right angle of light, or use the dark suits of your fellow divers for contrast. We catch our specimens by opening the lids of the jars and gently swirling the animal into the jar. Sometimes before you collect, you have to poke them gently so that they retract all their tentacles.

Ready to collect samples on the dive with a jar and collection bag in hand. Photo credit: A. Damian Serrano


1030: The dive is over. We’ve gradually made our way up the down line from 60ft, and once our air reaches 500 PSI, we take a safety stop and ascend. Usually the limit is not air, but the number of jars, and by the end of the dive we are checking our samples and evaluating whether it is worth abandoning one sample and collecting a particular species. Back on the boat, we check our haul. Based on numbers, we reassess which species we should collect on the next dive. The jars are loaded into the coolers with some ice packs to keep them cool, and more jars are filled with seawater for the next dive.


1100: We get back in the water and descend to 60ft. Sometimes we find that even though we are roughly in the same location, the patch of water can change slightly, and we see slightly different species assemblages to the last dive. Sometimes even within a single dive, if there is a reasonable current, we can see very different species throughout the dive.


1200: We finish up the dive and get back on the boat. We load up the last of our samples, grab a few carboys of water from the site, quickly change out of our wetsuits, and pull the lines out of the water. Within 30 minutes or so, the captain fires up the engine and we head back towards the marina. Generally we are exhausted after the dives, so we eat our packed lunches and fall into a deep sleep until the boat pulls back into the dock.


1500: The boat is back in the dock and it’s time to unload. Everyone has just woken up from their naps, so we stop for a quick coffee on our way back to lab.


On the boat getting ready to go out. Photo: C. Munro


1600: Back in the lab, we do our final counts of different species and transfer our samples into the incubator. We need to work out the fate of each of the samples for various projects: some of the samples are frozen for phylogenetics, differential gene expression studies, and also fixed and stored for in situs and immunostaining. Most of the samples need to be processed the next day, but others need to be processed right away.


Along with a fellow grad student, I spend a few more hours in the lab processing samples for various projects.


2200: Finally home! Once I rinse off all of my dive equipment, I can finally shower and clamber into bed. I’ll sleep well, but not for too long – there are more samples waiting to be processed in the morning.


Node day in the life new doodle squareThis post is part of a series on a day in the life of developmental biology labs working on different model organisms. You can read the introduction to the series here and read other posts in this series here.


Thumbs up (10 votes)
Loading...

Tags: ,
Categories: Lab Life

On a quest to understand what has made us human – A special edition of The Biochemist

Posted by , on 27 October 2015

As developmental biologists, we are fascinated by the ability of an organism to become, from a single fertilised egg, a fully functional individual. However, as human beings we are equally curious about how the Homo sapiens species arose and became different to all other animals on the planet. As a group of students from the Centre for Developmental Neurobiology at King’s College London we won the opportunity to explore this issue in depth as guest commissioners and editors for The Biochemist magazine.

In this special issue, published this month, arguably the place to start was in the oceans around 3.5 billion years ago: Nick Lane, the author of bestselling science books including “Life Ascending” and “Power, sex, suicide” explored how the first living cells formed multicellular organisms and why energy is the driving force of evolution.

Of course, we wouldn’t be who we are without our brains! Learn about how the first neuronal proteins and structures evolved 500 million years ago from Dwayne Godwin and Melissa Masicampo in our second article.

Continuing in the exploration of the nervous system, Maria Martínez-Martínez and Víctor Borrell look at the size of the cortex as the core of human uniqueness.

The brain is not, however, the only thing that makes us different to other animals. The way we digest food, especially lactose, is also uniquely important for understanding our evolutionary history. Read the wonderful article by Dallas Swallow to find out more about how our ability to digest milk has made us who we are today.

All the information we possess about our evolutionary history and the genes that make us human awaits a tremendous boost of detailed new data that can be gathered from the now available genomic databases. Rebecca Lowdon and Devjanee Swain-Lenz look at the ENCODE project and assess how it can help us understand our past, but also allow us to shape our own future as a species.

To put it all in context, read a succinct introduction written by members of our team: Rebecca McIntosh and Danielle Stevenson with a handy timeline drawn by Tristan Varela.

We have had great fun commissioning the articles and thank all our contributors. We are confident you will find the issue stimulating and fascinating and hope that it will help you on your own quest to understand what has made you human.

The whole issue can also be read here:  http://www.biochemistry.org/374/375/index.html

This post was written by Michalina Hanzel

Thumbs up (1 votes)
Loading...

Categories: Outreach, Societies

Tenure track positions as Assistant Professor

Posted by , on 27 October 2015

Closing Date: 15 March 2021

Tenure track positions as Assistant Professor within the Wallenberg Centre for Molecular Medicine at Umeå University, Sweden.

Deadline 1st of December 2015

The Wallenberg Centre for Molecular Medicine (WCMM) at Umeå University, Sweden, has been established as part of a national agenda with the goal of regaining a leading position for Sweden within medical research. The Centre is a collaboration between Knut and Alice Wallenberg’s Foundation, Umeå University, Västerbotten County Council, the Kempe Foundations and the Cancer Foundation for Northern Sweden. In this call, the Centre is looking for up to four outstanding researchers, to be positioned within one or more of the following areas of molecular medicine: cancer, infection biology, metabolism/diabetes or neuroscience. The positions are provided with a generous support package including funding for Postdoctoral Associates and PhD Student recruitments. The successful candidates will be working in strong internationally recognized research environments and have access to excellent local and national research infrastructures including unique collections of longitudinal samples in existing biobanks.

Work description
The successful candidates will be working in close in close proximity to established research groups within one or more of the focus areas of cancer, infection biology, metabolic disorders including diabetes or neuroscience. The candidates are expected to initiate and maintain a strong research program complementing on-going research within molecular medicine at Umeå University, Sweden, and to take active part in collaborative research opportunities and exchange programs within the new network of WCMM centres at other universities in Sweden.

The successful candidates will primarily be conducting research. Up to 20% of the employment can be devoted to teaching so that the criteria for promotion to a tenure position as Senior Lecturer/Associate Professor (Universitetslektor) can be fulfilled within four years.

Qualifications
To be eligible for the positions, candidates must have a PhD degree, completed no more than seven years prior to the deadline for application. A candidate who has completed their degree prior to this time could be given equal priority if special circumstances exist. Special circumstances include absence due to illness, parental leave or clinical employment, appointment of trust in trade union organizations or similar circumstances. We are seeking outstanding candidates with documented excellent research in fields relevant to molecular medicine. The candidate must have appropriate postdoctoral training outside the university at which the PhD was defended.

More about the position
The position will be provided with a generous support package including funding for Postdoctoral Associates and PhD Students as well as substantial support for running costs. To qualify for promotion, the candidates are expected to complement the funding with their own national and/or international grants. The researcher will work within one or more of the 13 departments of the Faculty of Medicine. The Department in which the candidate formally will be employed will be decided in consultation between the applicant and the faculty. An individual scientific and educational development plan will be formulated upon agreement between the applicant and the Head of Department at which the applicant will be employed. One pedagogical and two scientific mentors will be appointed to support the career of the candidate.

YOU FIND MORE INFORMATION ABOUT THE POSITIONS AND HOW TO APPLY:

https://umu.mynetworkglobal.com/en/what:job/jobID:76903/


Umeå University, Sweden are looking forward your applications!

Thumbs up (No Ratings Yet)
Loading...

Categories: Jobs

The Story Behind the Campaign to Put a Woman of Science on the $10 Bill

Posted by , on 26 October 2015


Originally posted to the blog Genes to Genomes, reposed with permission.


Don Gibson (University of California, Davis) describes how he decided to start the Barbara on the Bill Campaign

Mock Up of a Barbara McClintock $10 Bill

When I heard that the U.S. Department of the Treasury announced that a woman will be on the $10 bill, I started reading several articles about which woman it should be. I was shocked that so few women of science were being mentioned. I thought we, as scientists, should fix this. One woman kept coming to mind. This woman revolutionized genetics & biology, suffered harsh discrimination during her career, and remains the only woman to single-handedly win a Nobel Prize in life science: Barbara McClintock.

This idea started back in February when I saw Neil deGrasse Tyson give a public talk. He showed currency from nations around world. Many countries had their great scientists and discoveries on their coins and paper bills. While America’s money had only one theme: old, white, male politicians. He inspired me to think about national values, and there is no place more prominent for a national value then a nation’s currency.

America may be the leader in science today, but if it does not value science, other nations may surpass this country in the future. Having a woman of science on our currency could be a turning point in the way Americans view science. It could also highlight the success of real scientists who face injustice. McClintock was held back from permanent positions multiple times in her career because of her gender. She was able to succeed despite these set-backs through hard work, eventually designing ground-breaking genetics experiments in a lab of her own. Even today, challenges as a result of gender discrimination still exist; only one in four jobs in STEM is held by a woman.

Surprisingly, when I asked fellow graduate students in science fields to name a historical American woman scientist, they were often at a loss.

“I was shocked when I realized I couldn’t name any other female American scientists from history, ” said fellow geneticist Anastasia Bodnar, Policy Director at Biology Fortified, a science education and advocacy non-profit organization.

Several of my mentors are amazing women scientists. I am a firm believer that they need to be more recognized for their contributions to science. McClintock’s contributions were prolific and I see advocating for her to be on the $10 bill as a great way to give back to the female mentors I have had.

I know that a number of scientists, including McClintock, do not seek fame. Many other great women are also being advocated for the $10 bill, but as scientists we need to advocate for ourselves in public spaces for our contributions to be widely recognized. Whether or not Barbara McClintock is selected, I consider this effort a success, if this project increases the dialogue surrounding women in science.

The campaign is seeking public support though barbaraonthebill.com, and the Department of the Treasure is taking public feedback. You can also comment via Facebook and Twitter using the hashtag #TheNew10.


Thumbs up (4 votes)
Loading...

Categories: Outreach

Fly like a fish?

Posted by , on 26 October 2015

Zebrafish is a common model organism in many fields of science. The study by Sundvik et al. 2015 in Scientific Reports tests the safety of acoustic levitation of an intact organism using zebrafish embryos (Figure 1). Acoustic levitation has over the last few decades been developed to provide a wall- and contactless environment to transfer and manipulate small objects, more recently cells and even entire organisms. This method has great potential that could be useful also outside physics labs. A zebrafish in a levitator encounters sound levels comparable to those next to a screaming jet engine, but the sound is still inaudible to humans. From a developmental point of view it is interesting to note that the developing zebrafish are insensitive to the harsh conditions in the levitator. The fish develops normally in the apparently gravitation-free space, in the node of the sound waves, when sonified for a short time between one and 12 hours after fertilization. It is unknown whether levitation at even later time points after fertilization affects the fish development. We found that fish do die if the water surrounding the embryo evaporates. A controllable microclimate around the levitator could permit investigating whether longer levitation periods affect the development and patterning of tissues and organs in the levitated fish. Such a setup would permit levitating the zebrafish for days, potentially without liquid immersion for some developmental stages. This study is a beginning and only imagination restricts the possibilities of this approach.

Figure 1. A levitating zebrafish embryo inside an ellipsoidal water droplet. Photography: Mr Eetu Lampsijärvi

Thumbs up (2 votes)
Loading...

Tags:
Categories: Research, Resources

Viewing less to see more

Posted by , on 23 October 2015

Dimitri Perrin3, Shimpei I. Kubota1,2, Kazuki Tainaka1,2 & Hiroki R. Ueda1,2,4*

1Department of Systems Pharmacology, The University of Tokyo, Tokyo, Japan.

2CREST, Japan Science and Technology Agency, Saitama, Japan.

3School of Electrical Engineering and Computer Science, Science and Engineering Faculty, Queensland University of Technology, Brisbane, Australia.

4Laboratory for Synthetic Biology, RIKEN Quantitative Biology Center, Osaka, Japan.

Correspondence should be addressed to H.R.U. (uedah-tky@umin.ac.jp, Tel: +81-3-5841-3415, Fax: +81-3-5841-3418)


CUBIC-treated mouse brain
Fig.1: Thy1-YFP-H Tg brain, cleared with CUBIC reagents and imaged using Macrozoom Light-sheet Fluorescence Microscopy


The brain is an organ like no other, in part because of its function. It has been recognised as the location of imagination, memory, thought and sensation since Claudius Galenus, but details about its structure only start to emerge in the late 17th century. Thomas Willis proposes the concept of a regionalisation of brain activities and Antonie van Leeuwenhoek’s work on microscopy reveals that nerves are not hollow conduits for ‘animal spirits’.

While further advances (such as Luigi Galvani on the role of electricity in the nervous system) move 18th century scientists closer to understanding the brain, the mystic surrounding the organ remains after Matthias Jakob Schleiden and Theodor Schwann propose their cell theory. All organs follow the three tenets that all living organisms are composed of one or more cells, the cell is the most basic unit of life, and all cells arise from pre-existing, living cells. All organs, except the brain. Dyes used to reveal the cellular structures of tissues only show a dense and entangled network of fibres.  No cells are visible in the brain.

Fifty years later, Santiago Ramón y Cajal starts using Camillo Golgi’s reazione nera, which has the distinct advantage of staining a limited number of cells at random and in their entirety. Fine details can, finally, be observed. Ramón y Cajal pushes forward the idea of a modular brain and cells as emitter/receptor. By viewing less, the method allows to see more.

While EEG, implants and fMRI now allow measurements of group cells or indirect observation of overall activity patterns, light diffraction due to lipids means that brains cannot be directly imaged. Slicing is still used, and requires time-consuming and error-prone computational reconstruction of the whole organ.

Tissue clearing, by contrast, removes these lipids and finally allows high-resolution whole-brain imaging, therefore preserving important structures. It is a crucial step, and it is fitting that Karl Deisseroth and his team show a transparent brain sitting over a Ramón y Cajal quote in their 2013 article on CLARITY. By viewing less, we can see more, but seeing is only the beginning.

Learning, memory, behaviour and all other cognitive functions emerge from structure and cell-to-cell interactions, making understanding cellular circuits in the brain essential to advances in Neuroscience. Coupled with key technologies such CRISPR/Cas-mediated genetic engineering, tissue clearing has the potential to have for this field the impact that microarrays had on Genetics.

This requires two properties: (i) tissue clearing must be safe, rapid, efficient and easily reproducible, (ii) computational tools must be developed to analyse these new high-resolution 3D images. Our method, CUBIC, has been developed to address these needs.


Protocol overview
Fig.2: Overview of the CUBIC protocol, reproduced from our recent Nature Protocols article [4]


Our new aminoalcohol-based clearing cocktails have no safety concerns and preserve signals from fluorescence proteins. Whole-brain clearing can be achieved by immersing a whole brain in CUBIC reagents for two weeks. In our 2014 Cell article, we showed this protocol is also applicable to a marmoset brain, which is a model animal closer to the human.

For the biologist end-user, imaging the cleared sample is a largely automated process. Our vision is to make the analysis as straightforward, with information about the experimental setup enough to identify the anatomical brain regions where changes in expression occur (and estimate the statistical significance of these changes). We have already developed tools for these analysis steps, with an initial pipeline described in our recent Nature Protocols article and available for download, and we are now working on improving the registration steps and the detection of active cells.

We have also shown that tissue clearing is useful not only for the brain but also for other organs and for whole-body imaging. Because we noticed aminoalcohols in the CUBIC reagent could decolourise the endogenous pigments such as heme, we developed a direct transcardial perfusion of the CUBIC reagent for further transparency. This perfusion protocol enables whole-body or whole-organ clearing within 10 days to 2 weeks.

Our new protocol provides access to a new world. CUBIC makes it possible to visualise and quantify a targeted small minority cells in the 30 billion cells of a mouse body. This is helpful to understand cellular mechanisms of autoimmune disease and cancer micrometastasis. Of course, our new protocol is not limited to model organisms expressing fluorescent proteins. CUBIC is compatible with immunohistochemistry so we can apply our method to human pathology, for which fluorescence imaging is not possible.


Further reading:

  1. K. Chung, J. Wallace, S.-Y. Kim, S. Kalyanasundaram, A. S. Andalman, T. J. Davidson, J. J. Mirzabekov, K. A. Zalocusky, J. Mattis, A. K. Denisin, S. Pak, H. Bernstein, C. Ramakrishnan, L. Grosenick, V. Gradinaru and K. Deisseroth (2013). Structural and molecular interrogation of intact biological systems. Nature 497, 332–337. DOI: http://dx.doi.org/10.1038/nature12107
  2. E. A. Susaki, K. Tainaka, D. Perrin, F. Kishino, T. Tawara, T. M. Watanabe, C. Yokoyama, H. Onoe, M. Eguchi, S. Yamaguchi, T. Abe, H. Kiyonari, Y. Shimizu, A. Miyawaki, H. Yokota and H. R. Ueda (2014). Whole-brain imaging with single-cell resolution using chemical cocktails and computational analysis. Cell 157, 726–739. DOI: http://dx.doi.org/10.1016/j.cell.2014.03.042
  3. K. Tainaka, S. I. Kubota, T. Q. Suyama, E. A. Susaki, D. Perrin, M. Ukai-Tadenuma, H. Ukai and H. R. Ueda (2014). Whole-body imaging with single-cell resolution by tissue decolorization. Cell 159, 911–924. DOI: http://dx.doi.org/10.1016/j.cell.2014.10.034
  4. E. A. Susaki, K. Tainaka, D. Perrin, H. Yukinaga, A. Kuno and H. R. Ueda (2015). Advanced CUBIC protocols for whole-brain and whole-body clearing and imaging with single-cell resolution. Nature Protocols 10, 1709–1727. DOI: http://dx.doi.org/10.1038/nprot.2015.085
Thumbs up (4 votes)
Loading...

Tags: , ,
Categories: Research

Cricket Leg Regeneration: Histone Modification Matters

Posted by , on 22 October 2015

In autumn, crickets generally exhibit chirping songs in the temperate East Asian country of Japan. While the African field cricket Gryllus bimaculatus originates from tropical countries, it is an emerging model animal globally because of its ability to regenerate amputated legs during nymph and its developmental mode (short germ band) (Mito and Noji, 2008).

Many living organisms in the animal kingdom are able to regrow their body parts following injury. Examples of body parts that may be regrown include the lens and tail of amphibians, the head of planarians, and the heart of fish. In contrast, it has long been assumed that humans cannot restore lost body parts, except for particular tissues, including the epidermis, the liver, and the ovarian surface after ovulation. Therefore, it is important to elucidate the molecular mechanisms involved in regeneration processes using animal models that are able to regenerate body parts for subsequent application in non-regenerative human organs and tissues.

Within the last 2 years, comparative genomic studies of two planarian species with different regenerative abilities led to the successful regeneration of heads by reducing beta-catenin activity from otherwise non-regenerative tail fragments (Umesono et al., 2013). Studies of vertebrates with the ability to restore limbs, including newts, frogs, and salamanders, have demonstrated that limb regeneration occurs in a stepwise manner. The limb regeneration process is divided into at least three phases: wound healing, dedifferentiation, and redevelopment, with the redevelopment phase mimicking embryonic development (Endo et al., 2004).

The cricket leg is composed of six segments that are arranged along the proximo-distal (PD) axis: coxa, trochanter, femur, tibia, tarsus, and claw (Figure 1). Fig1The tarsus is further subdivided into three tarsomeres. When the tibia of the third-instar nymph is amputated, the leg regenerates and recovers its allometric size and proper shape by the sixth instar (i.e., within 20 days of amputation), being restored to almost normal adult size and shape. Soon after healing, the blastema (a pool of cells that proliferate) develops in the distal region of the amputated leg. Blastema cells proliferate and form the missing structures by intercalary processes between the most distal region and the remaining part of the leg (French et al., 1976).

Previously, we performed comparative transcriptome analysis of regenerating and normal amputated legs of crickets to profile mRNA expression associated with leg regeneration (Bando et al., 2013). We first focused on the upregulation of Jak/Stat pathway genes, which are linked to the immune system. RNA interference (RNAi) of genes in this pathway thoroughly disturbed leg regeneration. In contrast, RNAi against Socs, a suppressor of cytokine signaling, caused leg elongation. Additional experiments showed that the Jak/Stat pathway promotes cell proliferation downstream of the Ds/Fat pathway.

Subsequently, we investigated epigenetic regulation during cricket leg regeneration. Tetsuya Bando, a senior investigator in our group, identified one gene for histone H3 lysine 27 (H3K27) methyltransferase, E(z), and one gene for histone H3K27 demethylase, Utx, in G. bimaculatus. Cloning Gryllus genes is now a straightforward process due to information being available about the cricket genome (Mito and Noji, personal communication). Methylation of histone H3K27 by E(z) represses the expression of target genes by recruiting Polycomb group proteins. Conversely, demethylation of the trimethylated histone H3K27 by Utx promotes gene expression. Tetsuya found that the transcription of both E(z) and Utx genes is upregulated in the blastema cells of amputated legs (Bando et al., 2013). In situ hybridization verified that both genes are ubiquitously transcribed in the regenerating legs of crickets, and that both genes are expressed in developing embryos (Hamada et al., 2015). Immunostaining on the amputated tiny legs after RNAi by Yoshimasa Hamada (a PhD student) confirmed that E(z) and Utx contribute to the methylation and demethylation at histone H3K27me3, respectively, during leg regeneration.

However, Yoshimasa unexpectedly found that the extra leg segment is formed after RNAi against E(z) (Figure 1). Initially, we were not able to determine the identity of the leg segment. Morphologically, the leg segment appeared to be a tibia, because it had spines and spurs that were characteristic to an authentic tibia. Our opening hypothesis was that the phenotypes after RNAi might depend on the amputation site in the tibia. However, even when a leg is amputated in the distal part of the femur, the extra tibia-like segment emerges. Pattern formation along the antero-posterior and dorso-ventral axes remained unchanged, except along the PD axis. We then examined whether the amputation site along the PD axis in the tibia influenced phenotypic severity. The extra-tibia that formed became longer the more proximal the amputation sites on the tibia (Figure 1). Conversely, RNAi against Utx resulted in the loss of joint formation between tarsomere 1 (Ta1) and Ta2 (Figure 2). Fig2In situ hybridization showed that the expression of leg patterning genes altered along the PD axis. Specifically, the domain of dachshund (dac) expression expanded in E(z)RNAi regenerating legs, whereas Egfr expression diminished in UtxRNAi legs. Therefore, E(z) may repress dac expression during normal leg regeneration, whereas Utx induces Egfr expression.

dac encodes a transcriptional co-repressor that is categorized in leg gap genes. dac produces crude positional values along the PD axis of the leg and mediates the formation of the distal tibia and Ta1 (the proximal tarsomere) during cricket leg regeneration (dac expression domain is shown in green in Figure 2) (Ishimaru et al., 2015). Specifically, dac promotes tibial cell proliferation. Therefore, because RNAi against E(z) upregulates dac, E(z) expression in the blastema cells may suppress the blastemal overproliferation by repressing extra dac expression.

This information raises the question of how E(z) specifically regulates dac expression. Furthermore, what is the mechanism that determines the target genes of E(z)? E(z) belongs to the Polycomb repressive complex 2 (PRC2), which is one of three Polycomb group (PcG) complexes (Schuettengruber et al., 2007). During cricket embryogenesis, E(z) represses the anterior expansion of Hox gene expression and provides proper identity in embryos (Matsuoka et al., 2015). This information indicates that the target genes of E(z) differ depending on the cellular context. A DNA binding protein, Pleiohomeotic (Pho), along with other factors, binds to the Polycomb response elements (PRE) of target genes, after which E(z) trimethylates histone H3K27. Although PREs have only been identified in Drosophila, the meta-analysis of putative target genes for PcG proteins has shown that many of the target genes are common to the fly, mouse, and humans. dac and Egfr are included among these genes (Schuettengruber et al., 2007). Thus, the regulatory region of the cricket dac gene probably contains PREs, through which E(z) epigenetically regulates the expression of dac during cricket leg regeneration (Figure 2). Ongoing research is focused on characterizing the functions of the Pho gene and other PcG complex genes and epigenetic modifiers during Gryllus leg regeneration.

Finally, why does E(z) RNAi cause extra-tibia formation? One hypothetical scenario is that when the tibia is amputated at the proximal position where dac expression is low, Utx expression (which dominates E(z) expression) permits dac expression (Figure 3a) to restore the tibia. Fig3Thus, these histone modifiers sense the positional values along the PD axis of the amputation site, and fine-tune the expression level of leg patterning genes, like dac. In the case of E(z) RNAi just before proximal amputation, intense dac expression is induced and expands in the regenerating leg (Figure 3b). Distal-less (Dll) expression, which is another leg gap gene that specifies the distal domain of the leg (Angelini and Kaufman, 2005), may shift more distally depending on expanded dac expression (Figure 3b). Thus, the Egfr-expressing domain may be separated into two parts where (1) Dll expression is low and (2) Dll is high. The extra-tibia probably forms between the two different Egfr-expressing domains by intercalating cell proliferation and patterning (Figure 3c).

Our goal is to elucidate blueprints for “making a regenerated leg” by using this attractive hemimetabolous insect model. The blueprints are expected to clarify how the number of leg segments is determined. Our striking observations on RNAi against E(z) leading to “extra tibia formation” represent an important step towards elucidating this process.


References

  1. Mito, T. and Noji, S. (2008). The Two-Spotted Cricket Gryllus bimaculatus: An emerging Model for Developmental and Regeneration Studies. Cold Spring Harb Protoc, 331-346.
  2. Umesono, Y., Tasaki, J., Nishimura, Y., Hrouda, M., Kawaguchi, E., Yazawa, S., Nishimura, O., Hosoda, K., Inoue, T. and Agata, K. (2013). The molecular logic for planarian regeneration along the anterior–posterior axis. Nature 500, 73–76.
  3. Endo, T., Bryant, S. V. and Gardiner, D. M. (2004). A stepwise model system for limb regeneration. Dev Biol 270, 135–145.
  4. French, V., Bryant, P. J. and Bryant, S. V. (1976). Pattern regulation in epimorphic fields. Science 193, 969-981.
  5. Bando, T., Ishimaru, Y., Kida, T., Hamada, Y., Matsuoka, Y., Nakamura, T., Ohuchi, H., Noji, S. and Mito, T. (2013). Analysis of RNA-Seq data reveals involvement of JAK/STAT signalling during leg regeneration in the cricket Gryllus bimaculatus. Development 140, 959-964.
  6. Hamada, Y., Bando, T., Nakamura, T., Ishimaru, Y., Mito, T., Noji, S., Tomioka, K. and Ohuchi, H. (2015). Leg regeneration is epigenetically regulated by histone H3K27 methylation in the cricket Gryllus bimaculatus. Development 142, 2916-2927.
  7. Ishimaru, Y., Nakamura, T., Bando, T., Matsuoka, Y., Ohuchi, H., Noji, S. and Mito, T. (2015). Involvement of dachshund and Distal-less in distal pattern formation of the cricket leg during regeneration. Sci Rep 5, 8387.
  8. Schuettengruber, B., Chourrout, D., Vervoort, M., Leblanc, B. and Cavalli, G. (2007). Genome regulation by polycomb and trithorax proteins. Cell 128, 735-745.
  9. Matsuoka, Y., Bando, T., Watanabe, T., Ishimaru, Y., Noji, S., Popadić, A. and Mito, T. (2015). Short germ insects utilize both the ancestral and derived mode of Polycomb group-mediated epigenetic silencing of Hox genes. Biol Open 4, 702-709.
  10. Angelini,R. and Kaufman, T. C. (2005). Insect appendages and comparative ontogenetics. Dev Biol 286, 57-77.
Thumbs up (2 votes)
Loading...

Tags: , ,
Categories: Research

Journal of Cell Science Special Issue on 3D Cell Biology: Call for Papers:

Posted by , on 22 October 2015

Journal of Cell Science is pleased to welcome submissions for consideration for an upcoming Special Issue on 3D Cell Biology. We have a limited understanding of cells within their natural context of tissues and organs, but recent advances in imaging techniques, organoids and other more complex systems are making it easier for cell biology research to be conducted in more complex and physiologically relevant settings. Ultimately, we hope to achieve a sophisticated molecular understanding of how cells build organs during development and corrupt their structure and function during disease processes. Journal of Cell Science is a natural home for the research that will help to address these fundamental biological questions.

We invite you to showcase your breakthrough research on all aspects of 3D Cell Biology in this Special Issue, which is scheduled for publication in mid 2016 and will be widely marketed and distributed at relevant conferences worldwide. The articles within this issue will receive extensive exposure to a broad audience of cell biologists.

The issue will be guest edited by Andrew Ewald (Johns Hopkins School of Medicine, USA), who is also the Journal of Cell Science Guest Editor and will handle all 3D cell biology papers submitted to the journal for one year, from August 2015.

We encourage submissions of Research Articles and Short Reports, and Tools & Techniques papers. Articles must be received by January 16th, 2016 for consideration for the Special Issue. Please refer to our author guidelines for information on preparing your manuscript for Journal of Cell Science, and submit your manuscript via our online submission system. Please highlight that your submission is to be considered for the Special Issue in your cover letter. For rapid feedback on the potential suitability of an article for this Special Issue, please submit a presubmission enquiry.

Why publish in Journal of Cell Science?

  • NO page or colour charges
  • Expert Academic Editors
  • Efficient and fair decisions
  • Open Access option
  • Not-for-profit publisher
  • Wide international circulation

Submission deadline: January 16th, 2016

Thumbs up (1 votes)
Loading...

Tags:
Categories: News