February in preprints
Posted by the Node, on 4 March 2019
Welcome to our monthly trawl for developmental biology (and related) preprints.
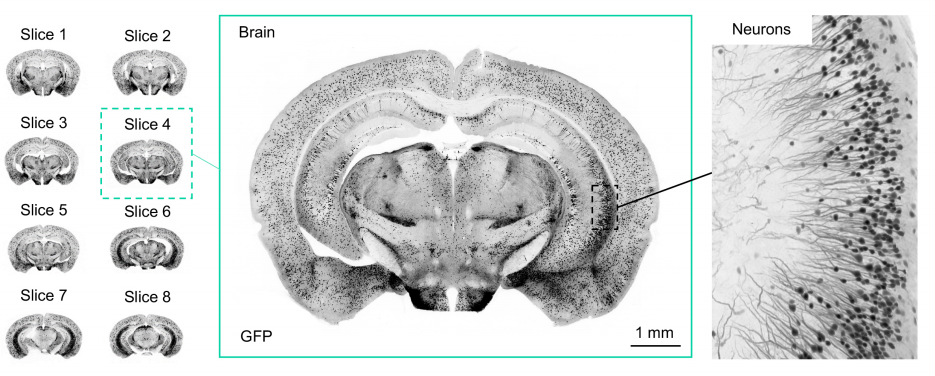
February was notable for the amount of neural development, from retina to cortex and fly to fish. We also found butterfly wings, human segmentation, a plenitude of of plants and sequenced genomes for komodo dragons, parasitic wasps, copepods and one celebrity cat.
The preprints were hosted on bioRxiv, PeerJ, and arXiv. Let us know if we missed anything, and use these links to get to the section you want:
Developmental biology
| Stem cells, regeneration & disease modelling
Evo-devo & evo
Cell biology
Modelling
Tools & resources
Research practice & education
Why not…
Developmental biology
| Patterning & signalling
How prolonged expression of Hunchback, a temporal transcription factor, re-wires locomotor circuits
Ellie Heckscher, Julia L Meng, Zarion D Marshall, Meike Lobb-Rabe
The Hunchback temporal transcription factor determines motor neuron axon and dendrite targeting in Drosophila
Austin Q Seroka, Chris Q Doe
Spatiotemporal dynamics of calcium transients during embryogenesis of Drosophila melanogaster
Olga Markova, Sebastien Senatore, Pierre-Francois Lenne
Ecdysone signaling promotes expression of multifunctional RNA binding proteins essential for ovarian germline stem cell self-renewal in Drosophila
Danielle S Finger, Vivian V Holt, Elizabeth T Ables
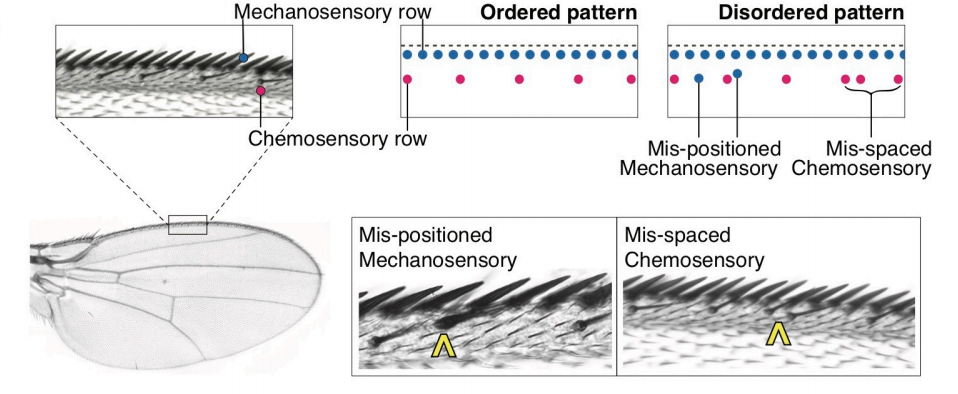
Ordered patterning of the sensory system is susceptible to stochastic features of gene expression
Ritika Giri, Dimitrios K Papadopoulos, Diana M Posadas, Hemanth Potluri, Pavel Tomancak, Madhav Mani, Richard Carthew
A neurodevelopmental origin of behavioral individuality
Gerit Linneweber, Maheva Andriatsilavo, Suchetana Dutta, Liz Hellbruegge, Guangda Liu, Radoslaw Ejsmont, Lisa Fenk, Andrew Straw, Mathias Wernet, Peter Robin Hiesinger, Bassem Hassan
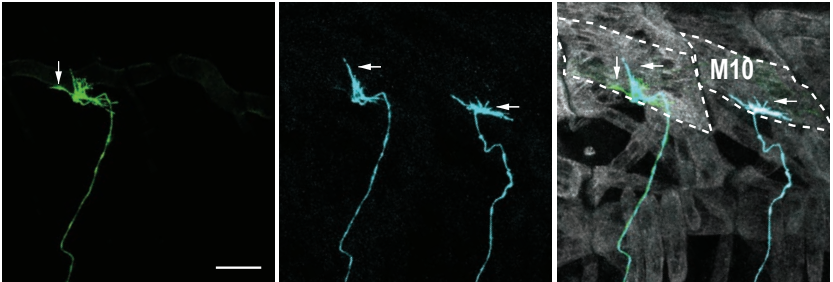
Intrinsic control of muscle attachment sites matching
Alexandre Carayon, Laetitia Bataillé, Gaëlle Lebreton, Laurence Dubois, Aurore Pelletier, Yannick Carrier, Antoine Wystrach, Alain Vincent, Jean-Louis Frendo
A Deficiency in SUMOylation Activity Disrupts Multiple Pathways Leading to Neural Tube and Heart Defects in Xenopus Embryos
Michelle M. Bertke, Kyle M. Dubiak, Laura Cronin, Erliang Zeng, Paul W Huber
Auto-inhibition of myoblast fusion by cyclic receptor signalling.
Daniel Sieiro, Julie Melendez, Valerie Morin, David Salgado, Christophe Marcelle
Modeling the Human Segmentation Clock with Pluripotent Stem Cells
Mitsuhiro Matsuda, Yoshihiro Yamanaka, Maya Uemura, Mitsujiro Osawa, Megumu K. Saito, Ayako Nagahashi, Megumi Nishio, Long Guo, Shiro Ikegawa, Satoko Sakurai, Shunsuke Kihara, Michiko Nakamura, Tomoko Matsumoto, Hiroyuki Yoshitomi, Makoto Ikeya, Takuya Yamamoto, Knut Woltjen, Miki Ebisuya, Junya Toguchida, Cantas Alev
The selection arena in early human blastocysts resolves the pluripotent inner cell mass
Manvendra Singh, Thomas J Widmann, Vikas Bansal, Jose L Cortes, Gerald G Schumann, Stephanie Wunderlich, Ulrich Martin, Jose L Garcia-Perez, Laurence D Hurst, Zsuzsanna Izsvak
STOCHASTIC SINGLE CELL BEHAVIOUR LEADS TO ROBUST HORIZONTAL CELL LAYER FORMATION IN THE VERTEBRATE RETINA
Rana Amini, Anastasia Labudina, Caren Norden
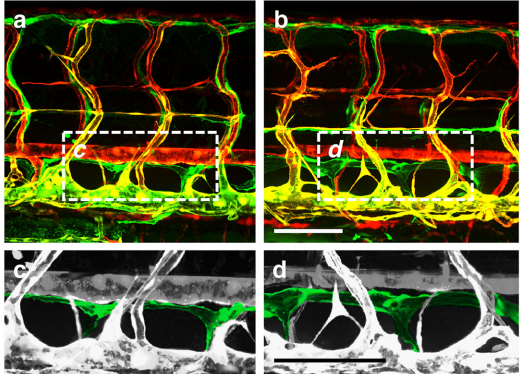
Immunohistochemical and ultrastructural analysis of the maturing larval zebrafish enteric nervous system reveals the formation of a neuropil pattern
Phillip A Baker, Matthew D Meyer, Ashley Tsang, Rosa Uribe
Single cell profiling of CRISPR/Cas9-induced OTX2 deficient retinas reveals fate switch from restricted progenitors
Miruna G. Ghinia Tegla, Diego F. Buenaventura, Diana Y Kim, Cassandra Thakurdin, Kevin C. Gonzalez, Mark M Emerson
Fetal stage melanopsin (OPN4) and GNAQ (Gαq) signaling regulates vascular development of the eye
Shruti Vemaraju, Gowri Nayak, William E Miller, David R Copenhagen, Richard A Lang
The neuronal ceroid lipofuscinosis protein Cln7 regulates neural development from the post-synaptic cell
Kyle B Connolly, Megan B O’Hare, Alamin Mohammed, Katelyn C Aitchison, Niki C Anthoney, Amy L Roberts, Matthew J Taylor, Bryan A Stewart, Richard I Tuxworth, Guy Tear
Loss of Shh signaling in the neocortex reveals heterogeneous cell recovery responses from distinct oligodendrocyte populations
Caitlin C Winkler, Santos J Franco
Sonic hedgehog signaling in astrocytes mediates cell-type-specific synaptic organization
Steven A Hill, Andrew Blaeser, Austin Coley, Yajun Xie, Katherine A Shepard, Corey Harwell, Wen-Jun Gao, A. Denise R. Garcia
Androgens enhance adult hippocampal neurogenesis in males but not females in an age-dependent manner
Paula Duarte-Guterman, Dwayne Hamson, Steven Wainwright, Carmen Chow, Jessica Chaiton, Stephanie E Lieblich, Neil V Watson, Liisa AM Galea
Adult-born neurons inhibit developmentally-born neurons in the dentate gyrus
Shaina P Cahill, Angela Martinovic, John Darby Cole, Jason S Snyder
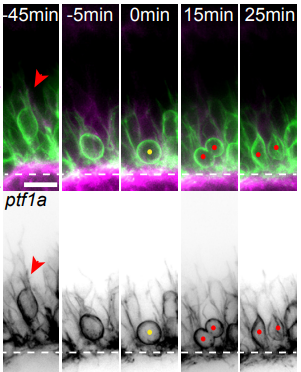
Basal protrusions mediate spatiotemporal patterns of spinal neuron differentiation
Zena Hadjivasiliou, Rachel Moore, Rebecca McIntosh, Gabriel Galea, Jon Clarke, Paula Alexandre
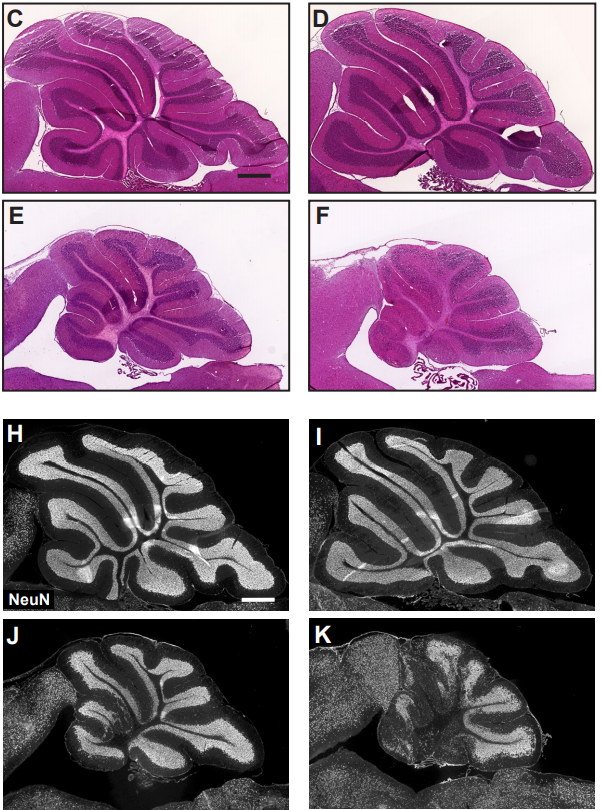
YAP is involved in replenishment of granule cell progenitors following injury to the neonatal cerebellum
Zhaohui Yang, Alexandra L Joyner
Cerebellar nuclei neurons dictate growth of the cortex through developmental scaling of presynaptic Purkinje cells
Ryan T Willett, Alexandre Wojcinski, Nermin Sumru Bayin, Zhimin Lao, Daniel Stephen, Katherine L Dauber-Decker, Zhuhao Wu, Marc Tessier-Lavigne, Hiromitsu Saito, Noboru Suzuki, Alexandra L Joyner
Spatial and temporal profiling of receptor membrane insertion controls commissural axon responses to midline repellents
Aurora Pignata, Hugo Ducuing, Leila Boubakar, Thibault Gardette, Karine Kindbeiter, Muriel Bozon, Servane Tauszig-Delamasure, Julien Falk, Olivier Thoumine, Valerie Castellani
Reelin Mediates Hippocampal Cajal-Retzius Cell Positioning and Infrapyramidal Blade Morphogenesis
Seungshin R Ha, Prem Tripathi, Ray Daza, Robert Hevner, David R Beier
Central and peripheral innervation patterns of defined axial motor units in larval zebrafish
Saul Bello-Rojas, Ana E Istrate, Sandeep Kishore, David L McLean
Extracellular Pgk1 enhances neurite outgrowth of motoneurons through Nogo66-independent targeting of NogoA
Cheng Yung Lin, Chia Lun Wu, Kok Zhi Lee, You Jei Chen, Po Hsiang Zhang, Chia Yu Chang, Horng Jyh Han, Shinn Zong Lin, Huai Jen Tsai
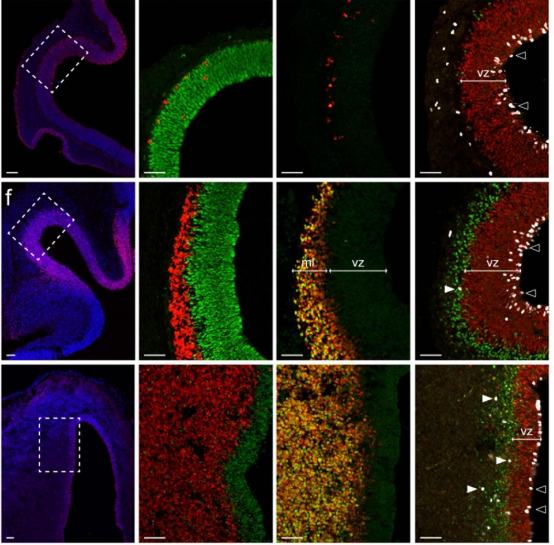
Evolutionary conserved canonical BMP activity controls cortical neurogenesis
Sonia Najas, Isabel Pijuan, Anna Esteve-Codina, Susana Usieto, Juan D Martinez, An Zwijsen, Mariona L Arbones, Elisa Marti, Gwenvael Le Dreau
Over-activation of BMP signaling in neural crest cells precipitates heart outflow tract septation
Jean Francois Darrigrand, Mariana Valente, Pauline Martinez, Glenda Comai, Maxime Petit, Ryuichi Nishinakamura, Daniel S Osorio, Vanessa Ribes, Bruno Cadot
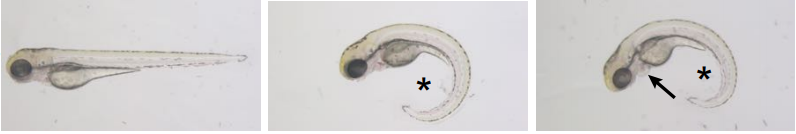
Thyroid hormone coordinates developmental trajectories but does not underlie developmental truncation in Danionins
Yinan Hu, Angela Mauri, Joan Donahue, Rajendra Singh, Benjamin Acosta, Sarah Kelly McMenamin
Small Molecule Screening in Zebrafish Embryos Identifies Signaling Pathways Regulating Early Thyroid Development
Benoit Haerlingen, Robert Opitz, Isabelle Vandernoot, Achim Trubiroha, Pierre Gillotay, Nicoletta Giusti, Sabine Costagliola
8-OxoG in GC-rich Sp1 binding sites enhances gene transcription during adipose tissue development in juvenile mice
Jong Woo Park, Young In Han, Tae Min Kim, Su Cheong Yeom, Jaeku Kang, Joonghoon Park
A conserved requirement for Fbxo7 during male germ cell cytoplasmic remodelling
Claudia Cattoni Rathje, Suzanne J Randle, Sara Al Rawi, Benjamin Matthew Skinner, Emma EP Johnson, Joanne Bacon, Myrto Vlazaki, Nabeel A Affara, Peter JI Ellis, Heike Laman
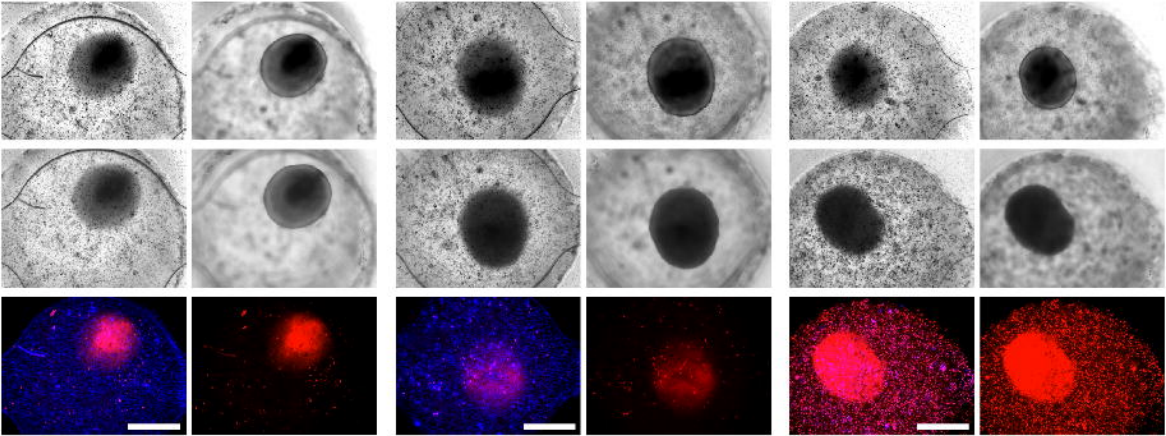
SNAP23 is required for the maintenance of meiotic arrest and cortical granule exocytosis in mouse oocytes
Lisa M Mehlmann, Tracy F. Uliasz, Katie M. Lowther
Retinoic acid promotes in vitro development of haploid germ cells from pre-pubertal porcine spermatogenic cells
Shou-Long Deng, Zheng-Xing Lian, Kun Yu, Yi Zhang, Bao-Lu Zhang, Han-Yu Wu, De-Ping Han, Yi-Xun Liu, Su-Tian Wang
Sox2 and FGF20 interact to regulate organ of Corti hair cell and supporting cell development in a spatially-graded manner
Lu M. Yang, Kathryn S.E. Cheah, Sung-Ho Huh, David M. Ornitz
Dynamics of Sox2 expression during rat germ cell development and its relationship with emergence of spermatogonia
Ticiana Volpato, Renato Borges Tesser, Marina Nunes, Taiza Stumpp
Sox17 expression in endocardium precursor cells regulates heart development in mice
Rie Saba, Keiko Kitajima, Lucille Rainbow, Sylvia Engert, Mami Uemura, Hidekazu Ishida, Ioannis Kokkinopoulos, Yasunori Shintani, Shigeru Miyagawa, Yoshiakira Kanai, Masami Azuma-Kanai, Peter Koopman, Chikara Meno, John Kenny, Heiko Lickert, Yumiko Saga, Ken Suzuki, Yoshiki Sawa, Kenta Yashiro
An alternatively spliced zebrafish jnk1a transcript has an essential and non-redundant role in development of the first heart field derived proximal ventricular chamber.
Adrian Santos-Ledo, Sam J Washer, Tamilvendhan Dhanaseelan, Paul Chrystal, Tania Papoutsi, Deborah Henderson, Bill Chaudhry
Dynamic chromatin targeting of BRD4 stimulates cardiac fibroblast activation
Matthew S Stratton, Rushita A Bagchi, Rachel A Hirsch, Andrew S Riching, Marina B Felisbino, Blake Y Enyart, Keith A Koch, Maria A Cavasin, Michael Alexanian, Kunhua Song, Jun Qi, Madeleine E Lemieux, Maggie P.Y. Lam, Saptarsi M Haldar, Charles Y Lin, Timothy McKinsey
Positive feedback loop of regulating ERK phosphorylation in mESCs mediated by Etv5-Tet2-Fgfr2 axis
Chen Fan, Kui Zhu, Yuan Liu, Mengyao Zhang, Hongxia Cao, Na Li, Yan Wang, Jinlian Hua, Huayan Wang, Shiqiang Zhang
Lineage tracing analysis of cone photoreceptor-associated cis-regulatory elements in the developing chicken retina.
Estie Schick, Sean McCaffery, Erin Keblish, Cassandra Thakurdin, Mark Emerson
Glia-derived exosomal miR-274 targets Sprouty in trachea and synaptic boutons to modulate growth and responses to hypoxia
Yi-Wei Tsai, Hsin-Ho Sung, Jian-Chiuan Li, Chun-Yen Yeh, Pei-Yi Chen, Ying-Ju Cheng, Chun-Hong Chen, Yu-Chen Tsai, Cheng-Ting Chien
Steroid hormones sulfatase inactivation extends lifespan and ameliorates age-related diseases
Mercedes M. Pérez-Jiménez, Paula Sansigre, Amador Valladares, Mónica Venegas-Calerón, Alicia Sánchez-García, José M. Monje, Sara Esteban-García, Irene Suarez-Pereira, Javier Vitorica, José J Ríos, Marta Artal-Sanz, Ángel M. Carrión, Manuel J. Muñoz
| Morphogenesis & mechanics
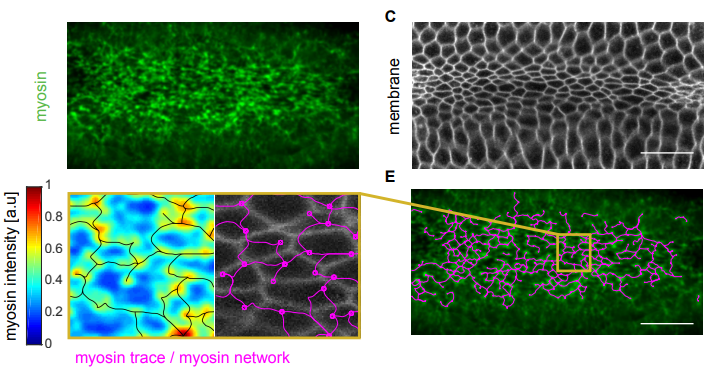
Structural redundancy in supracellular actomyosin networks enables robust tissue folding
Hannah G Yevick, Pearson W Miller, Jorn Dunkel, Adam C Martin
Microtubules stabilize intercellular contractile force transmission during tissue folding
Clint Shijun Ko, Vardges Tserunyan, Adam Martin
Cell-type specific mechanical response and actomyosin dynamics in the developing Drosophila retina
Laura Blackie, Michael F Staddon, Shiladitya Banerjee, Franck Pichaud
Transcriptional initiation and mechanically driven propagation of a tissue morphogenetic wave during axis elongation
Anais Bailles, Claudio Collinet, Jean-Marc Philippe, Pierre-François Lenne, Edwin Munro, Thomas Lecuit
N-cadherin-Presented Slit Repulsive-Cues Direct Collective Schwann cell Migration
Julian J A Hoving, Elizabeth Harford-Wright, Patrick Wingfield-Digby, Anne-Laure Cattin, Mariana Campana, Toby L Morgan, Victor Quereda, Erica Torchiaro, Alison C Lloyd
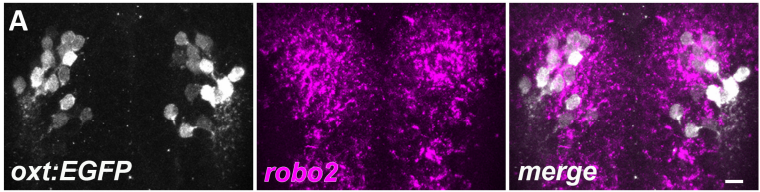
Robo2 regulates synaptic oxytocin content by affecting actin state
Savani Anbalagan, Janna Blechman, Michael Gliksberg, Ron Rotkopf, Tali Dadosh, Gil Levkowitz
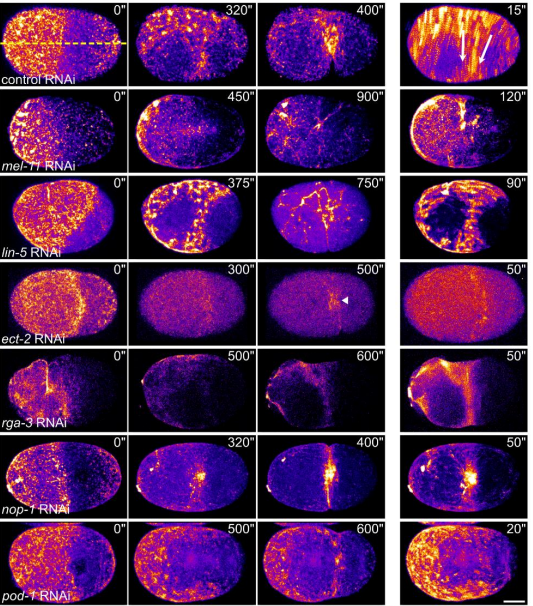
Uniaxial loading induces a scalable switch in cortical actomyosin flow polarization and reveals mechanosensitive regulation of cytokinesis
Deepika Singh, Devang Odedra, Christian Pohl
Fracking and Ostwald ripening position the lumen of the mouse blastocyst
Julien Dumortier, Mathieu Le Verge-Serandour, Anna-Francesca Tortorelli, Annette Mielke, Ludmilla de Plater, Herve Turlier, Jean-Leon Maitre
Active wetting of epithelial tissues
Carlos Pérez-González, Ricard Alert, Carles Blanch-Mercader, Manuel Gómez-González, Tomasz Kolodziej, Elsa Bazellières, Jaume Casademunt, Xavier Trepat
| Genes & genomes
A critical but divergent role of PRDM14 in human primordial germ cell fate revealed by inducible degrons
Anastasiya Sybirna, Walfred W. C. Tang, Sabine Dietmann, Wolfram H. Gruhn, Azim M. Surani
PRDM14 controls X-chromosomal and global epigenetic reprogramming of H3K27me3 in migrating mouse primordial germ cells
Anna Mallol, Maria Guirola, Bernhard Payer
Dynamics of microRNA expression during mouse prenatal development
Sorena Rahmanian, Rabi Murad, Alessandra Breschi, Weihua Zeng, Brian A Williams, Mark Mackiewicz, Brian Roberts, Sarah Meadows, Dianne Moore, Carrie Davis, Diane Trout, Chris Zaleski, Alexander Dobin, Lei-Hoon Sei, Jorg Drenkow, Alex Scavelli, Thomas R Gingeras, Barbara Wold, Richard M. Myers, Roderic Guigo, Ali Mortazavi
MicroRNA-mediated control of developmental lymphangiogenesis
Hyun Min Jung, Ciara Hu, Alexandra M Fister, Andrew E Davis, Daniel Castranova, Van N Pham, Lisa M Price, Brant M Weinstein
Tbx1 interacts genetically with Vegfr3 to regulate cardiac lymphangiogenesis in mice
Stefania Martucciello, Maria Giuseppina Turturo, Sara Cioffi, Li Chen, Antonio Baldini, Elizabeth Anne Illingworth
A chromatin modulator sustains self-renewal and enables differentiation of postnatal neural stem and progenitor cells
Kushani Shah, Gwendalyn D King, Hao Jiang
CTCF confers local nucleosome resiliency after DNA replication and during mitosis
Nick Owens, Thaleia Papadopoulou, Nicola Festuccia, Alexandra Tachtsidi, Inma Gonzalez, Agnes Dubois, Sandrine Vandormael-Pournin, Elphege P Nora, Benoit G Bruneau, Michel Cohen-Tannoudji, Pablo Navarro
3D Chromatin Architecture Remodeling during Human Cardiomyocyte Differentiation Reveals A Role Of HERV-H In Demarcating Chromatin Domains
Yanxiao Zhang, Ting Li, Sebastian Preissl, Jonathan Grinstein, Elie Farah, Eugin Destici, Ah Young Lee, Sora Chee, Yunjiang Qiu, Kaiyue Ma, Zhen Ye, Quan Zhu, Hui Huang, Rong Hu, Rongxin Fang, Leqian Yu, Juan Carlos Belmonte, Jun Wu, Sylvia Evans, Neil Chi, Bing Ren
Quantitative analysis of the ThrbCRM1-centered gene regulatory network
Benjamin Souferi, Mark Emerson
lncRNA DIGIT and BRD3 protein form phase-separated condensates to regulate endoderm differentiation
Kaveh Daneshvar, M. Behfar Ardehali, Isaac A Klein, Arcadia J Kratkiewicz, Chan Zhou, Amin Mahpour, Brett M Cook, Wenyang Li, Joshua V Pondick, Sean P Moran, Richard A Young, Robert E Kingston, Alan C Mullen
Identification of RBPMS as a smooth muscle master splicing regulator via proximity of its gene with super-enhancers
Erick E Nakagaki-Silva, Clare Gooding, Miriam Llorian, Aishwarya G Jacob, Frederick Richards, Adrian Buckroyd, Sanjay Sinha, Christopher WJ Smith
Comprehensive Assessment of Sequence and Expression of Circular-RNAs in Progenitor Cell Types of the Developing Mammalian Cortex
Martina Dori, Leila Haj Abdullah Alieh, Daniel Cavalli, Simone Massalini, Mathias Lesche, Andreas Dahl, Federico Calegari
Precise removal of Calm1 long 3′ UTR isoform by CRISPR-Cas9 genome editing impairs dorsal root ganglion development in mice.
Hannah N Gruner, Bongmin Bae, Maebh Lynch, Daniel Oliver, Kevin So, Grant S Mastick, Wei Yan, Pedro Miura
Identification of genes with enriched expression in early developing mouse cone photoreceptors
Diego F Buenaventura, Adrianne Corseri, Mark M Emerson
The Tug1 Locus is Essential for Male Fertility
Jordan P. Lewandowski, Gabrijela Dumbović, Audrey R. Watson, Taeyoung Hwang, Emily Jacobs-Palmer, Nydia Chang, Christian Much, Kyle Turner, Christopher Kirby, Jana Felicitas Schulz, Clara-Louisa Müller, Nimrod D. Rubinstein, Abigail F. Groff, Steve C. Liapis, Chiara Gerhardinger, Norbert Hubner, Sebastiaan van Heesch, Hopi E. Hoekstra, Martin Sauvageau, John L. Rinn
Murine Surf4 is essential for early embryonic development
Brian T. Emmer, Paul J Lascuna, Emilee Kotnik, Thom Saunders, Rami Khoriaty, David Ginsburg
The Effects of Mutations are Modified by Genetic Background in Mice
Christoph D Rau, Natalia M Gonzales, Danny Park, Abraham A Palmer, Aldons J Lusis, Noah Zaitlen
Combinatorial chromatin dynamics foster accurate cardiopharyngeal fate choices
Claudia Racioppi, Keira A Wiechecki, Lionel Christiaen
A single cell transcriptional roadmap for cardiopharyngeal fate diversification
Wei Wang, Xiang Niu, Tim Stuart, Estelle Jullian, William Mauck, Robert G. Kelly, Rahul Satija, Lionel Christiaen
Repressive gene regulation synchronizes development with cellular metabolism
Justin J Cassidy, Sebastian Bernasek, Rachael Bakker, Ritika Giri, Nicolas Pelaez, Bryan Eder, Anna Bobrowska, Neda Bagheri, Luis A Amaral, Richard W Carthew
Pleiotropic effects of ebony and tan on pigmentation and cuticular hydrocarbon composition in Drosophila melanogaster
Jonathan H Massey, Noriyoshi Akiyama, Tanja Bien, Klaus Dreisewerd, Patricia J Wittkopp, Joanne Y Yew, Aya Takahashi
Unidirectional fork movement coupled with strand-specific histone incorporation ensures asymmetric histone inheritance
Matthew Wooten, Jonathan Snedeker, Zehra Nizami, Xinxing Yang, Rajesh Ranja, Elizabeth Urban, Jee Min Kim, Joseph Gall, Jie Xiao, Xin Chen
Loss of function of the RNA export factor, Nxt1, in Drosophila causes muscle degeneration and reduced expression of genes with long introns.
Kevin van der Graaf, Helen White-Cooper
Mutations in the Insulator Protein Suppressor of Hairy Wing Induce Genome Instability
Shih-Jui Hsu, Emily C. Stow, James R. Simmons, Heather A. Wallace, Andrea Mancheno Lopez, Shannon Stroud, Mariano Labrador-San Jose
Staufen2 mediated RNA recognition and localization requires combinatorial action of multiple domains
Simone Heber, Imre Gaspar, Jan-Niklas Tants, Johannes Günther, Sandra M Fernández Moya, Robert Janowski, Anne Ephrussi, Michael Sattler, Dierk Niessing
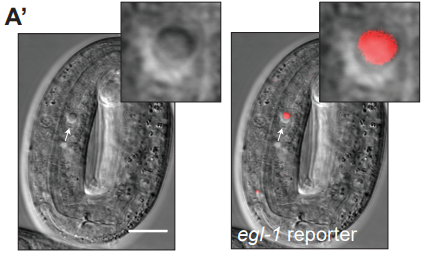
Activity-dependent regulation of the proapoptotic BH3-only gene egl-1 in a living neuron pair in C. elegans
Jonathan T. Pierce, Jesse Cohn, Vivek Dwivedi, Nicole Zarate, Robert Horvitz
Environmental pheromone and endocrine signals correct heterochronic developmental phenotypes caused by insufficient expression of let-7 family microRNAs in C. elegans
Orkan Ilbay, Victor Ambros
C. elegans synMuv B proteins regulate spatial and temporal chromatin compaction during development
Meghan E Costello, Lisa Petrella
Transcriptome analysis reveals that fertilization with cryopreserved sperm downregulates genes relevant for early embryo development in the horse
JOSE M ORTIZ RODRIGUEZ, CRISTINA ORTEGA, CRUZ GIL, FRANCISCO E MARTIN CANO, GEMMA GAITSKELL-PHILLIPS, HERIBERTO RODRIGUEZ, KATRIN HINRICHS, ALBERTO Alvarez Barrientos, ANGEL ROMAN, Fernando J Peña
| Stem cells, regeneration & disease modelling
Stem cell mitotic drive ensures asymmetric epigenetic inheritance
Rajesh Ranjan, Jonathan Snedeker, Xin Chen
Dynamic Erasure of Random X-Chromosome Inactivation during iPSC Reprogramming
Adrian Janiszewski, Irene Talon, Juan Song, Natalie De Geest, San Kit To, Greet Bervoets, Jean-Christophe Marine, Florian Rambow, Vincent Pasque
Capicua regulates neural stem cell proliferation and lineage specification through control of Ets factors
Shiekh Tanveer Ahmad, Alexandra D Rogers, Myra J Chen, Rajiv Dixit, Lata Adnani, Luke Frankiw, Samuel O Lawn, Michael D Blough, Mana Alshehri, Wei Wu, Stephen M Robbins, Gregory Cairncross, Carol Schuurmans, Jennifer Chan
Temporal resolution of global gene expression and DNA methylation changes in the final phases of reprogramming towards induced pluripotency.
Michela Bartoccetti, Xinlong Luo, Ben van der Veer, Rita Khoueiry, Adrian Janiszewski, Jiayi Xu, Catherine Verfaillie, Vincent Pasque, Bernard Thienpont, Kian Peng Koh
Interactome comparison of human embryonic stem cell lines with the inner cell mass and trophectoderm
Adam Stevens, Helen Smith, Terence Garner, Ben Minogue, Sharon Sneddon, Lisa Shaw, Maria Keramari, Rachel Oldershaw, Nicola Bates, Daniel Brison, Susan Kimber
Transcriptomically-guided mesendoderm induction of human pluripotent stem cells using a systematically defined culture scheme
Richard L Carpenedo, Sarah Y Kwon, R Matthew Tanner, Julien Yockell-Lelievre, Chandarong Choey, Carole Dore, Mirabelle Ho, Duncan J Stewart, Theodore J Perkins, William L Stanford
Cell cycle dynamics of human pluripotent stem cells primed for differentiation
Anna Shcherbina, Jingling Li, Cyndhavi Narayanan, William Greenleaf, Anshul Kundaje, Sundari Chetty
Interaction of Sox2 with RNA binding proteins in mouse embryonic stem cells
Samudyata S, Paulo Amaral, Par G Engstrom, Samuel C Robson, Michael L Nielsen, Tony Kouzarides, Goncalo Castelo-Branco
Control of Hematopoietic Stem Cell Function Through Epigenetic Regulation of Energy Metabolism and Genome Integrity
Zhenhua Yang, Kushani Shah, Alireza Khodadadi-Jamayran, Hao Jiang
Mesenchymal stromal cell remodeling of a gelatin hydrogel microenvironment defines an artificial hematopoietic stem cell niche
Aidan E Gilchrist, Sunho Lee, Yuhang Hu, Brendan Harley
Immune Responses to Human Induced Pluripotent Stem Cells and their Derived Myogenic Progenitors Are Mediated by Different Mechanisms in Humanized Mice
Basma Benabdallah, Cynthia Desaulniers-Langevin, Marie-Lyn Goyer, Chloe Colas, Chantale Maltais, Yuanyi Li, Jean V Guimond, Jacques P Tremblay, Elie Haddad, Christian Beausejour
Single-cell analysis reveals different age-related somatic mutation profiles between stem and differentiated cells in human liver
Kristina Brazhnik, Shixiang Sun, Omar Alani, Milan Kinkhabwala, Allan W. Wolkoff, Alexander Y. Maslov, Xiao Dong, Jan Vijg
Synthetic pluripotent bacterial stem cells
Sara Molinari, David L. Shis, James Chappell, Oleg A. Igoshin, Matthew R. Bennett
Human lung organoids develop into adult airway-like structures directed by physico-chemical biomaterial properties
Briana R Dye, Richard L Youngblood, Robert S Oakes, Tadas Kasputis, Daniel W Clough, Melinda S Nagy, Jason R Spence, Lonnie D Shea
Allometric Scaling of physiologically-relevant organoids
Chiara Magliaro, Andrea Rinaldo, Arti Ahluwalia
Modeling of fibrotic lung disease using 3D organoids derived from human pluripotent stem cells
Hans-Willem Snoeck, Alexandros Strikoudis, Lucas Loffredo, Ya-Wen Chen
Human Retina-on-a-Chip: Merging Organoid and Organ-on-a-Chip Technology to Generate Complex Multi-Layer Tissue Models
Kevin Achberger, Christopher Probst, Jasmin Haderspeck, Sylvia Bolz, Julia Rogal, Johanna Chuchuy, Marina Nikolova, Virginia Cora, Lena Antkowiak, Wadood Haq, Nian Shen, Katja Schenke-Layland, Marius Ueffing, Stefan Liebau, Peter Loskill
Integrative analysis of Hydra head regeneration reveals activation of distal enhancer-like elements
Rabi Murad, Aide Macias-Munoz, Ashley Wong, Xinyi Ma, Ali Mortazavi
Inflammation and matrix metalloproteinase 9 (Mmp-9) regulate photoreceptor regeneration in the adult zebrafish
Nicholas J Silva, Mikiko Nagashima, Jingling Li, Laura Kakuk-Atkins, Milad Ashrafzadeh, David R Hyde, Peter F Hitchcock
Early migration of precursor neurons initiates cellular and functional regeneration after spinal cord injury in zebrafish.
Celia Vandestadt, Gilles C Vanwalleghem, Hozana A Castillo, Mei Li, Keith Schulze, Mitra Khabooshan, Emily Don, Minna-Liisa Anko, Ethan K Scott, Jan Kaslin
Extracellular Caspase-1 regulates migration of hair follicle stem cells upon wounding
Subhasri Ghosh, Neha Pincha, Akhil SHP Ananthan, Sunny Kataria, Rakesh Dey, Srilekha P, Colin Jamora
Dynamic interactions of lymphatic vessels at the hair follicle stem cell niche during hair regeneration
Daniel Pena-Jimenez, Silvia Fontenete, Diego Megias, Coral Fustero-Torre, Osvaldo Grana-Castro, Donatello Castellana, Robert Loewe, Mirna Perez-Moreno
TGFβ signaling curbs cell fusion and muscle regeneration
Francesco Girardi, Anissa Taleb, Lorenzo Giordani, Bruno CADOT, Asiman Datye, Majid Ebrahimi, Dilani G Gamage, Douglas P Millay, Penney M Gilbert, Fabien Le Grand
Combinatorial morphogenetic and mechanical cues to mimic bone development for defect repair
Samuel Herberg, Anna M McDermott, Phuong N Dang, Daniel S Alt, Rui Tang, James H Dawahare, Daniel Varghai, Jung-Youn Shin, Alexandra McMillan, Anna Dikina, Felicia He, Yu Bin Lee, Yuxuan Cheng, Kentaro Umemori, P C Wong, Honghyun Park, Joel D Boerckel, Eben Alsberg
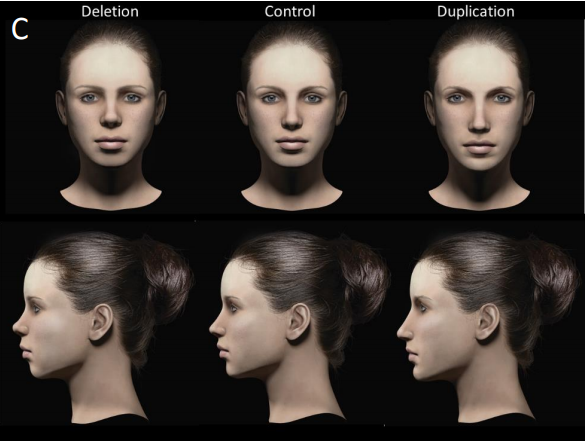
Oligogenic effects of 16p11.2 copy number variation on craniofacial development
Yuqi Qiu, Thomas Arbogast, Sandra Martin Lorenzo, Hongying Li, Tang Shih, Richardson Ellen, Oanh Hong, Shawn Cho, Omar Shanta, Pang Timothy, Christina Corsello, Curtis K. Deutsch, Claire Chevalier, Erica E Davis, Lilia M Iakoucheva, Yann Herault, Nicholas Katasanis, Karen Messer, Jonathan Sebat
Loss of function mutation of mouse Snap29 on a mixed genetic background phenocopy abnormalities found in CEDNIK and 22q11.2 Deletion Syndrome patients
Vafa Keser, Jean-François Boisclair Lachance, Sabrina Shameen Alam, Youngshin Lim, Eleonora Scarlata, Apinder Kaur, Zhang Tian Fang, Shasha Lv, Pierre Lachapelle, Cristian O’Flaherty, Jefferey A. Golden, Loydie A. Jerome-Majewska
Systematic spatio-temporal mapping reveals divergent cell death pathways in three mouse models of hereditary retinal degeneration
Michael J Power, Luke Edward Rogerson, Timm Schubert, Philipp Berens, Thomas Euler, Francois Paquet-Durand
Stem cell derived human microglia transplanted in mouse brain to study genetic risk of Alzheimer’s Disease
Renzo Mancuso, Johanna Van Den Daele, Nicola Fattorelli, Leen Wolfs, Sriram Balusu, Oliver Burton, Annerieke Sierksma, Yannick Fourne, Suresh Poovathingal, Amaia Arranz-Mendiguren, Carlo Sala Frigerio, Christel Claes, Lutgarde Serneels, Tom Theys, V. Hugh Perry, Catherine Verfaillie, Mark Fiers, Bart De Strooper
SURF1 mutations causative of Leigh syndrome impair human neurogenesis
Gizem Inak, Agnieszka Rybak-Wolf, Pawel Lisowski, Rene Juettner, Annika Zink, Barbara Mlody, Petar Glazar, Christopher Secker, Ummi H. Ciptasari, Werner Stenzel, Tobias Hahn, Sebastian Diecke, Josef Priller, Michael Gotthardt, Ralf Kuehn, Erich E. Wanker, Nikolaus Rajewsky, Markus Schuelke, Alessandro Prigione
| Plant development
Molecular Mechanisms Driving Bistable Switch Behavior in Xylem Cell Differentiation
Gina M Turco, Joel Rodriguez-Medina, Stefan Siebert, Diane Han, Hannah Vahldick, Christine N Shulse, Benjamin J Cole, Celina Juliano, Diane E Dickel, Michael A Savageau, Siobhan M Brady
Auxin export from proximal fruits drives arrest in competent inflorescence meristems
Alexander Ware, Catriona H Walker, Jan Simura, Karin Ljung, Anthony Bishopp, Zoe A Wilson, Tom Bennett

Root density sensing allows pro-active modulation of shoot growth to avoid future resource limitation
Cara D Wheeldon, Catriona H Walker, Tom Bennett
Control of Shoot Meristem Size by an Aminoacyl tRNA Synthetase, OKI1, in Arabidopsis
Munenori Kitagawa, Rachappa S Balkunde, Huyen Thanh Bui, David S Jackson
Brassinosteroids control gravitropism by changing cellulose orientation and mannan content in Arabidopsis hypocotyls
Marc Somssich, Filip Vandenbussche, Alexander Ivakov, Norma Funke, Colin Ruprecht, Kris Vissenberg, Dominique Van Der Straeten, Staffan Persson, Dmitry Suslov
EXOCYST70A3 controls root system depth in Arabidopsis via the dynamic modulation of auxin transport
Takehiko Ogura, Christian Goeschl, Daniele Filiault, Madalina Mirea, Radka Slovak, Bonnie Wolhrab, Santosh B Satbhai, Wolfgang Busch
Dynamics of gene expression in single root cells of A. thaliana
Ken Jean-Baptiste, Jose L. McFaline-Figueroa, Cristina M Alexandre, Michael W Dorrity, Lauren Saunders, Kerry L Bubb, Cole Trapnell, Stanley Fields, Christine Queitsch, Josh T Cuperus
KAI2 regulates root and root hair development by modulating auxin distribution
Jose Antonio Villaecija Aguilar, Maxime Hamon-Josse, Samy Carbonnel, Annika Kretschmar, Karin Ljung, Tom Bennett, Caroline Gutjahr
HEXOKINASE 1 Glycolytic Action Fuels Post-Germinative Seedling Growth
Ashwin Ganpudi, Andres Romanowski, Karen J Halliday
PRH1 mediates ARF7-LBD dependent auxin signaling to regulate lateral root development in Arabidopsis thaliana
FENG ZHANG, Wenqing Tao, Ruiqi Sun, Junxia Wang, Cuiling Li, Xiangpei Kong, Huiyu Tian, Zhaojun Ding
Arabidopsis mlo3 mutant plants exhibit spontaneous callose deposition and signs of early leaf senescence
Stefan Kusch, Susanne Thiery, Anja Reinstädler, Katrin Gruner, Krzysztof Zienkiewicz, Ivo Feussner, Ralph Panstruga
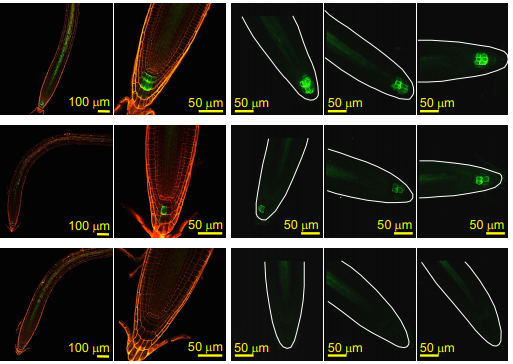
Cytoskeleton dynamics control early events of lateral root initiation in Arabidopsis
Amaya Vilches Barro, Dorothee Stoeckle, Martha Thellmann, Paola Ruiz Duarte, Lotte Bald, Marion Louveaux, Patrick von Born, Philipp Denninger, Tatsuaki Goh, Hidehiro Fukaki, Joop Vermeer, Alexis Maizel
mRNA adenosine methylase (MTA) deposits m6A on pri-miRNAs to modulate miRNA biogenesis in Arabidopsis thaliana
Susheel Sagar Bhat, Dawid Bielewicz, Natalia Grzelak, Tomasz Gulanicz, Zsuzsanna Bodi, Lukasz Szewc, Matuesz Bajczyk, Jakub Dolata, Dariusz J. Smolinski, Rupert G. Fray, Artur Jarmolowski, Zofia Szweykowska-Kulinska
Integrating transcriptomic network reconstruction and QTL analyses reveals mechanistic connections between genomic architecture and Brassica rapa development
Robert Leo Baker, Wen Leong, Marcus T Brock, Matthew J Rubin, R. J. Cody Markelz, Stephen Welch, Julin N. Maloof, Cynthia Weinig
An evolutionarily conserved mechanism for production of secondary meristems in land plants
Yukiko Yasui, Shigeyuki Tsukamoto, Tomomi Sugaya, Ryuichi Nishihama, Quan Wang, Katsuyuki T. Yamato, Hidehiro Fukaki, Tetsuro Mimura, Hiroyoshi Kubo, Klaus Theres, Takayuki Kohchi, Kimitsune Ishizaki
MCM2 partial silencing inhibits apical dominance and promotes chlorophyll pigmentation in tomato
Ma-ye Gao, Jin Liang, Hai-ting Liu, Di-an Ni
Elevated CO2 induces age-dependent restoration of growth and metabolism in gibberellin-deficient plants
Karla Gasparini, Lucas C. Costa, Fred A. L. Brito, Thaline M. Pimenta, Flávio B. Cardoso, Wagner L. Araujo, Agustin Zsögön, Dimas M. Ribeiro
OsLUGL involved in floral development through regulating auxin level and OsARFs expression in rice (Oryza sative L.)
Chunyan Yang, Dianli Li, Xingjie Zhu, Ziyao Wei, Zhiming Feng, Long Zhang, Jun He, Xi Liu, Changling Mou, Ling Jiang, Jianmin Wan
OsCYP71D8L as a key regulator involved in growth and stress response by mediating gibberellins and cytokinins homeostasis in rice
Jiahao Zhou, Zeyu Li, Guiqing Xiao, Rongfeng Huang, Haiwen Zhang
Comparative biomechanical characterization of maize brace roots within and between plants
Lindsay Erndwein, Elahe Ganji, Megan Leigh Killian, Erin E. Sparks
GNI-A1 mediates trade-off between grain number and grain weight in tetraploid wheat
Guy Golan, Idan Ayalon, Aviad Perry, Gil Zimran, Toluwanimi Ade-Ajayi, Assaf Mosquna, Assaf Distelfeld, Zvi Peleg
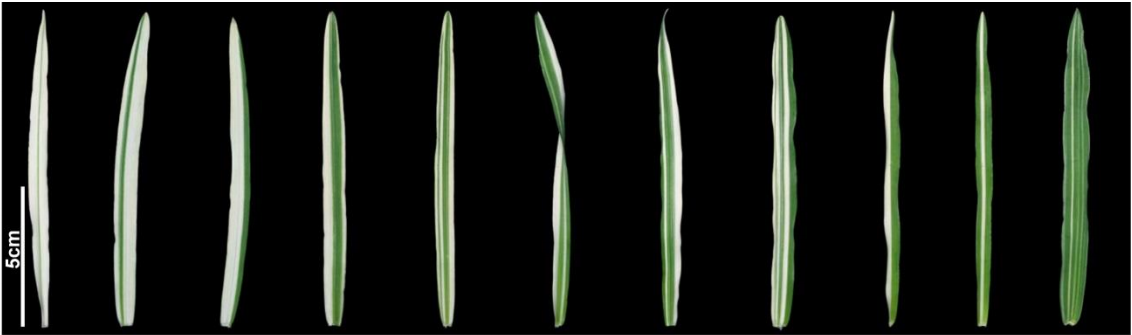
Leaf Variegation and Impaired Chloroplast Development Caused by a Truncated CCT Domain gene in albostrians Barley
Mingjiu Li, Goetz Hensel, Martin Mascher, Michael Melzer, Nagaveni Budhagatapalli, Twan Rutten, Axel Himmelbach, Sebastian Beier, Viktor Korzun, Jochen Kumlehn, Thomas Boerner, Nils Stein
Identification of transgene-free CRISPR edited plants of rice and tomato by monitoring DsRED fluorescence in dry seeds
Norma Aliaga-Franco, Cunjin Zhang, Silvia Presa, Anjil K. Srivastava, Antonio Granell, David Alabadi, Ari Sadanandom, Miguel A. Blazquez, Eugenio G. Minguet
DNA Nanostructures Coordinate Gene Silencing in Mature Plants
Huan Zhang, Gozde S Demirer, Honglu Zhang, Tianzheng Ye, Natalie S Goh, Abhishek J Aditham, Francis J Cunningham, Chunhai Fan, Markita Landry
A short history of Arabidopsis thaliana (L.) Heynh. Columbia-0
Marc Somssich
A short history of the CaMV 35S promoter
Marc Somssich
A short history of plant transformation
Marc Somssich
Evo-devo & evo
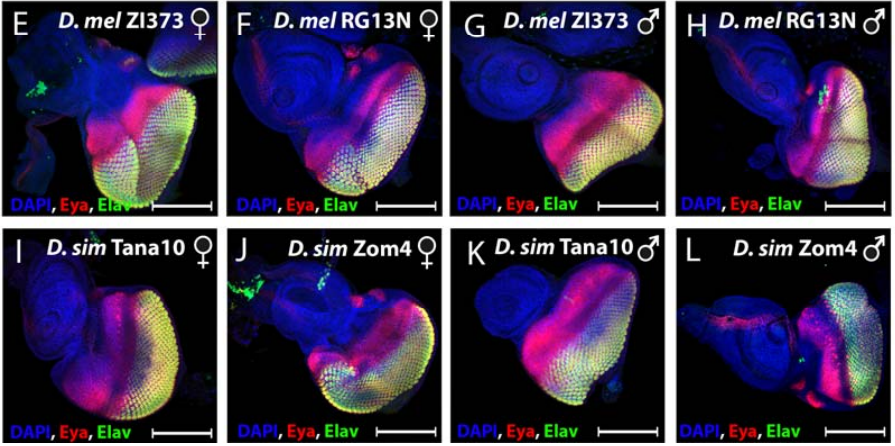
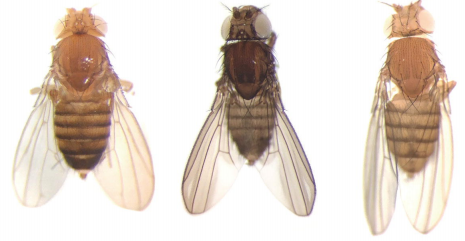
Characterisation of the genetic architecture underlying eye size variation within Drosophila melanogaster and Drosophila simulans
Pedro Gaspar, Saad Arif, Lauren Sumner-Rooney, Maike Kittelmann, David L Stern, Maria D S Nunes, Alistair P McGregor
Repeated evolution of asymmetric genitalia and right-sided mating behavior in the Drosophila nannoptera species group
Andrea Acurio, Flor Tobias Rhebergen, Sarah Esther Paulus, Virginie Courtier-Orgogozo, Michael Lang
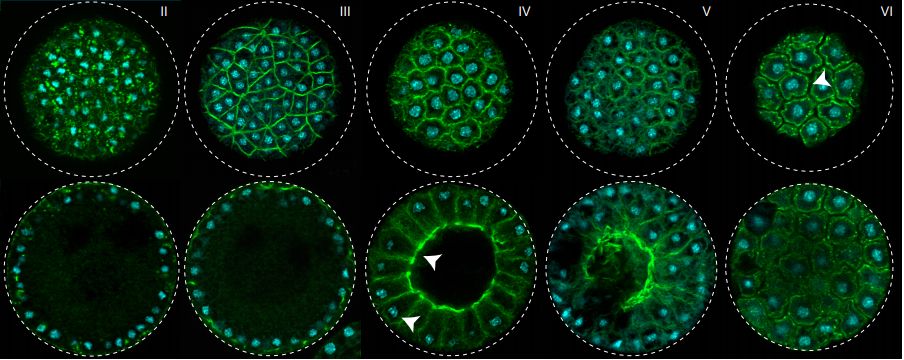
A unicellular relative of animals generates an epithelium-like cell layer by actomyosin-dependent cellularization
Omaya Dudin, Andrej Ondracka, Xavier Grau-Bové, Arthur A.B. Haraldsen, Atsushi Toyoda, Hiroshi Suga, Jon Bråte, Iñaki Ruiz-Trillo
Ecological advantages and evolutionary limitations of aggregative multicellular development
Jennifer T Pentz, Pedro Márquez-Zacarías, Peter J Yunker, Eric Libby, William C Ratcliff
Krüppel-like factor gene function in the ctenophore Mnemiopsis suggests an ancient role in promoting cell proliferation in metazoan stem cell niches
Jason S Presnell, William E Browne
Possible co-option of a VEGF-driven tubulogenesis program for biomineralization in echinoderms
Smadar Ben-Tabou de-Leon, Tsvia Gildor, Noa Sher, Modi Roopin, Miri Morgulis, Assaf Malik, Monica Dines, Maya Lalzar, Lama Khalaily
Glass confers rhabdomeric photoreceptor identity in Drosophila, but not across all metazoans
F. Javier Bernardo-Garcia, Maryam Syed, Gaspar Jekely, Simon G Sprecher
Heart development in the lizards (Varanidae) with the greatest extent of ventricular septation
Jermo Hanemaaijer, Martina Gregorovicova, Jan Nielsen, Antoon Moorman, Tobias Wang, R. Nils Planken, Vincent Christoffels, David Sedmera, Bjarke Jensen
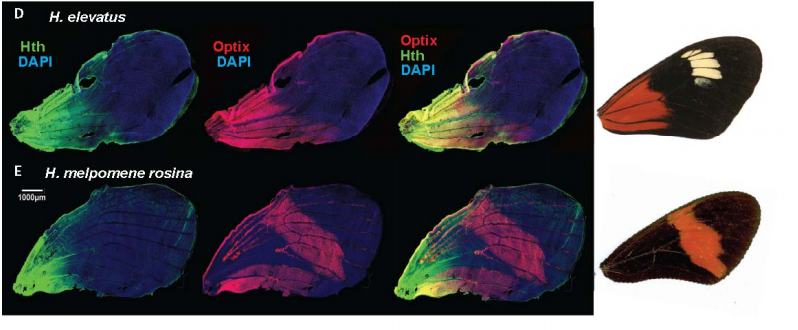
Conservation and flexibility in the gene regulatory landscape of Heliconiine butterfly wings
Joseph J Hanly, Richard WR Wallbank, W Owen McMillan, Chris D Jiggins
Developmental plasticity in metabolism but not in energy reserve accumulation in a seasonally polyphenic butterfly
Sami Kivelä, Karl Gotthard, Philipp Lehmann
Unmatched level of molecular convergence among deeply divergent complex multicellular fungi
Zsolt Merenyi, Arun N Prasanna, Wang Zheng, Karoly Kovacs, Botond Hegedus, Balazs Balint, Balazs Papp, Jeffrey P Townsend, Laszlo G Nagy
Comparative genomics reveals the origin of fungal hyphae and multicellularity
Eniko Kiss, Botond Hegedis, Torda Varga, Zsolt Merenyi, Tamas Koszo, Balazs Balint, Arun N. Prasanna, Krisztina Krizsan, Meritxell Riquelme, Norio Takeshita, Laszlo G. Nagy
Evolution of life cycles and reproductive traits: insights from the brown algae
Svenja Heesch, Martha Serrano-Serrano, Remy Luthringer, Akira F Peters, Christophe Destombe, J Mark Cock, Myriam Valero, Denis Roze, Nicolas Salamin, susana m coelho
Does Long-Term Selection for Development Time Result in Canalization: A Test Using Drosophila melanogaster
Shampa M. Ghosh, K. M. Satish, J. Mohan, Amitabh Joshi
Vitellogenin expression in the ovaries of adult honeybee workers provides insights into the evolution of reproductive and social traits
Carlos Cardoso Junior, Benjamin Oldroyd, Isobel Ronai
Hybrid misexpression in multiple developing tissues within a recent adaptive radiation of Cyprinodon pupfishes
Joseph Alan McGirr, Christopher Herbert Martin
The genome and mRNA transcriptome of the cosmopolitan calanoid copepod Acartia tonsa Dana improve the understanding of copepod genome size evolution
Tue Sparholt Jorgensen, Bent Petersen, H. Cecilie B. Petersen, Patrick Denis Browne, Stefan Prost, Jonathon Stillman, Lars Hestbjerg Hansen, Benni Winding Hansen
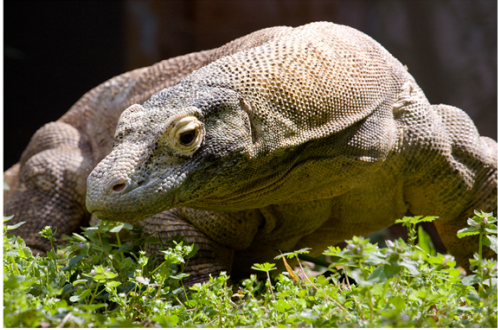
A high-resolution, chromosome-assigned Komodo dragon genome reveals adaptations in the cardiovascular, muscular, and chemosensory systems of monitor lizards
Abigail Lind, Yvonne Y.Y. Lai, Yulia Mostovoy, Alisha K Holloway, Alessio Iannucci, Angel CY Mak, Marco Fondi, Valerio Orlandini, Walter L Eckalbar, Massimo Milan, Michail Rovatsos, Ilya G. Kichigin, Alex I Makunin, Martina Pokorna, Marie Altmanova, Vladimir Trifonov, Elio Schijlen, Lukas Kratochvil, Renato Fani, Tim S Jessop, Tomaso Patarnello, James W Hicks, Oliver A. Ryder, Joseph R. Mendelson III, Claudio Ciofi, Pui-Yan A. Kwok, Katherine S Pollard, Benoit Bruneau
Genome of the parasitoid wasp Diachasma alloeum, an emerging model for ecological speciation and transitions to asexual reproduction
Eric Tvedte, Kimberly KO Walden, Kyle E McElroy, John Werren, Andrew A Forbes, Glen R Hood, John M Logsdon, Jeffrey L Feder, Hugh M Robertson
Cell biology
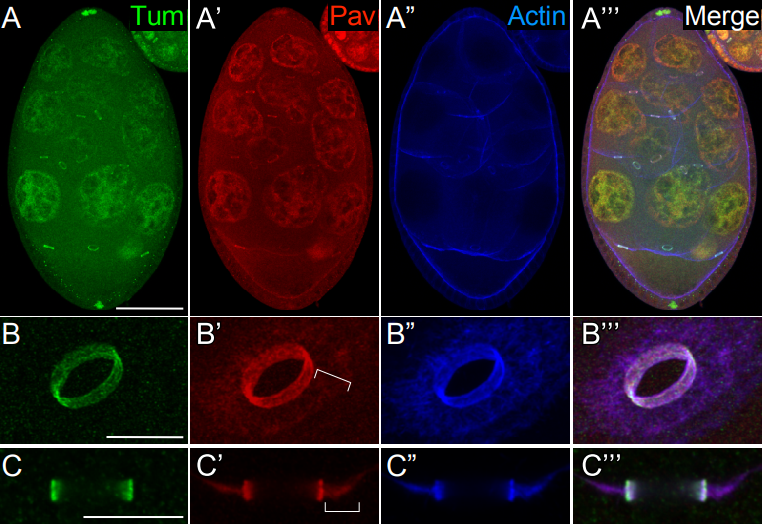
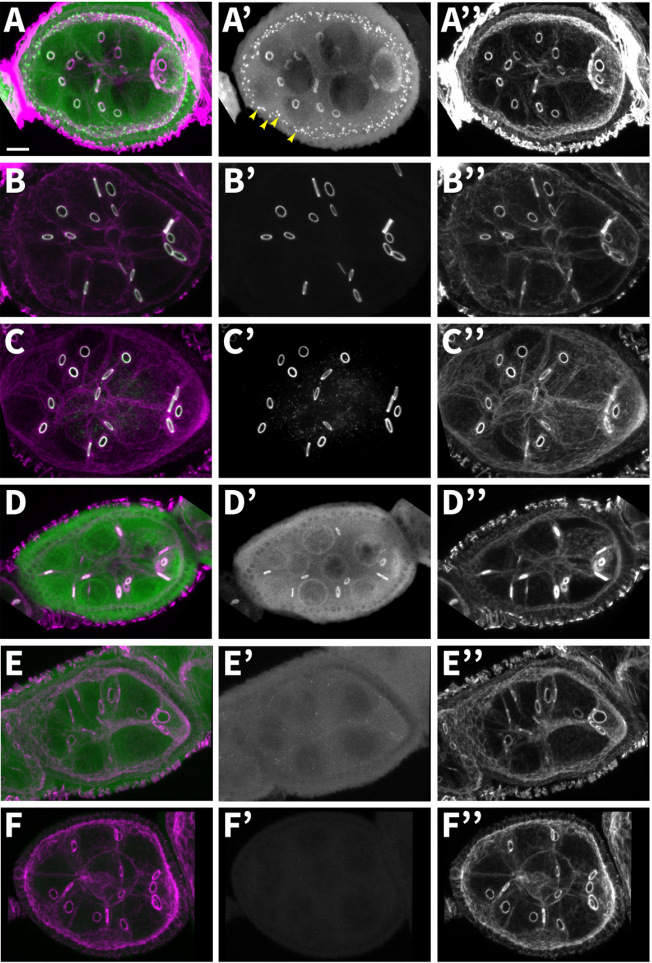
The kinesin-like protein Pavarotti functions non-canonically to regulate actin dynamics
Mitsutoshi Nakamura, Jeffrey M Verboon, Clara L Prentiss, Susan M Parkhurst
Epigenetic inheritance of centromere identity in a heterologous system
Virginie Roure, Bethan Medina-Pritchard, Eduard Anselm, A. Arockia Jeyaprakash, Patrick Heun
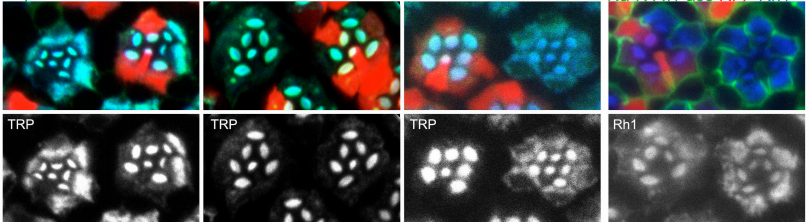
A Rab11-GEF Parcas recruits Rab11 onto recycling endosomes for rhodopsin transport in Drosophila photoreceptors
Yuna Otsuka, Takunori Satoh, Nozomi Nakayama, Ryota Inaba, Akiko Kono Satoh
SWITCH 1/DYAD is a novel WINGS APART-LIKE antagonist that maintains sister chromatid cohesion in meiosis
Chao Yang, Yuki Hamamura, Kostika Sofroni, Franziska Boewer, Sara Christina Stolze, Hirofumi Nakagami, Arp Schnittger
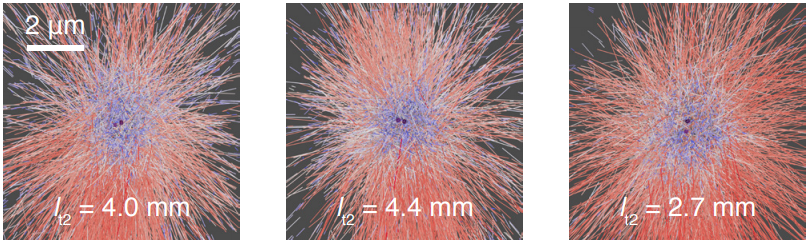
Soluble tubulin is locally enriched at mitotic centrosomes in C. elegans
Johannes Baumgart, Marcel Kirchner, Stefanie Redemann, Jeffrey Woodruff, Jean-Marc Verbavatz, Frank Julicher, Anthony Hyman, Thomas Mueller-Reichert, Jan Brugues
A telomerase with novel non-canonical roles: TERT controls cellular aggregation and tissue size in Dictyostelium
Nasna Nassir, Geoff J Hyde, Ramamurthy Baskar
Phosphorylation of Nephrin induces phase separated domains that move through actomyosin contraction
Soyeon Kim, Joseph M Kalappurakkal, Satyajit Mayor, Michael K Rosen
Axonemal doublet microtubules can split into two complete singlets in human sperm flagellum tips
Davide Zabeo, Jacob T Croft, Johanna L Hoog
The elusive actin cytoskeleton of a green alga expressing both conventional and divergent actins
Evan W. Craig, David M. Mueller, Miroslava Schaffer, Benjamin D. Engel, Prachee Avasthi
RanGTP regulates cilium formation and ciliary trafficking of a kinesin-II subunit independent of its nuclear functions
Shengping Huang, Prachee Avasthi
The Piezo channel is used by migrating cells to sense compressive load
Nishit Srivastava, David Traynor, Alexandre Kabla, Rob Kay
Modelling
Information Flow in Planar Polarity
Katherine H. Fisher, David I. Strutt, Alexander G. Fletcher
Mechanochemical coupling and junctional forces during collective cell migration
Justin Bui, Daniel E Conway, Rebecca L Heise, Seth H Weinberg
Bridging the gap between single cell migration and collective dynamics
Florian Thueroff, Andriy Goychuk, Matthias Reiter, Erwin Frey
Modeling cell shape diversity arising from complex Rho GTPase dynamics
Cole Zmurchok, William R Holmes
Testing models of mRNA localization reveals robustness regulated by reducing transport between cells
Jonathan U Harrison, Richard M Parton, Ilan Davis, Ruth E Baker
Abstracted functions for engineering the autonomous growth and formation of patterns
Atri Choksi, Drew Endy
A Spatial Filtering Approach to Biological Patterning
Melinda Liu Perkins, Murat Arcak
Ordered Hexagonal Patterns via Notch-Delta Signaling
David A. Kessler, Herbert Levine, Eial Teomy
Theoretical modeling on CRISPR-coded cell lineages: efficient encoding and optimal reconstruction
Ken Sugino, Jorge Garcia Marques, Isabel Espinosa Medina, Tzumin Lee
Numerical analysis of a mechanotransduction dynamical model reveals homoclinic bifurcations of extracellular matrix mediated oscillations of the mesenchymal stem cell fate
Katiana Kontolati, Constantinos Siettos

Global Perturbation of Initial Geometry in a Biomechanical Model of Cortical Morphogenesis
Amine Bohi, Xiaoyu Wang, Mariam Al Harrach, Mickael Dinomais, François Rousseau, Julien Lefèvre
Cell pelotons: a model of early evolutionary cell sorting, with application to slime mold D. discoideum
Hugh Trenchard
Discrete Mechanical Growth Model for Plant Tissue
Louis Daniel Weise, Kirsten H.W.J. ten Tusscher
Modeling enamel matrix secretion in mammalian teeth
Teemu J. Hakkinen, S. Susanna Sova, Ian J. Corfe, Leo Tjaderhane, Antti Hannukainen, Jukka Jernvall
Tools & resources
High-density spatial transcriptomics arrays for in situ tissue profiling
Sanja Vickovic, Goekcen Eraslan, Johanna Klughammer, Linnea Stenbeck, Fredrik Salmen, Tarmo Aijo, Richard Bonneau, Ludvig Bergenstraahle, Joshua Gould, Mostafa Ronaghi, Jonas Frisen, Joakim Lundeberg, Aviv Regev, Patrik L Staahl
A novel algorithm for the collective integration of single cell RNA-seq during embryogenesis
Wuming Gong, Bhairab N Singh, Pruthvi Shah, Satyabrata Das, Joshua Theisen, Sunny Chan, Michael Kyba, Mary G Garry, Demetris Yannopoulos, Wei Pan, Daniel J Garry
Evaluation of methods to assign cell type labels to cell clusters from single-cell RNA-sequencing data
J. Javier Diaz-Mejia, Elaine C. Meng, Alexander R. Pico, Sonya A. MacParland, Troy Ketela, Trevor J. Pugh, Gary D. Bader, John H. Morris
Proximity labeling reveals novel interactomes in live Drosophila tissue
Katelynn M Mannix, Rebecca M. Starble, Ronit S. Kaufman, Lynn Cooley
An Interscholastic Network to Generate LexA Enhancer Trap Lines in Drosophila
Lutz Kockel, Catherine Griffin, Yaseen Ahmed, Lauren Fidelak, Arjun Rajan, Ethan P. Gould, Miles Haigney, Benjamin Ralston, Rex J. Tercek, Lara Galligani, Sagar Rao, Lutfi Huq, Hersh K. Bhargava, Ailis C. Dooner, Emily G. Lemmerman, Ruby F. Malusa, Tran H. Nguyen, Julie S. Chung, Sara M. Gregory, Kiyomasa M. Kuwana, Jonathan T. Regenold, Alexander Wei, Jake Ashton, Patrick Dickinson, Kate Martel, Connie Cai, Carissa Chen, Stephen Price, Jeffrey Qiao, David Shepley, Joanna Zhang, Meghana Chalasani, Khanh Nguyen, August Aalto, ByungJun Kim, Erik Tazawa-Goodchild, Amanda Sherwood, Ahmad Rahman, Sum Ying Celeste Wu, Joel Lotzkar, Serena Michaels, Hillary Aristotle, Antigone Clark, Grace Gasper, Evan Xiang, Frieda Luna Schlor, Melissa Lu, Kate Haering, Julia Friberg, Alyssa Kuwana, Jonathan Lee, Alan Liu, Emma Norton, Leena Hamad, Clara Lee, Dara Okeremi, Harry diTullio, Kat Dumoulin, Sun Yu Gordon Chi, Grayson S. Derossi, Rose E. Horowitch, Elias C. Issa, Dan T. Le, Bryce C. Morales, Ayush Noori, Justin Shao, Sophia Cho, Mai N. Hoang, Ian M. Johnson, Katherine C. Lee, Maria Lee, Elizabeth A. Madamidola, Katrina E. Schmitt, Gabriel Byan, Taeyoung Park, Jonathan Chen, Alexi Monovoukas, Madison J. Kang, Tanner McGowan, Joseph J. Walewski, Brennan Simon, Sophia J. Zu, Gregory P. Miller, Kate B. Fitzpatrick, Nicole Lantz, Elizabeth Fox, Jeanette Collette, Richard Kurtz, Chris Duncan, Ryan Palmer, Cheryl Rotondo, Eric Janicki, Townley Chisholm, Anne Rankin, Sangbin Park, Seung K. Kim
Deconstructing the Polymerase Chain Reaction II: An improved workflow and effects on artifact formation and primer degeneracy
Ankur Naqib, Silvana Poggi, Stefan J Green
Highly efficient homology-directed repair using transient CRISPR/Cpf1-geminiviral replicon in tomato
Tien Van Vu, Velu Sivankalyani, Eun-Jung Kim, Mil Thi Tran, Jihae Kim, Yeon Woo Sung, Duong Thi Hai Doan, Jae-Yean Kim
A universal fluorescence-based toolkit for real-time quantification of DNA and RNA nuclease activity
Emily C Sheppard, Sally Rogers, Nicholas J Harmer, Richard Chahwan
Micro-indentation and optical coherence tomography for the mechanical characterization of embryos: Experimental setup and measurements on fixed chicken embryos.
Marica Marrese, Nelda Antonovaite, Ben K.A. Nelemans, Theodoor H. Smit, Davide Iannuzzi
Automated high-throughput heart rate measurement in medaka and zebrafish embryos under physiological conditions
Jakob Gierten, Christian Pylatiuk, Omar T Hammouda, Christian Schock, Johannes Stegmaier, Joachim Wittbrodt, Jochen Gehrig, Felix Loosli
Easy Two-Photon Image Scanning Microscopy with SPAD Array and Blind Image Reconstruction
Sami Valteri Koho, Eli Slenders, Giorgio Tortarolo, Marco Castello, Mauro Buttafava, Federica Villa, Elena Tcarenkova, Marcel Ameloot, Paolo Bianchini, Colin J.R. Sheppard, Alberto Diaspro, Alberto Tosi, Giuseppe Vicidomini
Multi-immersion open-top light-sheet microscope for high-throughput imaging of cleared tissues
Adam K. Glaser, Nicholas P. Reder, Ye Chen, Chengbo Yin, Linpeng Wei, Soyoung Kang, Lindsey A. Barner, Weisi Xie, Erin F. McCarty, Chenyi Mao, Aaron R. Halpern, Caleb R. Stoltzfus, Jonathan S. Daniels, Michael Y. Gerner, Philip R Nicovich, Joshua C. Vaughan, Lawrence D. True, Jonathan T.C. Liu
Ultra-thin fluorocarbon foils optimize multiscale imaging of three-dimensional native and optically cleared specimens
Katharina Hoette, Michael Koch, Lotta Hof, Marcel Tuppi, Till Moreth, Ernst H.K. Stelzer, Francesco Pampaloni
Optimised FRET pairs and quantification approaches to detect the activation of Aurora kinase A at mitosis
Giulia Bertolin, Florian Sizaire, Claire Demeautis, Catherine Chapuis, Fabienne Merola, Marie Erard, Marc Tramier
BioCell2XML: A novel tool for converting cell lineage data from SIMI BioCell to MaMuT (Fiji)
Markus Pennerstorfer, Günther Loose, Carsten Wolff
Research practice & education
Hypothesis, analysis and synthesis: it’s all Greek to me!
Ioannis Iliopoulos, Sophia Ananiadou, Antoine Danchin, John PA Ioannidis, Peter D Katsikis, Christos A Ouzounis, Vasilis J Promponas
“Blacklists” and “whitelists” to tackle predatory publishing : A cross-sectional comparison and thematic analysis
Michaela Strinzel, Anna Severin, Katrin Milzow, Matthias Egger
A data-driven approach to selecting invited speakers at conferences: a step toward gender parity
Ann-Maree Vallence, Mark R Hinder, Hakeui Fujiyama
Where do our graduates go? A toolkit for retrospective and ongoing career outcomes data collection for biomedical PhD students and postdoctoral scholars
Elizabeth A. Silva, Alicia B. Mejía, Elizabeth S. Watkins
Twenty steps towards an adequate inferential interpretation of p-values
Norbert Hirschauer, Sven Grüner, Oliver Mußhoff, Claudia Becker
Bionet at 30 years of open science communication
Donald Gilbert
Who Bears the Burden of Long-Lived Molecular Biology Databases?
Heidi J Imker
Perceptions and Prospects in Life Sciences in a Heterogeneous Latin American Population
Leonardo M.R. Ferreira, Giovanni A. Carosso, Bruno Lopez-Videla, Gustavo Vaca Diez, Laura Ines Rivera-Betancourt, Yara Rodriguez, Dalila G. Ordonez, Natalia Montellano Duran, Diana K. Alatriste-Gonzalez, Aldo Vacaflores, Soad Bohorquez, Lilian Gonzalez Auza, Christian Schuetz, Carolina Alexander-Savino, Omar Gandarilla Cuellar, Mohammed Andres Mostajo Radji
Why not…
it just had to be….

Crowdfunded whole-genome sequencing of the celebrity cat Lil BUB identifies causal mutations for her osteopetrosis and polydactyly
Mike Bridavsky, Heiner Kuhl, Arthur Woodruf, Uwe Kornak, Bernd Timmermann, Norbert Mages, 99 Lives Consortium, Darío G Lupiáñez, Orsolya Symmons, Daniel M Ibrahim
 (4 votes)
 (No Ratings Yet)

 (3 votes)