Qualifications: Applicants should possess a Ph.D. in a relevant field, such as Biology, Biochemistry, Genetics or another related discipline and be highly motivated, independent and organized. Successful applicants will have a record of communicating research results via publications and/or professional presentations, and be willing and able to participate in collaborative, interdisciplinary research projects. Experience in developmental biology, cell and molecular biology and avian/murine model systems is desirable. Preference will be given to applicants with a proven record in craniofacial research.
Please submit your application to Dr. Brugmann with the following information: A cover letter, a statement of research interests, and a CV with contact details for 3 referees.
Cincinnati Children’s Hospital Medical Center (CCHMC) is a premier pediatric research institution with over 900 diverse and productive faculty members. Here, researchers work collaboratively across specialties and divisions to address some of the biggest challenges we face today in improving child health. A strong network of research support services and facilities, along with institutional commitment to research, push our team of faculty, postdocs and support staff to explore the boundaries of what is possible, leading to significant breakthroughs. We are driven by our mission to improve child health and transform the delivery of care through fully integrated, globally recognized research, education and innovation.
For further information about working at CCHMC or living in Cincinnati, please contact the CCHMC Postdoc recruiter, Uma Sivaprasad, PhD, at research@cchmc.org
Applications are invited from highly motivated individuals dedicated to peruse a PhD and who are interested in nerve/tumour interactions and nervous system development.
PROJECT DESCRIPTION
During tumour progression nerves and tumours interact resulting in tumour cells using nerves as a metastatic route out of the organ, through a process called perineural invasion (PNI). While this is robustly documented at a histological level, the molecular mechanisms underling this, remain poorly understood. You will join an interdisciplinary collaborative team focusing on the signalling between nerves and tumours, leading to provocation of nerve plasticity (such as growth and remodelling) and tumour metastasis via nerves. You will engage a systematic strategy to identify these mechanisms by (i) examining how nerves form/grow/remodel and migrate normally during embryo development and (ii) pathologically in tumour models with an initial focus on pancreatic ductal adenocarcinoma (PDAC). The formal PhD qualification you will obtain is a PhD in medical science with a focus on cell biology.
LOCATION
The laboratory is located at IMB, Umeå University, Sweden. IMB is an interdisciplinary department, which focuses on questions in basic and medical sciences and provides an interactive modern environment with good core facilities within the wider university. The working ‘day to day’ language in the laboratory is English. The position is for 4 years and is fully funded.
Following our latest data release, the DMDD website (dmdd.org.uk) now contains detailed phenotype data for nearly 700 embryos from 82 different knockout mouse lines. Highlights include the identification of limb defects and cysts in Col4a2 knockouts and replication of the major features of Meckel syndrome in B9d2 knockouts.
We have begun to add immunohistochemistry image data for the brain and spinal cord of some embryos at E18.5. These images give further information about lines in which the embryos appeared morphologically normal at E14.5, but were still not viable. We have also added viability data for every line at both E9.5 and E14.5.
Together with the placental phenotype data that we hold for more than 100 knockout lines, the DMDD website is a rich resource for those investigating the effect of gene mutations on embryo development, and may provide clues about the genetic basis of rare diseases.
LIMB DEFECTS SEEN IN Col4a2 KNOCKOUTS
In humans, COL4A2 mutations have been linked to porencephaly, a rare disorder with phenotypes that include the development of intracranial cysts. In the latest DMDD data, Col4a2 knockouts have a variety of nervous system disorders in line with porencephaly. However, all four embryos also show abnormal autopod morphology and cysts between the nasal septum and the oral cavity, as well as other morphological defects.
A Col4a2 knockout embryo has a cyst between the nasal septum and oral cavity (left) and abnormal autopod morphology (right). The individual fingers don’t diverge distally and can’t be discerned from an external view.
B9d2 KNOCKOUTS MODEL MECKEL SYNDROME
In humans, mutations of the gene B9D2 have been linked to Meckel syndrome, a severe disorder caused by dysfunction of the primary cilia during the early stages of embryogenesis. Meckel syndrome is characterised by multiple kidney cysts, occipital encephalocele (where a portion of the brain protrudes through an opening in the skull) and polydactyly, but it also commonly affects the brain and spinal cord, eyes, heart, lungs and bones.
B9d2 knockout mouse embryos included in our latest data release show the major features of Meckel syndrome, including polydactyly and defects in the brain, peripheral nervous system, heart and vascular system. They also display situs defects, where the left-right asymmetry of the body did not develop as expected. The image below shows a B9d2 knockout embryo with left pulmonary isomerism and symmetric branching of the principle bronchi from the trachea.
A B9d2 embryo showing situs defects (left). A magnified view (right) shows that both lungs have developed with a single-lobe structure. In mice the left lung usually has one lobe, while the right lung has four. In addition, the principle bronchi (red arrows) have branched symmetrically from the trachea. This branching would normally have a distinct asymmetry.
NEURAL IMAGE DATA NOW AVAILABLE
In around 20% of embryonic lethal lines, embryos appear morphologically normal at E14.5 but still go on to die before or shortly after birth. To understand more about why these embryos were not viable, DMDD colleagues Professor Corinne Houart and Dr Ihssane Bouybayoune at Kings College London analysed the lines at E18.5 – when embryo development is almost complete. They used immunohistochemistry to identify abnormalities in the brain and spinal cord that could not be picked up in our standard, whole-embryo morphological analyses. This data is now available for the line Trappc9, and additional lines will be added in future data releases.
Immunohistochemistry analysis of the brains of two Trappc9 knockout mice. The calretinin (green) + neurofilament (red) combined stain highlights interneurons and axons, while Hoechst (blue) is a nuclear stain.
Neural images are available as 20-micron sections through the brain and spinal cord, and the images from different embryos can be compared side by side using the stack viewer. A separate Nissl stain was used to highlight neural death and these images can also be explored online.
Development is pleased to welcome submissions for an upcoming special issue on ‘Development at the single cell level’. This special issue aims to showcase the best research in stem cell and developmental biology, building on the rapidly evolving tools of single cell analysis. The issue will be guest-edited by Allon Klein and Barbara Treutlein, working alongside our team of academic editors.
Embryonic development and stem cell differentiation are inherently multicellular phenomena, and every cell can have an important story to tell. The analysis of developmental and stem cell biology at single cell resolution has a long and distinguished history, for example in tracing the lineage of tissues, defining concepts such as commitment, and revealing the existence of adult stem cells. More recently, innovations in single cell transcriptomic, genomic, live imaging and quantitative approaches have opened up new questions about the nature of developmental and stem cell hierarchies, the repertoire of differentiating cell types in tissues and the functional and mechanistic basis of cell types. These new analytical tools are rapidly evolving. They include not just descriptive methods but also fate-tracing and perturbative approaches. They hold promise not just in providing a deeper understanding of cell fate specification and commitment in a native context, but also for understanding and controlling differentiation, de-differentiation and trans-differentiation in vitro and in disease contexts.
Development is the natural home for papers applying single cell analytical and perturbative methods to gain insights into developmental biology and stem cells. We invite you to showcase your breakthrough research that has either been driven by the creative application of single cell approaches; or has created a novel single cell methodology for developmental and stem cell systems.
We also welcome proposals for review-type articles for this special issue. Please send us a short synopsis detailing the scope and structure of the proposed article, and including key references. The deadline for submission of proposals is August 15th and reviews must be submitted by October 31st.
The issue will be published in mid-2019 (note that, in our new ‘continuous publication‘ model, we will be able to publish your article as soon as it is accepted; you will not have to wait for the rest of the issue to be ready) and the deadline for submission of articles is October 31st*. This special issue will be widely promoted online and at key global conferences – guaranteeing maximum exposure for your work. Please refer to our author guidelines for information on preparing your manuscript for Development, and submit via our online submission system. Please highlight in your cover letter that the submission is to be considered for this special issue. Prospective authors are welcome to send presubmission enquiries, or direct any queries, to dev.specialissue@biologists.com
*Please note that not all articles accepted for publication will be included in the special issue; they may instead by published in earlier or later issues of the journal.
Why choose Development?
Submissions handled by expert academic Editors
Competitive decision speeds and rapid publication
Format-free submission
Strong commitment at first decision – over 95% of invited revisions accepted
Free to publish – no page or colour charges, no hidden fees
Planar cell polarity (PCP) is a fascinating biological problem because it spans such vast biological scales, from nanometers to meters of spatial organization. When we think of PCP – the coordinated polarization of cellular structures across a tissue plane – we often imagine the Drosophila wing, where individual cells produce actin-rich protrusions that point in a uniform orientation. But PCP is also observed in much more complex epithelia like the vertebrate epidermis, where multicellular structures, which produce scales, feathers, or fur, collectively align across the entire skin surface. Although we showed nearly 10 years ago that mammalian hair follicles polarize through the same conserved core PCP pathway that orients Drosophila wing hairs (Devenport and Fuchs, 2008), how these multicellular structures polarize was an intractable question because we lacked the long-term live imaging methods to follow their morphogenesis at cellular resolution.
Movie 1
Enter Team Hair Follicle – a collaboration between two postdocs, Maureen Cetera and Brad Joyce, and a graduate student Liliya Leybova. Through trial and error they figured out that by culturing the embryonic epidermis at an air liquid interface, using a transgenic line expressing bright fluorescent membrane labels (mT/mG) and imaging with a spinning disc confocal to minimize phototoxicity, they could acquire time-lapse movies spanning 24 hours of epidermal development with cellular resolution. The first batch of movies took our breaths away. Never had I dreamed the developing skin would be so dynamic. We never imagined that skin epithelial cells, which we often think of a rigidly adherent with adherens junctions and desmosomes, would behave as if they were fluid and extensively rearrange (Movie 1).
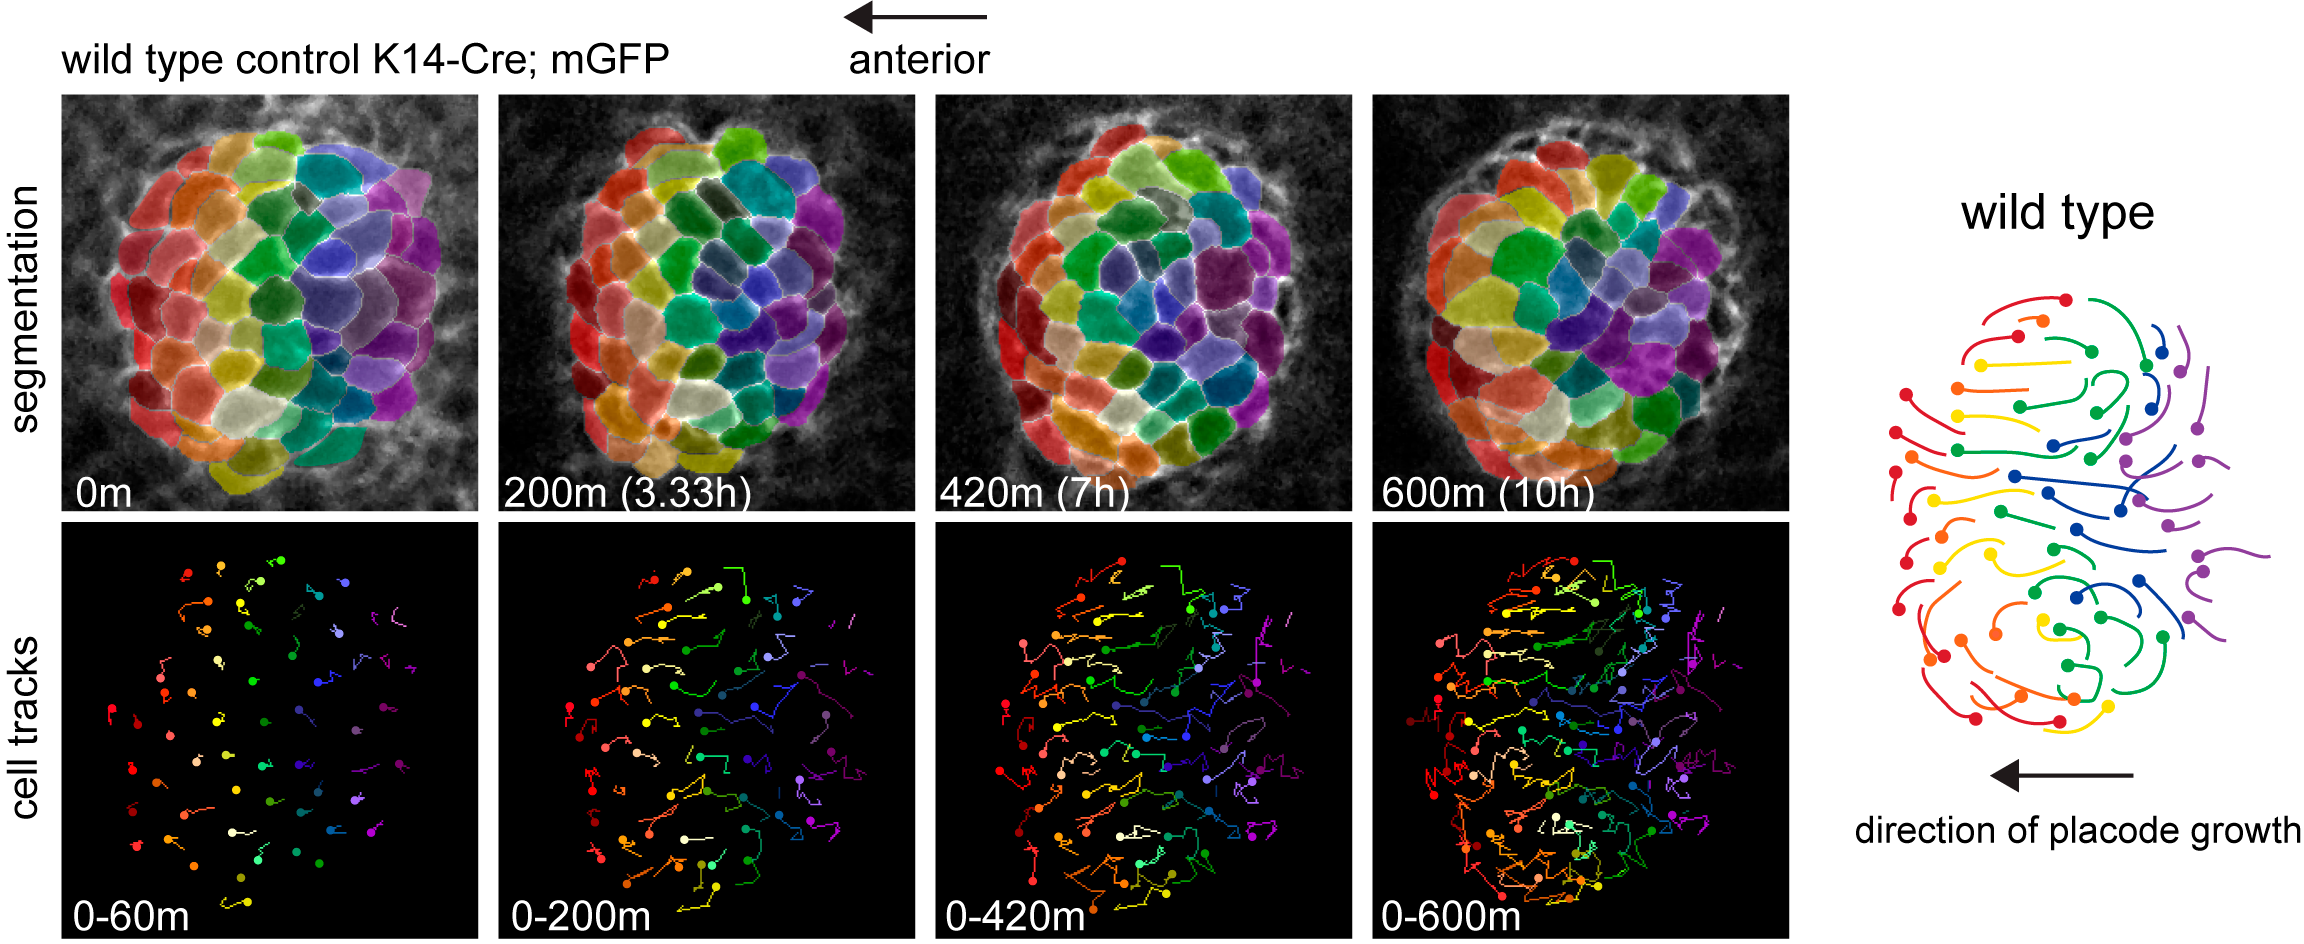
Focusing on a 10-12 hour window of time during which hair placodes polarize, and using automated segmentation and cell tracking, we discovered that during polarization the placode epithelium undergoes extensive rearrangements organized in a counter-rotating pattern (Movie 2-3).
Movie 2
Movie 3
Cells that are positioned centrally move anteriorly to occupy the growing tip of the follicle while more peripheral cells are swept posteriorly and incorporate into the trailing rear (Figure 1).
Figure 1
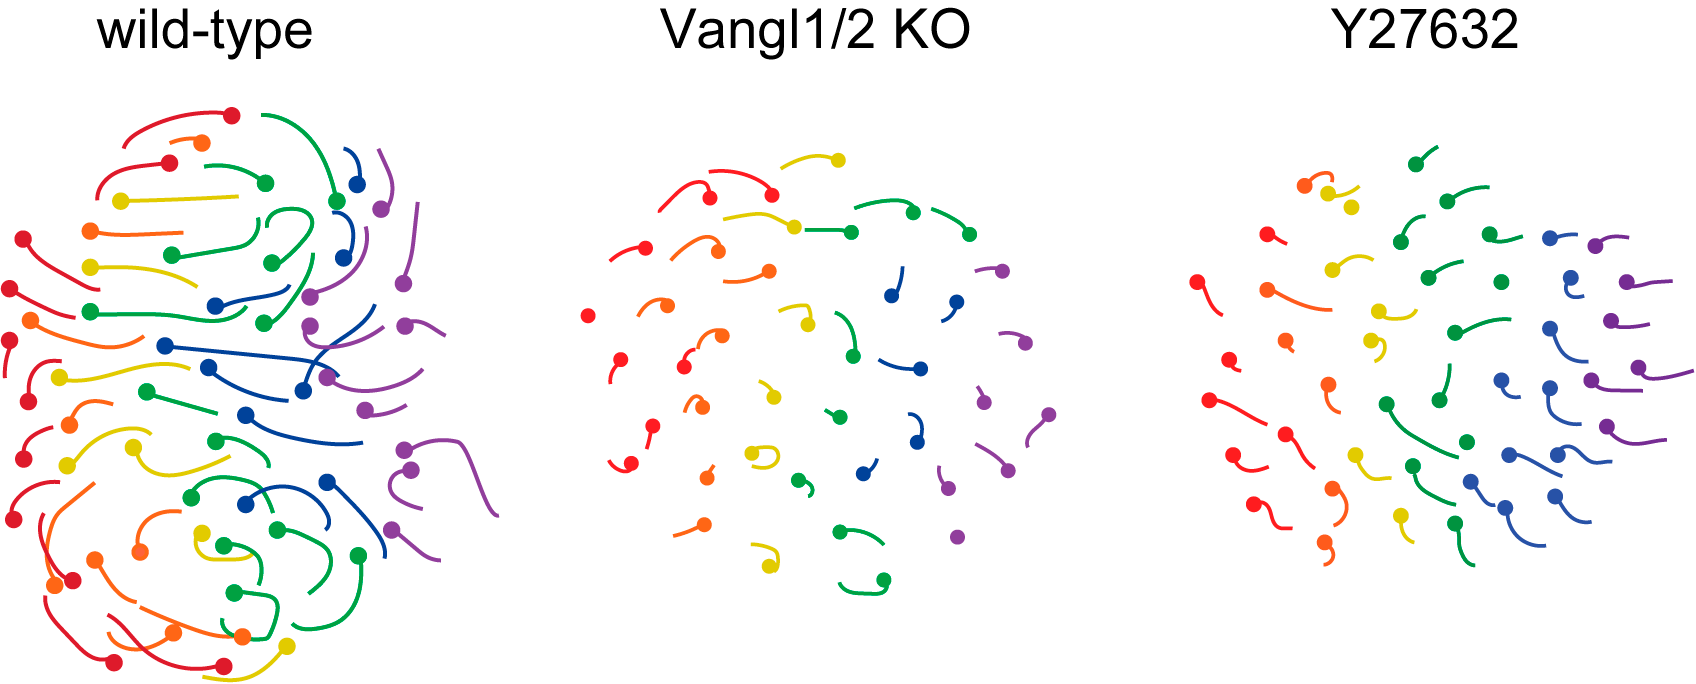
These movements were abolished in the absence of PCP, non-muscle myosin and Rho kinase activities, with the resulting follicles growing vertically rather than anteriorly (Figure 2, Movie 4).
Figure 2
Movie 4
The counter-rotational movements we observed were striking because 1) they explained how the placode gains its morphological asymmetry, by completely remodeling the placode epithelium from a radial to planar polarized organization; and 2) the pattern of movements closely resemble the elaborate ‘polonaise’ movements of gastrulating chick embryos, a process previously linked to the PCP pathway (Voiculescu et al, 2007). During formation of the chick primitive streak, convergent extension in the posterior hemisphere of the embryo displaces cells in the anterior into two counter-rotating flows (Chuai and Weijer, 2008; Rozbicki et al, 2015). It is remarkable that the same pattern of cell movements involving thousands of cells in the chick embryo is made by just a few dozen cells confined within and scattered in a periodic pattern across the skin epithelium.
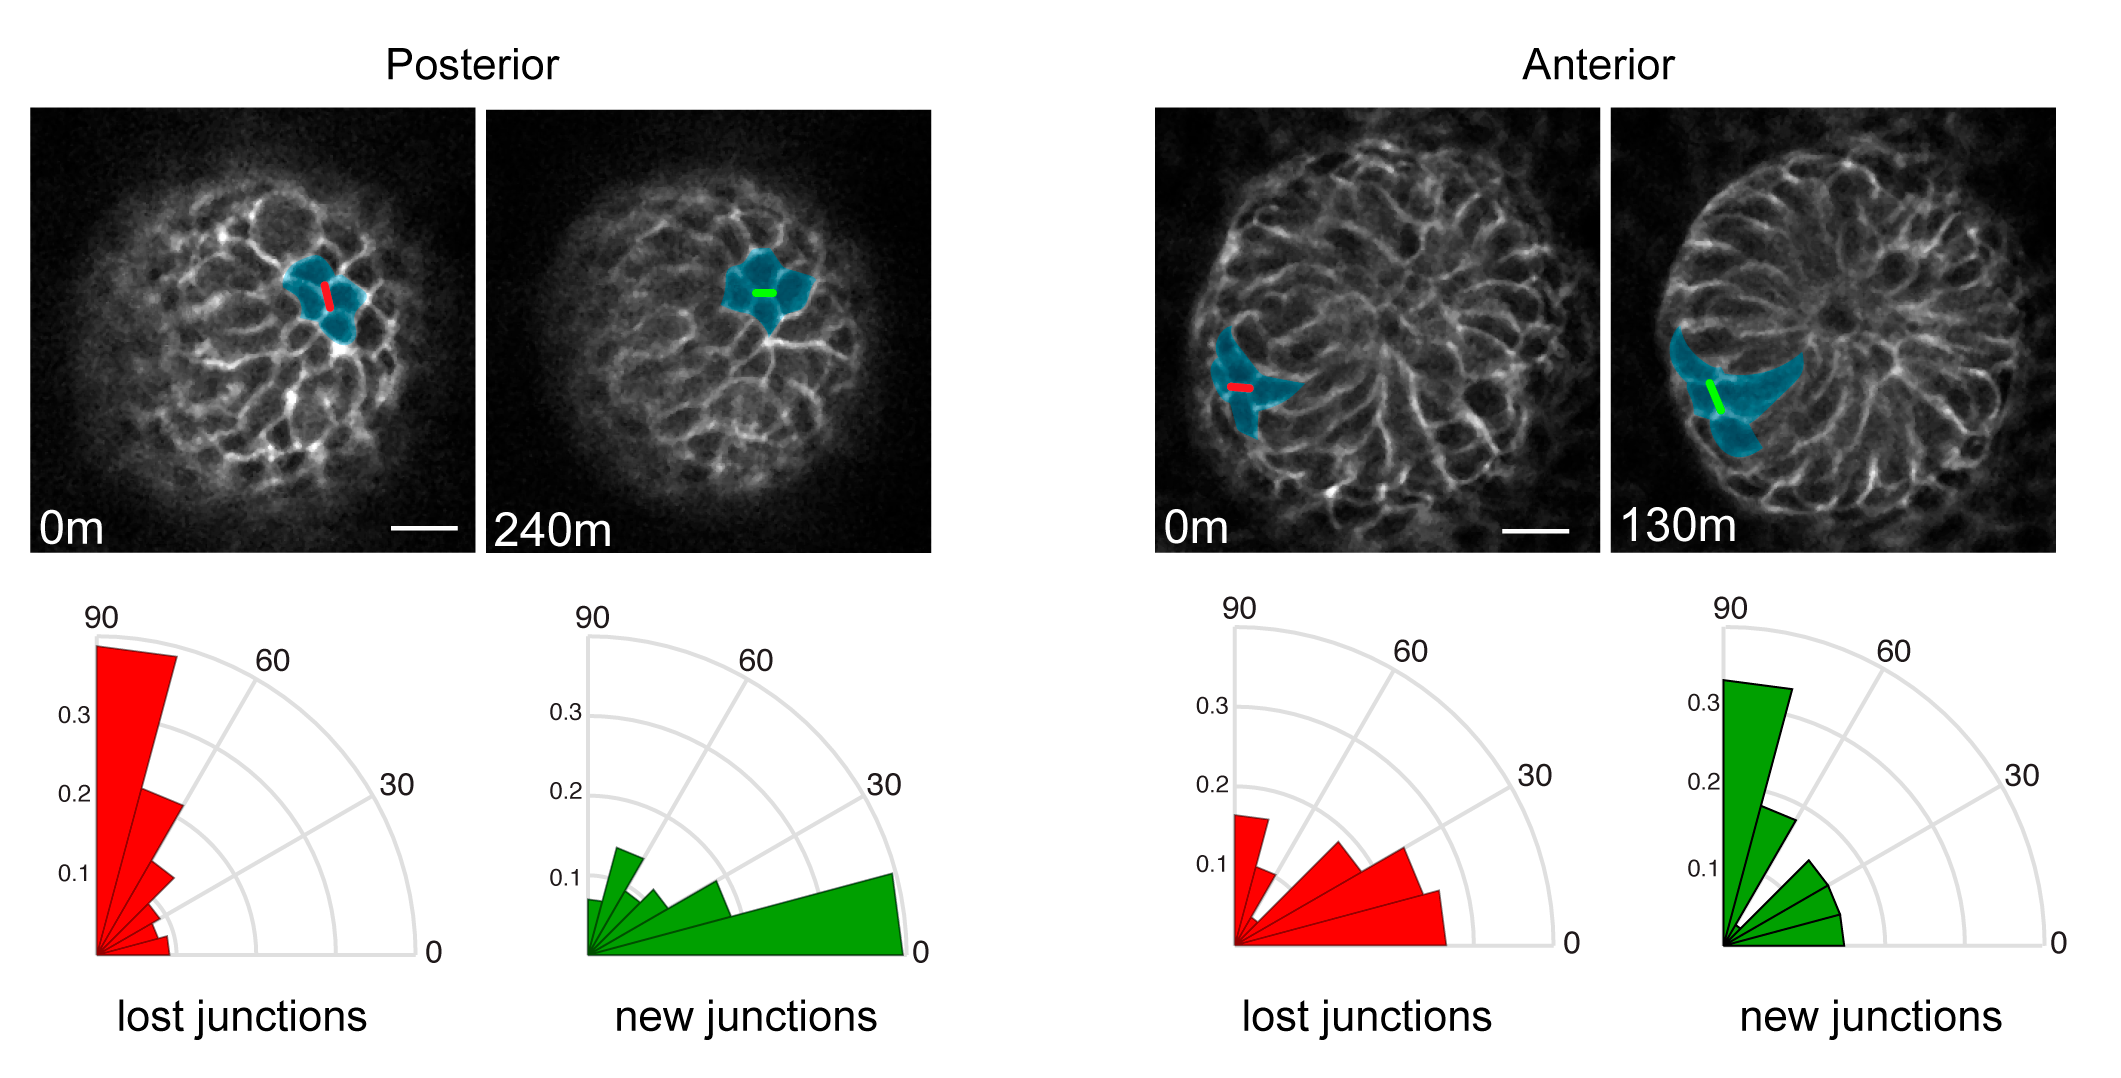
We were then confronted with the difficult task of connecting PCP to the counter-rotating rearrangements we observed. A key feature of the PCP pathway is that its core components, as well as downstream cytoskeletal factors, are asymmetrically localized to intercellular junctions. What was difficult to explain, and will require much more work to fully understand, was how the asymmetry of the core PCP components, which align along a common axis amongst all cells across the skin epithelium, could generate cell movements in opposite directions. So Maureen broke down the collective movement into its local component parts and asked how the asymmetry of PCP components correlated to those behaviors. First, she determined that in the posterior half of the placode, cells intercalate towards the placode midline via polarized shrinking and growth of intercellular junctions (Figure 3). Junctions that were lost tended to be vertically oriented where new junctions formed in a horizontal orientation. In the anterior half, cells also underwent neighbor exchanges but with the opposite polarity so they moved away from the midline and posteriorly (Figure 3).
Figure 3
PCP protein localization correlated with junction shrinkage, even in the anterior half of the placode, where PCP junctions were rotated relative to the AP axis (Figure 4). This reminded us of a result from a previous study where we showed that when cells exchange neighbors through junction remodeling, the local axis of PCP asymmetry rotates relative to its original orientation (Aw et al, 2016). We hypothesized that early remodeling events in the posterior of the placode could cause PCP-enriched junctions to rotate, thereby generating a new PCP axis for junction shrinkage in the anterior.
Figure 4
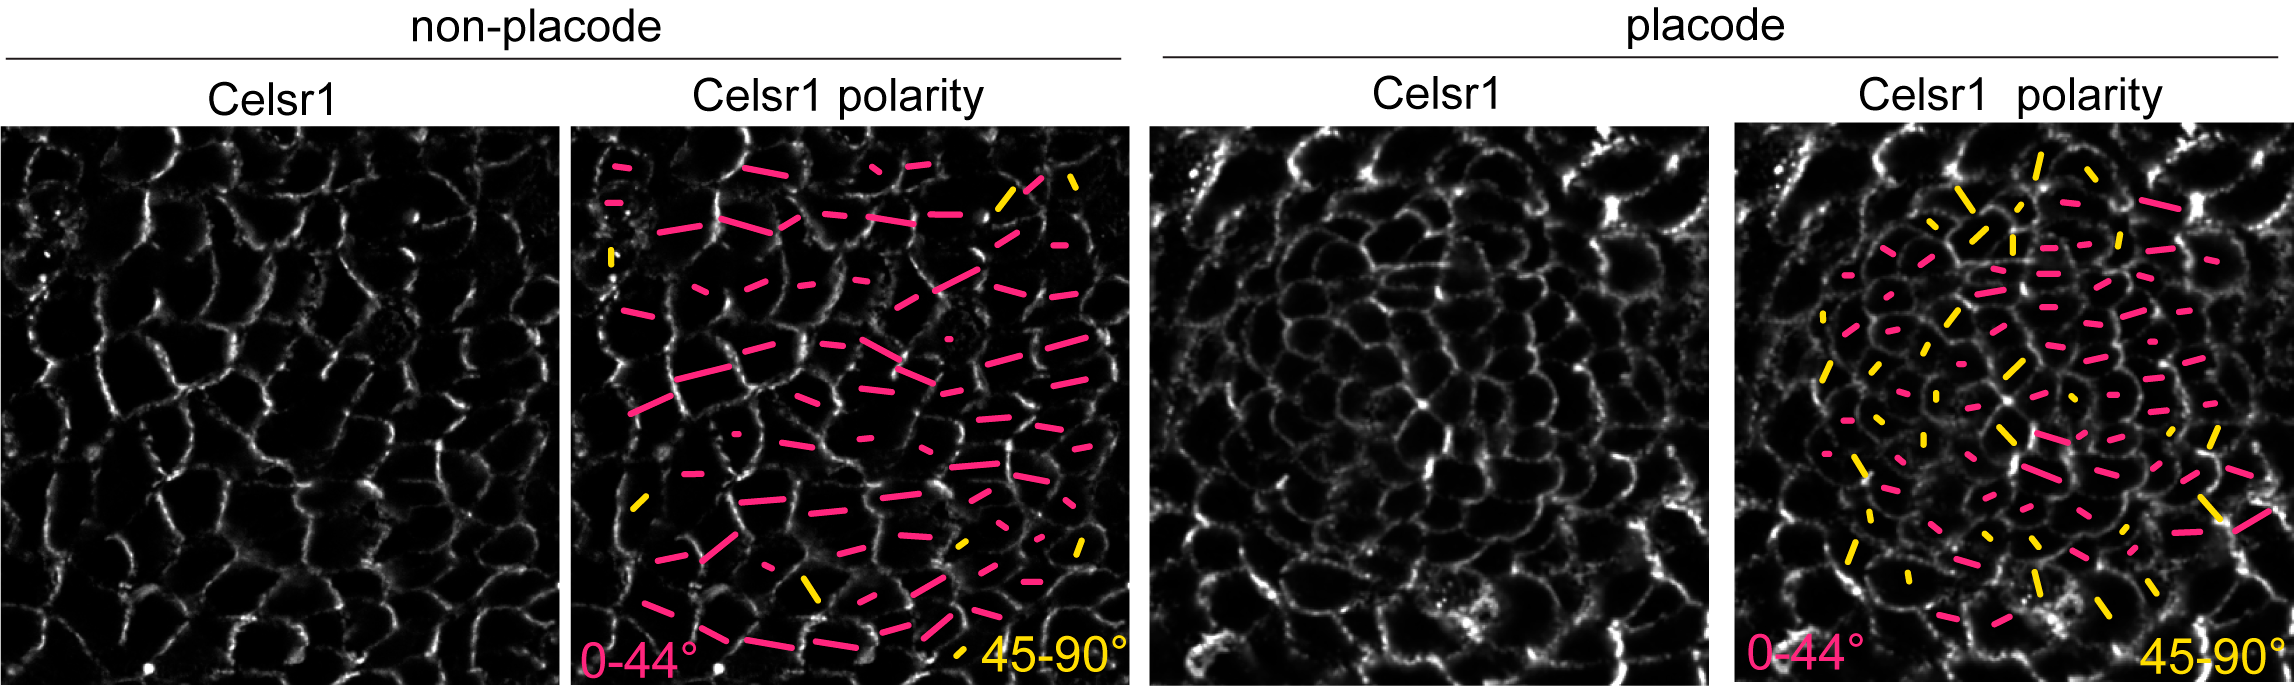
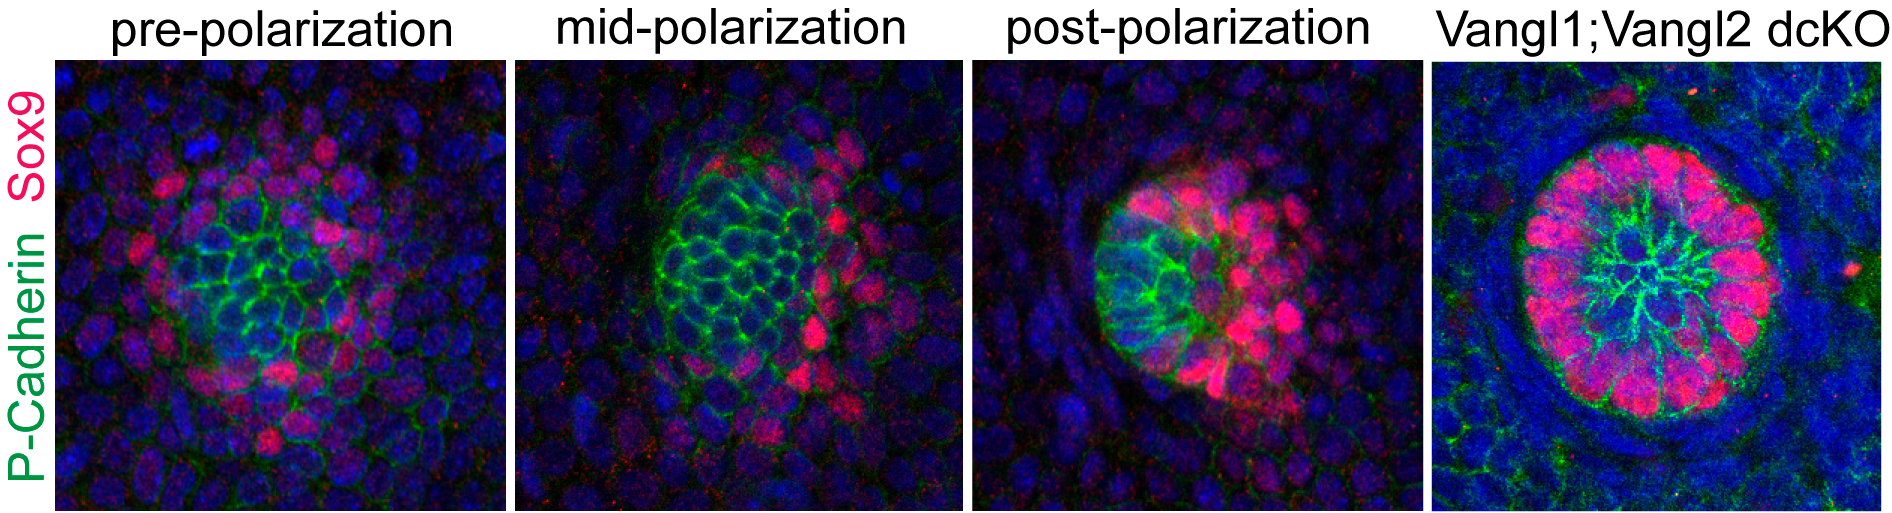
The discovery of counter-rotational movements in the placode also explained how PCP generates cell fate asymmetry. In our initial 2008 study we reported that the earliest two hair follicle lineages were distributed in a planar polarized organization (Devenport and Fuchs, 2008), with hair matrix precursors at the anterior and stem cell precursors at the posterior. But the relationship between morphological and cell fate asymmetry was unclear in part because the two events couldn’t be temporally separated. By live imaging we could now show that cell fate asymmetry arises from counter-rotating cell rearrangements. Initially, the two progenitor populations are specified in a bullseye pattern, with a central cluster of matrix progenitors surrounded by a halo of stem cell precursors. Counter-rotating cell rearrangements moved the two cell populations into their respective, anterior-posterior positions and shifted the placode from vertical to anterior-directed growth (Figure 5).
Figure 5
From these studies we learned that a just a single PCP-dependent process – counter rotating cell rearrangements – could generate both morphological and cell fate asymmetry. Additionally, we learned that PCP-dependent cell intercalation is a deeply conserved morphogenetic tool, used to shape tissues in ways other than convergent extension. We learned, of course, that live imaging reveals unexpected and delightful new insights beyond any hypothesis I was ever able to muster. This study was also an really successful experiment in team research. Whereas most projects in the lab and in my previous training had centered mostly around individuals, this was a true collaborative effort. Perhaps it is appropriate that the insights we gained about how PCP polarizes cell collectives would finally come, not from the efforts of just one individual, but from the collective.
For a Ph.D. holder, the idea that any career can be classified as “alternative” is obsolete. With a smaller percentage of postdocs going on to tenure-track positions every year, universities and research institutions are stepping up efforts to help recent graduates figure out how to put to good use all the specialized training that they have received. The National Institutes of Health (NIH), for example, has for the past decade hosted a free career symposium open to young scientists from any institution. This annual one-day event, organized by the Office of Intramural Training and Education (OITE) of the NIH and held at its Bethesda, Maryland campus, aims to expose early-career scientists to the various paths available to them professionally, and to help trainees identify the steps that they can take in their current positions to set themselves up for future success.
This year’s symposium, held on May 18th 2018, saw a record attendance of over 1000 participants, mostly Ph.D. students and postdoctoral fellows split evenly from within the NIH and from outside institutions. After a warm welcome address by Dr. Lori Conlan, Director of the OITE Career Services Center and of the Office of Postdoctoral Services, participants attended one of four concurrent panels for three different sessions. Each panel consisted of about four professionals, several of whom were NIH alumni, who had each made the transition from graduate student or postdoc to their current roles and were therefore credible experts. There was a deliberate effort to include panels from a wide range of career options, and in addition to several industry and academic panels, there were panels on careers in the federal government, science administration, science writing, outreach and policy, among others. The day ended with “Skill Blitz” sessions, which gave practical advice on specific skills critical to the job hunting process, such as writing a great CV, interviewing, and negotiating tactics after getting a job offer (The very helpful resources used for these sessions are available online on the OITE website).
The most important lessons from this event transcended any specific panel or career path and were reiterated continuously throughout the day. These general sentiments were:
1) NETWORK! – Networking was mentioned by almost every panelist as key to a successful job search. Having inside information on a job description or hearing about an impending job post before it goes public could be just what you need to stand out in a pool of applicants. Networking does not have to be intimidating. You could start small by making personal connections with colleagues in your department or purposefully arriving at seminar venues early to interact with participants before the talk begins.
2) Get Experience– With so many applicants from a Ph.D. background, having some experience in the field to which you plan to transition is critical. For tenure track jobs, experience with grant writing (especially grants that get funded) is an important way to distinguish one’s self, and for a teaching-intensive faculty position, teaching experience is essential. Volunteering is a great way to get experience in almost any field. For instance, for a career in technology transfer and patents, volunteering at a university tech transfer office would be a valuable addition to your CV. Likewise, working with a start-up company would be useful for a future career in investment. Volunteering to judge school science fairs shows an interest in outreach, as does writing for your department newsletter for a career in science writing. Volunteering can also help you test-run several career options to confirm the right path for you. Step out of your comfort zone, use your weekends (instead of spending them all in the lab) and diversify your experience. Even little things you do could have big payback.
3) Conduct Informational Interviews– Speaking with professionals in the field to which you plan to transition can help you get a clearer idea of what exactly the job entails and what essential skills are involved, as some of this may not be obvious when you’re looking at a job from the outside. Informational interviews can strengthen networking efforts, giving you valuable job leads and inside contacts. These interviews are also great for research into the prospects for growth and advancement in a specific field, and to find out if there are any nuances in applying for jobs, such as in academia where jobs are announced seasonally. By speaking with enough people, you get a well-rounded image of what your future holds with any chosen path, giving you valuable information on how truly suited you are for that career.
4) Publish– Especially for an academic career, publications show productivity. Both first author and middle author papers are important, as first author papers showcase the ability to lead a project and to see it through, and middle author publications show the ability to collaborate with others and work with a team.
5) Be kind– Perhaps the most unexpected but insightful piece of advice came at the start of the day when Dr. Sharon Milgram, Director of OITE, encouraged participants to be kind, both to themselves and to others. The requirements for careers in science can be tough on a person mentally and physically. Don’t be too hard on yourself for apparent shortcomings, and don’t take out your frustrations on others, turning mentoring into “tormentoring”, as she put it. Taking care of yourself boosts resilience, and looking out for the people you work with, especially those you mentor, helps change the culture that extreme stress and anxiety are inseparable from research.
The take home message from this symposium was simple: Opportunities abound. With the right fit, any career can lead to a full, fulfilling professional life. To distinguish yourself in your job applications down the line, though, be aggressive in finding opportunities to network and to gain experience in your chosen field. In all, this was a very productive way to spend the day.
Somites are segmented structures which give rise to numerous tissues in the vertebrate body. It has long been observed that somites scale in size with the overall size of the embryo, both as development proceeds and between individuals of different sizes, but the molecular underpinnings of this process have remained controversial. A new paper in the current issue of Development uses size-reduced zebrafish embryos to investigate this problem. We caught up with authors Kana Ishimatsu, Tom Hiscock and Sean Megason (Associate Professor of Systems Biology at Harvard Medical School) to find out more about the story.
Sean, Kana and Tom
Sean, can you give us your scientific biography and the questions your lab is trying to answer?
SM I’ve always been interested in how code makes pattern. When I was a kid, my parents bought me a computer (Commodore Vic-20). At some point I got bored with the couple of video games it came with and I taught myself how to program using the built in BASIC interpreter. I ended up making a lot of simulations of patterning based on complex dynamical systems without any training or knowing that it was a field of study. My mom was a high school librarian in the small town I grew up in so she would bring home the old Scientific Americans for me. They used to have a section called “Mathematical Recreations” that inspired a bunch of programming. In college I figured out that how the genome patterns life is the ultimate puzzle and got hooked on developmental biology.
My lab is broadly interested in how groups of cells work together to make things. We are big believers that “mechanism” typically cannot be reduced to a molecule. It emerges as interactions that can span many levels from molecules to cells to tissue mechanics, and that deciphering the mechanisms requires a balanced approach of direct observation, perturbation, and modelling across these scales.
Kana – how did you come to join Sean’s lab and be involved with the project?
KI I came to be interested in somite scaling problem while I was still in Japan, but soon realized I needed more quantitative approaches, especially in imaging. Sean’s lab had an ideal imaging system, a common interest in scaling issue, and good environment to work with people from different backgrounds.
And what about you Tom? You seem to have done a mix of wet and dry science so far in your career?
TH Yes – I started out studying physics and maths… until I joined Sean’s lab for my PhD, and fell in love with embryos and imaging. Now I have returned a little to my physics roots, and am trying to build theories to understand how animals build themselves.
Somites were first shown to scale in 1975, but decades later somite scaling and its relationship to the segmentation clock is still a controversial topic. Why do you think this is?
KI Although there are a number of models explaining somite formation, not only under a normal condition but also experimentally perturbed conditions, we have not been able to distinguish which “class” of model is working in vivo, before going into theoretically and molecularly detailed analyses. This has made more confusion than clarification.
TH Maybe one of the reasons is that there are many models that fit the data, and that it’s been difficult to design experiments to distinguish between the different hypotheses.
SM In our hands distinguishing models required rigorously comparing quantitative data with theoretical predictions, otherwise there’s a tendency to just say “oh it looks close enough”. It also required figuring out new experimental approaches that make different predictions for the different models.
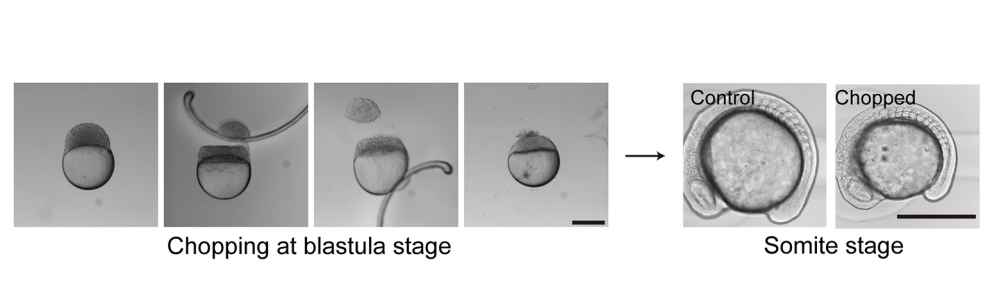
How to make size-reduced embryos, from Figure 2 in the paper
Can you give us the key results of the paper in a paragraph?
KI In order to tackle the long-standing problem of the somite formation mechanism, we started off from simply asking whether somite size scales with PSM size, which was a disputed topic in the field. We discovered that somite size scales with PSM size in a linear manner, only when the time delay between somite boundary specification and formation is taken into consideration. Based on this observation, we hypothesized the key feature of somite formation should scale with PSM size, and found only the Fgf gradient scales with PSM size, not clock period, axis elongation speed or a spatial wave pattern. Taking the time delay and the gradient scaling in to consideration, we proposed a new model, the “Clock and Scaled Gradient model”, in which scaling of a gradient is responsible for both progression and scaling of the somite formation. This model not only explains all the existing experimental results, but also makes a unique prediction, namely “an echo effect”, which was validated in vivo. Once PSM size is made artificially smaller, the system shows oscillations of somite sizes – becoming smaller and larger over and over again – which cannot be predicted by other classes or version of models.
Do you have any favourite candidates for the molecular players that would control gradient scaling?
KI Though there are several obvious candidates, like Retinoic Acid, it would be interesting if it does not primarily depend on molecules. For example, the scaling might be achieved through a gradient of pH or mechanical force. Anyway, the mechanism has to have fast dynamics because Fgf scaling occurs every somite cycle, implying that mechanisms that require a long time to achieve scaling (such as an expander-repressor mechanism) are not likely to control the gradient scaling in PSM.
SM This has been a hot topic of debate in the lab! There are some obvious candidates for players in the system (e.g. Retinoic Acid) but my best guess is that this is a case where mechanism cannot be reduced to a molecule. There are multiple signalling gradients and antagonists which all regulate each other, and in the context of lots of dynamic cell rearrangements and tissue movements.
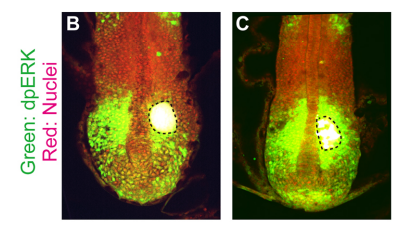
A somite transplantation experiment, from Figure 5 in the paper
How does somite scaling compare to other mechanisms of scaling in development?
KI Based on what we know thus far, using gradient scaling is a fairly general strategy to achieve scaling in development. When I started this project, I was almost sure that we were going to find something other than gradient scaling that is responsible for somite scaling, such as axis elongation speed or spatial patterns of waves in PSM. However, we ended up finding gradient scaling as the underlying mechanism of somite formation. It would be interesting to ask, at least theoretically, if there is any benefit to employ gradient scaling, rather than other mechanisms. Moreover, it is important to keep looking for other scaling mechanisms underlying embryo patterning.
SM The main reason I was interested in looking at somites in the size-reduced embryos was that I thought it would NOT be based on gradient scaling. In my mind, I reasoned that somite size was the product of clock period and axis elongation (wavefront regression) speed. I thought it was very unlikely that clock period would change since it is set by molecular degradation rates, but it seemed likely that the axis would extend more slowly if there were less cells. So I preferred a mechanism of “intrinsic scaling” where if there is a smaller number of precursors, you naturally get smaller products in a system governed by growth. I liked this hypothesis because it was based on geometrical/mechanical considerations rather than molecules but of course it turned out to be wrong! Gradient scaling is certainly an important way to scale pattern given the central importance of gradients in patterning itself, but I’m hopeful that there are other mechanisms to be discovered.
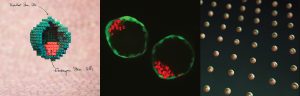
Simulation of clock and scaled gradient model, adapted from Movie 1 in the paper
When doing the research, did you have any particular result or eureka moment that has stuck with you?
KI One was that we discovered that the relationship between PSM size and somite size looks completely different when we take the delay into consideration. Until then, I was a big fan of the idea that travelling waves are playing a central role in determining somite size, but this discovery changed my view 180 degrees. The other was when we came up with echo experiment that can be uniquely predicted by our model. We spent months trying to come up with one experiment that not only existing models but also any modified versions of them cannot predict. It was such an exciting moment when we finally came up with the idea and were able to see the predicted result in vivo!
TM For me, it was when we realized that scaling was a central feature of how somites are made. We’d started by thinking about why smaller embryos have smaller somites – but it got really exciting once we realized that scaling was happening throughout somitogenesis.
And what about the flipside: any moments of frustration or despair?
KI&TM There was a long time where we were really confused by the data – particularly since there is so much known about somites, it’s hard to make sense of it all. But these struggles – particularly afternoons of intense headaches and confusion together – are our fondest memories of this project!
What next for you two after this paper?
KI I would like to expand the strategy we took in this study to a non-repetitive, higher dimensional (2D and 3D) system. The advantages of studying somite formation is that it is simple enough to describe its shape as 1D and that it is a repetitive structure allowing us to easily extract its characteristic feature (length). These advantages allowed us to find its input-output relation (PSM size and somite size) and find the transfer function (gradient scaling). It is exciting if we can use the same strategy more generally to study developmental systems. Of course, I am also excited to study (1) the underlying mechanism of gradient scaling in PSM, and (2) the mechanism that integrates the positional information given by the gradient and temporal information given by the oscillator.
TM I’ve just started a postdoc position with Ben Simons and John Marioni in Cambridge, where I think about how we can use lineage tracing data and single cell sequencing to understanding development.
And where will this work take the Megason lab?
SM The mechanism of PSM gradient scaling is clearly an interesting and open question as is the regulation of the speed and duration of axis extension in general given that somite number and body length vary widely between species but are very constant within a species. The size-reduction technique also opens up the rest of the embryo to scaling questions. I am a big fan of the work of Naama Barkai and colleagues on scaling of dorsal-ventral pattern in the early embryo by Expansion-Repression, but the scaling problem must separately be solved for every subsequent part of the embryo. There’s also the question of why these scaling systems are even there. It’s not so we can chop embryos in a dish and watch them recover. Where we actually take the work just depends on who joins the lab and their interests.
Finally, let’s move outside the lab – what do you like to do in your spare time in Boston?
KI I like to eat a lot of good food, especially Chinese!
TH One of the things I miss a lot about Boston is the lovely cycle ride to Walden Pond, followed by a refreshing swim in the lake, and a big ice-cream in Concord!
SM I chase my three little monsters around and occasionally do some recreational coding and gardening.
Hubrecht Institute for developmental biology and stem cell research. MERLN Institute for technology-driven regenerative medicine.
Laboratory for stem cell-based development.
2 years The Netherlands
A two-year postdoctoral position is available at the laboratory for stem cell-based development headed by Nicolas Rivron. The laboratory is located at the MERLN institute for technology-driven regenerative medicine (Maastricht) and at the Hubrecht institute for developmental biology and stem cell research (Utrecht). The laboratory is embedded in a highly innovative environment, has access to first-class facilities for microscopy, single cell sequencing and microfabrication, and provides investigators with the opportunity to pursue excellent, multidisciplinary research at the interface between stem cell biology and quantitative science.
Our goal is to investigate the flow of information between the blastocyst cells and the impact on post-implantation development, using stem cell-based blastoids [1]. We use a multidisciplinary approach combining genetic engineering, high-content screening of molecules, and single cell sequencing.
You must hold a PhD (or equivalent experience) in a relevant life sciences or biomedical discipline and have a strong interest in stem cells and early development. Extensive experience in embryonic stem cells and molecular biology techniques is essential. A proven publication record, with at least one first author publication in a peer-reviewed international journal is also essential. Expertise in cell signaling and genetic engineering would be an advantage. You must also have the ability to develop and apply new concepts, have a creative approach to problem solving, and be able to write clearly and succinctly for publication.
To apply, send your CV, names and contacts of two scientific references along with a covering letter stating why you are applying for this role (providing evidence against the requirements of the job as per the job description and person specification) via the website of the laboratory. Applications which do not provide a cover letter will not be considered. We only consider people who made a deep thought about joining the lab, are motivated for discoveries, success, and respectful of colleagues.
[1] Rivron NC [corresponding author], Frias-Aldeguer J, Vrij EJ, Boisset JC, Vivie J, Korving J, Truckenmuller RK, van Oudenaarden A, van Blitterswijk CA*, Geijsen N*. In vitro generation of blastocyst-like structures solely from stem cells. *Equal contribution. Nature. volume 557, pages 106–111. 2018.
An NIH-funded post-doctoral position is available in the Hoffman Lab at Yale University School of Medicine.
Our lab studies the function of genes involved in autism spectrum disorders at the cellular, molecular, and circuit levels. To do this, we use zebrafish as a model system due to their transparent larvae and amenability to high-throughput screens (Hoffman et al. 2016 Neuron). Our lab has generated zebrafish mutants in multiple autism risk genes using CRISPRs.
The post-doctoral associate will be involved in projects investigating how the loss of autism risk genes alters fundamental processes of vertebrate brain development. The post-doctoral associate will perform phenotypic analyses of multiple zebrafish mutants of autism risk genes using a combination of molecular, cellular, and circuit-level approaches.
Job Requirements
Recent PhD or MD/PhD with strong experience in molecular biology and microscopy.
Strong background in genetics and experience working with genetic models of human disease.
Highly motivated, enthusiastic, excellent interpersonal skills, and a strong publication record.
Prior experience with in vivo functional imaging and computational skills are preferred but not required.
Postdoctoral Fellow positions (can join anytime between 2018 summer to 2019 spring) are available in Lee laboratory at Johns Hopkins University. These positions are not only for stem cell experts, but rather for who has expertise on non-stem cell fields.
Here are the focused research areas for this hiring for 3-4 Postdoctoral Fellows.
The Lee lab has been establishing novel methodologies to specify human induced pluripotent cells (hiPSCs) into multiple lineages and to model human diseases, including induced neural crest (Kim et al., Cell Stem Cell, 2014), peripheral neurons (Oh et al., Cell Stem Cell, 2016; Oh et al., Nature Neuroscience, 2017), Schwann cells (Mukherjee-Clavin et al.,in revision) and skeletal muscle cells (Choi et al.,Cell Reports,2016; Choi et al., submitted) using multiple genetic reporter systems. We continue to study human developmental and degenerative disorders to unravel the underlying cellular/molecular mechanism toward realistic therapeutic approaches.
Compensation is following NIH guideline and JHU is an equal opportunity and affirmative action employer. Applicants can send a CV (with three reference contact info) to the address listed below:
Gabsang Lee, DVM, PhD
Associate Professor, Institute for Cell Engineering, Department of Neurology, Johns Hopkins University School of Medicine, Baltimore, MD 21205, USA
 (No Ratings Yet)


 (2 votes)