In this episode we have a very special interview with leading geneticist Mary-Claire King from the University of Washington in Seattle. Mary-Claire’s work has spanned a wide range of topics, from comparing chimps and humans to finding the first breast cancer gene to reuniting families that have been torn apart.
If you enjoy the show, please do rate and review and spread the word. And you can always send feedback and suggestions for future episodes and guests to podcast@geneticsunzipped.com
Since Steve Woolgar’s and Bruno Latour’s study Laboratory Life was published in 1979 it has become part of the repertoire of STS scholars and anthropologists to visit the sites of science production to study scientific practices and laboratory routines. These visits allow us to build a better understanding of contemporary scientific knowledge in the making, not only epistemologically, but also with respect to institutions, power relations or politics.
In the first week of March we joined the crowd – with the exception that “we” are an artist (Gemma) and a historian (Janina) who teamed up to immerse ourselves into the lab of EMBO Director Maria Leptin, dedicated to the study of cell shape and morphogenesis at EMBL in Heidelberg.
Our interest: Imaging and knowledge production in contemporary biology
For the past decade or two, biology has been undergoing major transformations involving process-oriented and systems-related questions and perspectives on the organism. Live imaging technologies and massive computation are crucial driving forces in this development.
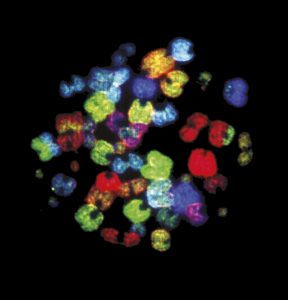
With imaging getting more and more central to biological investigation (the EMBL is currently expanding its site to include a major central imaging facility) it seems ever more relevant to investigate the visual imagery created in those labs from the perspective of the arts and humanities. Indeed, the questions arising are as simple as they are fundamental: What is it that we see? Is seeing still believing, or do we have to reinvestigate that claim critically and ask, with Eric Betzig, winner of the 2014 Nobel Prize in Chemistry for developing super-resolved fluorescence microscopy, “when can we believe what we see?” (Fig.1a,b)
A particular focus and shared interest of ours is the visualization of processes such as gastrulation, that crucial moment early in embryogenesis which is of particular interest to the Leptin group’s research.
Fig.1a,b Gemma Anderson (left) and Janina Wellmann (right) looking through various microscopes
How are processes and cell movements during gastrulation accessed with (various kinds of) microscopes1? How do the organism, the images and data extraction relate to one another? What does seeing mean when fluorescence is detected computationally and neither an observer nor binoculars are any longer necessary (even though they are still there, serving the initial positioning of the specimen) (Wellmann 2018)2? Furthermore, for centuries learning how to draw has been part of the biological curriculum and has only recently been drifting out of biological practice and education (Anderson 2014, Steinert 2016)3. Many scientists, however, still think through and with drawings. How do they use drawings to making processes intelligible to themselves, to their colleagues, to people outside their field? Does drawing raise novel questions? And given the strong drive of biology towards investigating processes, movement and organic change, can we conceive of new ways to draw movement and processes?
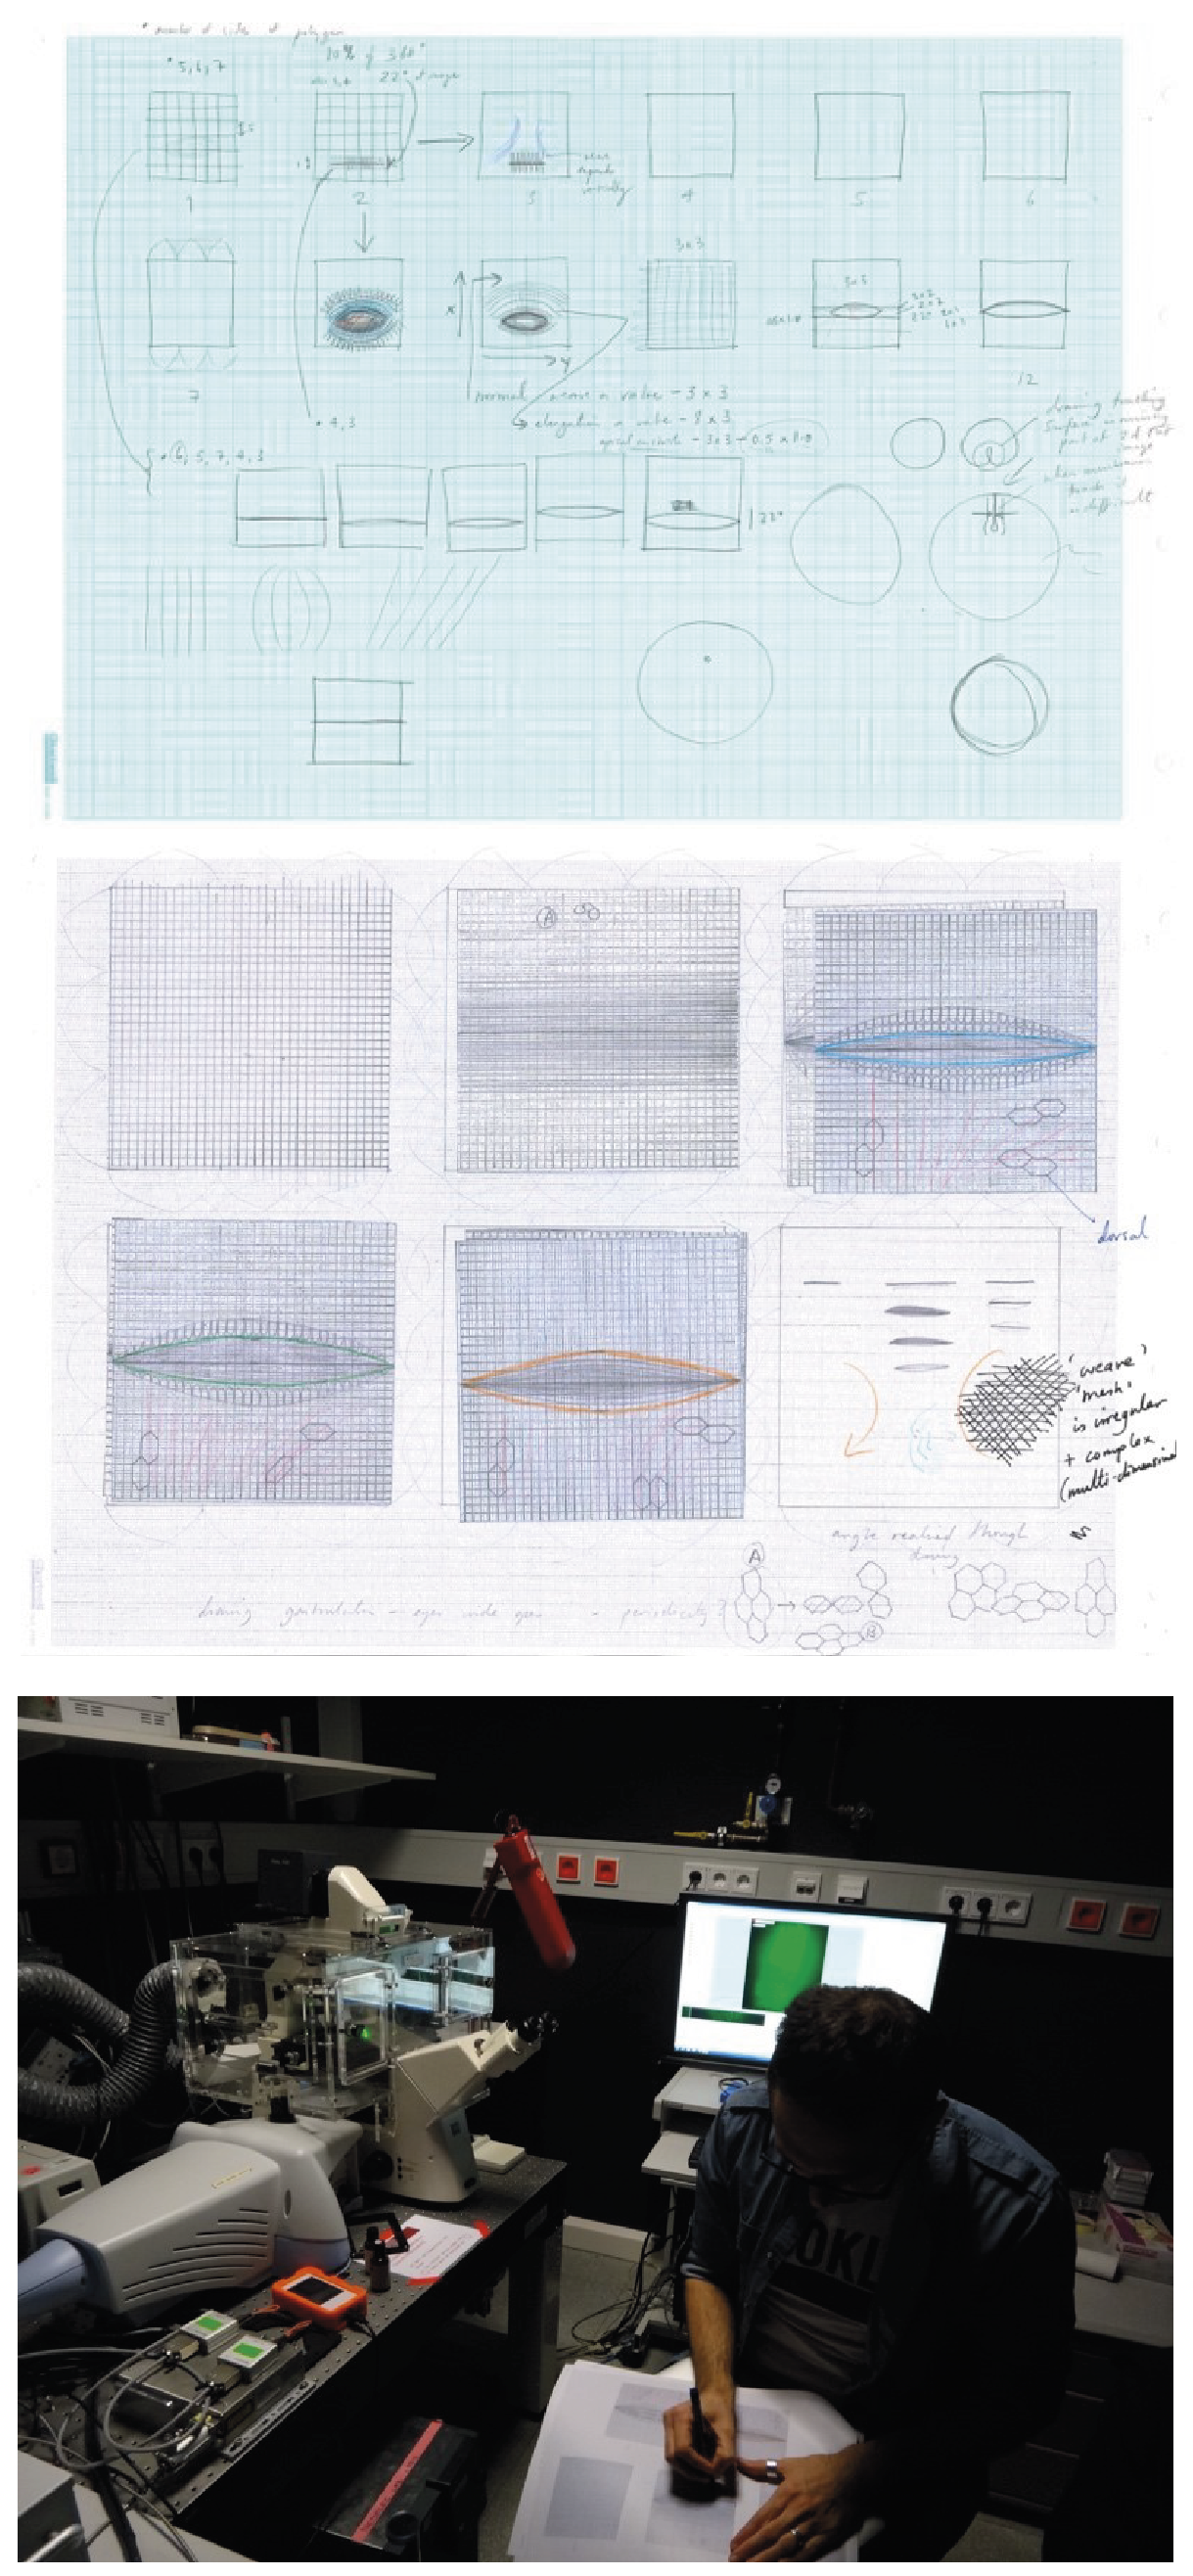
To give an example, Gemma actively introduced drawing as a mode of enquiry to the Leptin lab4. Together with the scientists, Gemma used drawing to investigate new ways to image the whole surface of the gastrulating embryo, including the invaginated area (Fig.2a-c). In the lab, cartographic projections are a favorite pictorial approach, i.e. the 3d body of an embryo is rolled out in a 2d image, just like the globe is flattened to a 2d map of the earth. In the computer-generated images, however, the invaginated area is condensed into a thin line. In working out how to draw the invaginated area of the embryo, Gemma brought novel questions to science while, conversely, learned about the role of actin and myosin, the cellular mesh and the pulses and waves of activity and shape change during gastrulation.
Fig.2a,b Sketches of the invaginated area of the embryo, Gemma Anderson, pencil on paper, 2019; c Juan Elliff drawing on top of Gemma’s drawing while working with the spinning disc microscope
Things we did
For a week, we became observers of and participants in the daily routine of the Leptin group’s research. Housed on the 5th floor, the many different labs of the developmental biology unit line up along busy corridors: the scientists’ benches face the woods or look over Heidelberg and the windowless technical facilities – warm rooms with incubators, cold rooms with refrigerators or rooms equipped with centrifuges – form the core of the building.
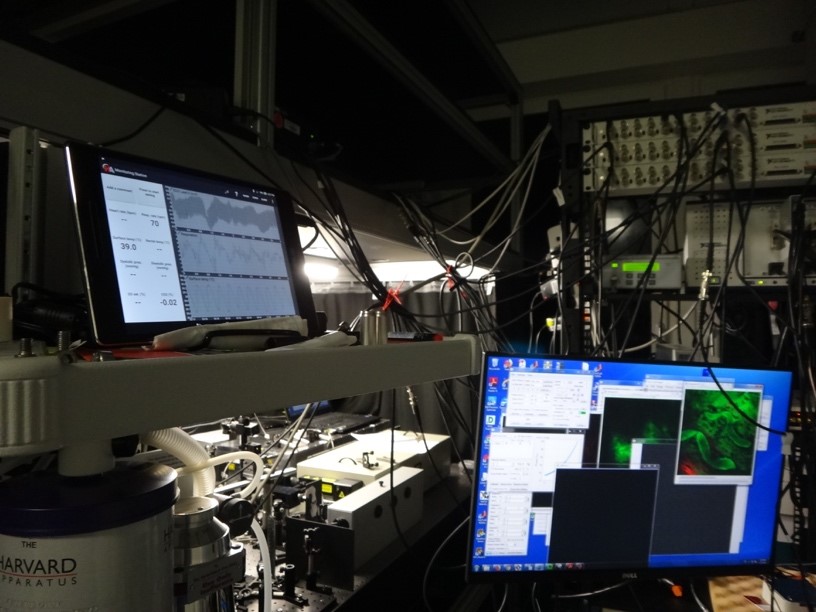
We were introduced to the individual research projects of the doctoral students and post-doctoral researchers (who enthusiastically answered our questions, explained their work and clarified why they were doing what), went to talks (which take place every day, at all times), we gave talks to the lab and observed the mounting of embryos and followed experiments with a variety of different light-sheet, confocal or spinning disc microscopes. We also visited units solely devoted to technological, optical and physical tinkering to develop new imaging devices (Fig.3).
Fig.3 Building a microscope in Robert Prevedel’s lab, EMBL
Being exposed to a scientific environment alien to us while exposing the scientists to questions alien to them, it soon became clear that basic words and concepts such as ‘seeing’ and ‘image’ had different meanings, e.g. indicating data to one scientist, model to the other or a specific pictorial form and convention to us. And most importantly, although neatly ordered, separated and organized on different floors and in many labs, research at EMBL takes place where questions and problems cut across disciplines, segmented fields of knowledge and learned practices.
What we think now
Ultimately, engaging in a science – arts – humanities dialogue about contemporary science and image production raises questions as to future human-technology relationships.
Where do we want developments to go? We left the lab wishing to engage in more reflection, discussion and exchange over these developments. Does science follow unswervingly its path in continuing to build ever better technologies? Or ought we rather want to invest (again or more profoundly) in educating scientists (and lay people alike) in their abilities and skills to create images themselves as a unique way of understanding, rather than solely analyzing and handling computer-generated imagery? Notwithstanding technological advances in science, drawing and image making remain a very distinctive form of inquiry and of scientific creativity, bound to human perception and experience.
Thanks
This exposure and arts/humanities experiment would not have been possible without the generous support of the many instances involved: first of all Maria Leptin and the whole lab who allowed us in and devoted their time to us; the Arts and Humanities Research Council (AHRC) for funding Anderson on the art/science/philosophy project ‘Representing Biology as Process’ (www.probioart.uk) and the DFG-funded Kollegforschergruppe KFOR 1927 for funding Wellmann’s research as well as our home institutions enabling us to be away and to make such a trip possible, the hospitality of EMBL and all its members from the communications department to the technicians – who all followed our work with interest and curiosity.
[1] Janina’s research is part of a DFG-funded project on Media Cultures of Computer Simulation at Leuphana University.
[2] Wellmann, J. 2018 ‘Model and Movement. Studying Cell Movement in Early Morphogenesis, 1900 to the Present’ History and Philosophy of the Life Sciences 40:59. https://doi.org /10.1007/s40656-018-0223-0 and Wellmann, J. 2018 ‘Gluing Life Together. Computer Simulation in the Life Sciences: An Introduction History and Philosophy of the Life Sciences 40:70. https://doi.org /10.1007/s40656-018-0235-9
[3] Anderson, G. 2014 ‘Endangered: A Study of Morphological Drawing in Zoological Taxonomy’ Leonardo, 47(3), pp. 232–240. For more on the role of drawing and image making in late-19th century embryology see Beatrice Steinert’s blog post for The Node ‘Drawing Embryos, Seeing Development’ 2016 https://thenode.biologists.com/drawing-embryos-seeing-development/discussion/
[4] This visit is part of the AHRC project Representing Biology as Process, www.probioart.uk
The Turing Centre for Living Systems (CENTURI) recruits up to 5 highly motivated postdoctoral fellows to work in an interdisciplinary life science environment.
CENTURI postdocs will have the opportunity to develop their project with more than one research group, bridging biology to other disciplines. Candidates will have a background in any of the following fields: cell or developmental biology, immunology, neurobiology, biophysics, theoretical physics, computer science, bioinformatics, applied mathematics or engineering.
The available postdoctoral projects are advertised online, at this address: http://centuri-livingsystems.org/recruitment/. Postdoc candidates also have the possibility to propose their own project, providing that it meets the eligibility criteria. To know more about the projects and applications, please visit CENTURIwebsite.
Selection criteria
Candidates will be evaluated on the following criteria:
– Scientific level and publications
– Ability to work in a multidisciplinary research environment
– Ability to work on a collaborative research project
– Enthusiasm and communication skills
Deadline for application: April 26, 2019
About CENTURI
Mainly located on the Luminy science campus (Marseille France), the Turing Centre for Living Systems is an interdisciplinary project federating a growing community of biologists, physicists, mathematicians, computer scientists and engineers in 15 research institutes.
The project focuses on 3 missions: Research, Education and Engineering
Sars International Centre for Marine Molecular Biology
The University of Bergen (UiB) is an internationally recognized research university with more than 14,000 students and close to 3,500 employees at seven faculties. The university is located in the heart of Bergen. Our main contribution to society is excellent basic research and education across a wide range of disciplines.
Sars International Centre for Marine Molecular Biology (EMBL partner)
The Sars International Centre performs basic research on the development and evolution of marine animals, using advanced methods of molecular/cell/computational biology. It is a partner of E.M.B.L. (European Molecular Biology Laboratory) and is located in the Bergen High Technology Centre together with several departments of the University of Bergen.
Group Leader Positions (Researcher I, code 1110) – 6 year contracts
The Sars Centre is seeking outstanding candidates addressing fundamental questions in organismal biology using marine species. Although all current groups work on animals, projects on other marine organisms will also be considered. A contract of six years will be offered to successful candidates, with excellent internal resources for the research (postdocs, PhD students, technicians, lab space and project-specific facilities) as well as a competitive salary. The contract may be prolonged for up to four years, depending on performance and available funding at the time of review. Group leaders at the Sars Centre are encouraged to obtain additional funding through grant applications to national and international funding agencies.
Qualifications and personal qualities:
The applicant must:
hold a PhD considered equivalent to the Norwegian PhD degree
be able to train and lead junior scientists and technical staff towards a common goal defined in the group leader proposal
be able to develop collaborations with other research groups located in and out of the institution
We offer:
A good and professionally challenging working environment, in modern research facilities
Starting salary at pay grade 79, code 1110 (currently NOK 778.700) upon appointment
Enrolment in the Norwegian Public Service Pension Fund
A position in an inclusive workplace (IA enterprise)
Good welfare benefits
Your application in English must include:
A description of past and present research (3 pages)
A proposal for the research at the Sars Centre (3 pages)
A detailed CV and contact information for 3 references
Application Deadline is 01 April 2019. All shortlisted candidates must be available for a seminar and interview by the Sars Centre Scientific Advisory Committee held in Bergen on 23-24 May 2019.
Applications or documents sent by e-mail only will not be considered.
For further information about the positions please contact the Sars Centre Director (Daniel.Chourrout@sars.uib.no tel +47 5558 4360) and/or visit our website (www.sars.no).
General information:
The state labour force shall reflect the diversity of Norwegian society to the greatest extent possible. Age and gender balance among employees is therefore a goal. It is also a goal to recruit people with immigrant backgrounds. People with immigrant backgrounds and people with disabilities are encouraged to apply for the position.
We encourage women to apply. If multiple applicants have approximately equivalent qualifications, the rules pertaining to moderate gender quotas shall apply.
The University of Bergen applies the principle of public access to information when recruiting staff for academic positions. Information about applicants may be made public even if the applicant has asked not to be named on the list of persons who have applied. The applicant must be notified if the request to be omitted is not met.
The successful applicant must comply with the guidelines that apply to the position at all times.
A full-time NIH-funded postdoctoral position is available in the laboratory of Katherine Fantauzzo in the Department of Craniofacial Biology at the University of Colorado Anschutz Medical Campus to study the dynamics of PDGFR dimer formation and identify PDGFR dimer-specific interacting proteins in the craniofacial mesenchyme, with the ultimate goal of providing therapeutic directions aimed at the treatment of human birth defects such as cleft lip and palate. This project will utilize an array of complementary approaches such as fluorescence microscopy of whole embryos and cultured cells, conditional mutagenesis in the mouse embryo and immunoprecipitation followed by mass spectrometry. We are seeking highly motivated, creative and interactive applicants with the ability to work independently. Preference will be given to applicants with a strong background in biochemistry and/or mouse developmental biology who published a first-author paper as a result of their Ph.D. work. More information about our group and research interests can be found on our laboratory website (http://www.fantauzzolab.org). Interested candidates should apply through the CU careers website (https://cu.taleo.net/careersection/2/jobdetail.ftl?job=15926&lang=en) with a letter of interest, a curriculum vitae and contact information for three professional references.
The McMenamin Lab at Boston College is looking for a qualified and highly motivated person to serve as a technician. Our lab uses highly interdisciplinary approaches answer fundamental questions about skeleton development, the molecular and endocrine regulation of developmental coordination, and the evolution of life history variation in vertebrates. We use the zebrafish model to study the impacts of thyroid hormone on bone morphogenesis, patterning and development, see https://sites.google.com/a/bc.edu/mcmenamin-lab/. The McMenamin Lab is a diverse environment and we particularly encourage applications from women, researchers of color, LGBTQ individuals, and people from disadvantaged backgrounds.
Primary responsibilities:
• Helping to manage and maintain our zebrafish colony; overseeing the schedules for feeding and husbandry; breeding and maintaining fish lines; interfacing with the animal care facility staff
• Helping to manage and maintain our molecular lab; ordering reagents and other supplies and maintaining laboratory equipment; lab administration, including lab safety, reporting and record keeping
• Training and supervising students in the lab and in the animal care facility
• Ideally, performing bench work and microscopy; contributing to data analysis and interpretation
Requirements:
• Minimum of a bachelor’s degree in Biology or a related field
• 2 or more years laboratory experience
• Working knowledge of fundamental biological concepts and ability to apply knowledge in varied situations
• Excellent communications skills and attention to detail; ability to work both independently and as part of a team
Preferred characteristics:
• Experience with zebrafish or other aquatic system, fluorescent microscopy and molecular biology
• Experience as a supervisor and manager
• Highly interested in our research program and ability to contribute as a productive researcher
Position:
Full time position, salary will be commensurate with experience. Initially a 6 month appointment, to be renewed as appropriate.
Application:
Please submit a single PDF of (1) a cover letter that includes a description of research interests and experience, (2) CV or resume, including undergraduate relevant coursework and GPA (3) a list of 3 or more professional references to mcmenams@bc.edu. Applications submitted by April 12, 2019 will receive priority consideration, but position is open until filled. Preferred start date will be in May or sooner.
Boston College conducts background checks as part of the hiring process. Boston College is an Affirmative Action/Equal Opportunity Employer and does not discriminate on the basis of any legally protected category including disability and protected veteran status. To learn more about how BC supports diversity and inclusion throughout the university please visit the Office for Institutional Diversity at http://www.bc.edu/offices/diversity.
Development invites you to submit your latest research for our upcoming special issue: Chromatin and Epigenetics. This issue will be coordinated by several of our Academic Editors who are experts in this field: Benoit Bruneau, Haruhiko Koseki, Susan Strome and Maria Elena Torres-Padilla.
Recent years have seen huge advances in our understanding of how DNA and histone modifications, chromatin architecture and nuclear organisation impact on gene expression to drive developmental processes. Moreover, we now have a much greater appreciation for the complex layer of RNA-based regulation that can exert epigenetic effects on cellular and organismal phenotypes. This understanding, combined with technological advances – from genome-scale assays of transcription factor activity and 3D chromatin structure, to dynamic imaging of transcription at individual loci – now provides unprecedented opportunities to examine how chromatin-based and epigenetic mechanisms regulate development across the plant and animal kingdoms. Development is the natural home for such studies, and we invite you to submit your latest research on this topic for our Special Issue.
The deadline for submission of articles has been extended to 15 April 2019*. The issue will be published in late 2019 (note that, in our continuous publication model, we will be able to publish your article shortly after it is accepted; you will not have to wait for the rest of the issue to be ready) and will be widely promoted online and at key global conferences – guaranteeing maximum exposure for your work. Please refer to our details on article types and our author guidelines for information on preparing your manuscript for Development, and submit via our online submission system. Please highlight in your cover letter that the submission is to be considered for this Special Issue. Prospective authors are welcome to send presubmission enquiries, or direct any queries, to dev.specialissue@biologists.com
*Please note that not all articles accepted for publication will be included in the special issue; dependent on volume of content and timing, they may instead be published in earlier or later issues of the journal.
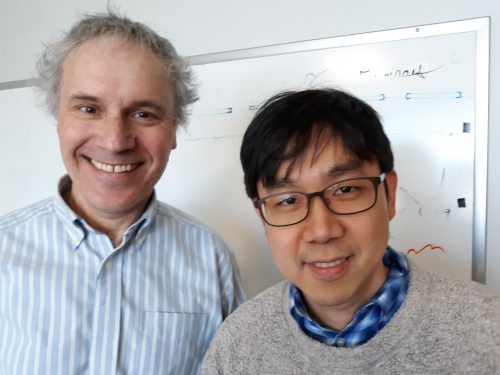
The control of timing in development is crucial, both within and between tissues. Heterochrony involves shifts in the rate of development of some tissues relative to others, and although the first heterochronic genes were identified in Caenorhabditis elegans in the early 1980s, their role in inter-tissue developmental coordination is still not completely understood. A new paper in Development tackles this problem with an analysis of the role of lin-28, a key heterochronic gene, in worm fertility. We caught up with Sungwook Choi, first author and recently graduated PhD student in Victor Ambros’ lab at the University of Massachusetts Medical School in Worcester, to find out more.
Sungwook (R) with his supervisor Victor Ambros (L).
When did you first get in to science, and biology in particular?
I have been interested in biology ever since high school. I remember, at that time, being intrigued by the fact that each cellular compartment has distinct functions. I majored in life sciences during my undergraduate studies and focused on plant developmental biology during my Master’s degree.
Why did you decide to make the transition from plant to animal development?
Studying plant biology – in particular the biosynthesis of jasmonic acid in Arabidopsis – gave me the opportunity to be exposed to basic molecular techniques and genetic analysis. Later, when I started my graduate studies in University of Massachusetts (UMass) Medical School, I became interested in small RNA biology. I was fortunate enough to join the laboratory of Victor Ambros and learned that microRNAs, such as lin-4 and let-7, are key regulators of animal developmental timing. Since then, I have expanded my studies beyond microRNAs to include various genetic factors that regulate the timing of animal development.
How did you find the other transition – moving from South Korea to the USA?
It was quite a smooth transition. Although language barriers were inevitable at first, I met many nice people who helped me inside and outside of the laboratory. Also, I greatly enjoy and appreciate the international environment that UMass Medical School fosters through its inclusion of people with different nationalities from diverse cultures.
Before your paper, what was understood about lin-28‘s role in coordinating developmental events?
lin-28 was first identified as a developmental timing regulator in C. elegans by Victor Ambros and Bob Horvitz in the 1980s. The loss of lin-28 causes precocious hypodermal development in larvae and its function has mainly been studied in this context. In particular, many studies have elucidated the genetic relationship of lin-28with other developmental timing regulators such as lin-4, let-7, hbl-1 and lin-46. This genetic regulatory network is called the ‘heterochronic pathway’. In terms of inter-tissue regulation, a 2016 study from Gary Ruvkun’s lab showed that the heterochronic pathway genes act in the hypodermis to regulate mTORC2 signalling in the intestine.
Can you give us the key results of the paper in a paragraph?
We first looked at why lin-28 loss-of-function mutants exhibit reduced fertility. We found that somatic gonadal structures of the mutants are abnormal, which negatively affect the reproductive process, especially spermathecal exit and ovulation. Then, we asked how lin-28 regulates somatic gonadal structure. By genetic epistasis and tissue-specific rescue experiments, we found that the hypodermal, not somatic gonadal, function of lin-28 in controlling developmental timing is crucial for somatic gonadal development. Therefore, our data indicate that timely hypodermal development guaranteed by lin-28function is essential for somatic gonadal morphogenesis.
Timely hypodermal development guaranteed by lin-28 function is essential for somatic gonadal morphogenesis.
Your data suggest that lin-28 affects somatic gonadal morphogenesis cell non-autonomously: how might an RNA-binding protein act from a distance?
Our data implies that the downstream targets of LIN-28, such as let-7 and lin-46, are still in the hypodermis, not in the somatic gonadal tissues. Therefore, LIN-28 binding to its target RNAs probably happens in the hypodermis. What we have not yet identified is the exact mechanism by which hypodermal precocious development can talk to somatic gonadal morphogenesis. We speculate that there might be actual signalling molecule(s) from the hypodermis to somatic gonad, and/or perhaps physical contact between two tissues could be aberrant in lin-28loss-of-function mutants.
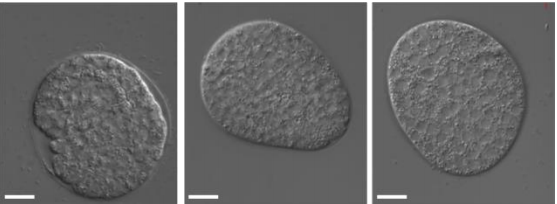
lin-28 mutant embryos showing irregular shapes.
When doing the research, did you have any particular result or eureka moment that has stuck with you?
When I tried to identify the physiological causes of infertility of lin-28(lf) mutants, I didn’t know where to start. Around that time, I went to the Boston Area Worm Meeting and heard the presentation from Erin Cram’s lab about ovulation and spermathecal exit of C. elegans. I came to the realization that lin-28(lf) mutants showed defects in spermathecal exit and from then on, I analysed the mutants focusing on aspects of somatic gonadal development.
And what about the flipside: any moments of frustration or despair?
For me, the frustrating moments about research are not the times when I disprove my research hypothesis. What is most frustrating for me is when established protocols or techniques are not working as expected for my experiments for reasons that I do not understand very well. However, I kept trying to analyse the technical challenges and to enjoy the process of problem solving as a researcher.
Congratulations on getting your PhD last August – what’s next for you?
I haven’t completely decided yet. I am interested in several areas of research including those that are more clinically relevant. Regardless of the topic, I want to do research that is necessary for the progress of the field, even if it may not be particularly fancy.
Finally, let’s move outside the lab – what do you like to do in your spare time in Worcester?
I like Worcester very much. There are many local restaurants and pubs in Worcester, and some famous diners, which I often visit for breakfast. Other than that, I enjoy Worcester’s plentiful cultural resources, like the diverse exhibitions at the Worcester Art Museum and the concert series in the downtown area.
We are seeking a biocurator to join the FlyBase group at the University of Cambridge, UK. If you are looking for a fulfilling, fly-related career away from the lab, and enjoy the challenge of organizing complex data clearly and concisely, then this is the job for you!
FlyBase curators extract biological information from scientific articles about the model organism Drosophila melanogaster, recording and organizing these data in template forms and graphical interfaces. Phenotype curators focus on data that illuminate the function of genes based on their mutant phenotypes and genetic interactions. All curated data are subsequently integrated into our central database and made freely available via the FlyBase website (http://flybase.org/).
Further details and an application form can be found on this link:
We seek to appoint a Research Technician/Graduate Research Assistant to work on a research project elucidating a signalling pathway governed by the imprinted genes Dlk1 and Grb10. The pathway regulates fetal growth, lean to adipose body proportions and energy homeostasis, with relevance to growth disorders, obesity and diabetes.
The successful candidate will use biochemical, cell and molecular biology approaches to identify key additional pathway components.
A BSc in a relevant subject is essential along with experience of successfully applying at least one of the following techniques: mammalian cell culture, western blotting, histology, nucleic acid purification and PCR.
This is a fixed term contract for up to 3 years funded by the Medical Research Council.
For further details about the role please contact Prof. Andrew Ward (bssaw@bath.ac.uk), however, please ensure that all applications are submitted via the University website, also attaching a copy of your CV. Apply via the URL:
The University of Bath and both the Department of Biology and Biochemistry and the Department for Health hold Athena SWAN bronze awards and are committed to equality of opportunity. We encourage applications from under-represented groups, including women.
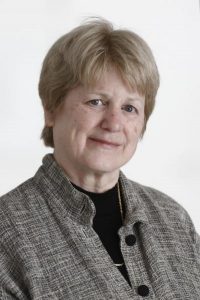 In this episode we have a very special interview with leading geneticist Mary-Claire King from the University of Washington in Seattle. Mary-Claire’s work has spanned a wide range of topics, from comparing chimps and humans to finding the first breast cancer gene to reuniting families that have been torn apart.
 (No Ratings Yet)
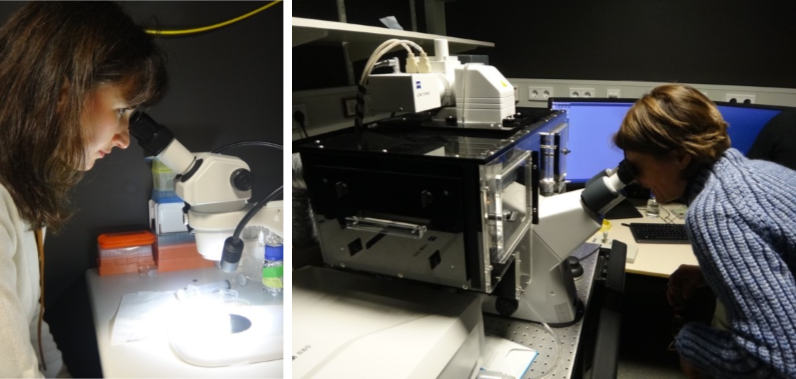
 (1 votes)