A month or so before the Second International Summit on Human Genome Editing took place, several of us on the organising committee heard rumours that He Jiankui (Southern University of Science and Technology, Shenzhen, China; who I’ll refer to as JK) was using genome-editing techniques on human embryos for the purposes of trying to make children who would be resistant to infection by HIV. We knew that JK had presented relevant work, involving genome editing in mouse and monkey embryos, at meetings over the last couple of years, and that he had also started using the methods on human embryonic stem cells and human embryos in culture. However, there was concern that he felt he was in a position to try things for real: to make genome-edited human babies. We also heard rumours that JK had obtained local ethics committee approval to go ahead. Therefore, when we were deciding on additional speakers for the summit, JK’s name came up. Although we were aware that he had not published in this area, he had clearly been doing relevant research and we thought it might be useful for him to attend the summit where the science, safety, ethics and regulatory issues surrounding genome editing would be discussed. We sent him an invitation and he responded almost immediately to say that he would be very happy to present. As moderator of the session he was going to be in, I had a conference call with JK and other speakers shortly before the summit. In advance of that call, JK sent me a draft summary of his talk. The summary highlighted the areas he was going to cover, including some preclinical data, but it certainly did not mention that he had edited human embryos and implanted them.
Late afternoon on Sunday 25 November, 2 days before the summit was due to begin, I was contacted by one of the staff members from the US National Academies of Sciences (NAS) who was coordinating the organising committee, asking if I could meet urgently. She had received a message from Jennifer Doudna (University of California, Berkeley, USA) who had just heard directly from JK by e-mail that two babies had been born following genome editing of early embryos. There were only a few details available at this point, but it was clear that the story was about to break in the press. Indeed, later that night an article was published by MIT Technology Review, which reported that JK had indeed created ‘CRISPR babies’. It turns out that their journalist had been in China, had heard rumours of what JK was up to and had managed to find clinical trial documents that JK had posted. After a little more digging, this journalist and the MIT Technology Review presumably took the decision to publish the story shortly before the summit started. It also turned out that JK had been using the services of a PR advisor who suggested that JK should have a journalist from Associated Press (AP) document his work and make videos to explain his research, so that he could make a big splash when the story was eventually released. Apparently, JK had submitted a manuscript to a ‘top journal’ and wanted to wait for the paper to come out before releasing the videos; he stated that it was not his intention for the story to be announced just before the summit. However, once it was clear the MIT Technology Review piece was coming out, AP needed to release the details that they had gathered, or they would lose their ‘scoop’. JK must have also decided, or been (ill-)advised by his PR consultant, to release the videos.
We obviously then needed to decide what we were going to do about all of this. More members of the committee arrived early Monday morning and we collectively took the decision that, assuming JK was still willing to talk, he should be encouraged to present at the summit. We subsequently received some criticism for this – about giving him a platform – but we stuck with our original decision because it was the only way of getting the story out in public, allowing JK to explain what he had done and why.
Jennifer Doudna and I met JK briefly on the Monday morning to get some confirmation from him about the stories that were already developing in the media. This was critical because I was due to attend a pre-summit press briefing, along with David Baltimore of the NAS, Lap Chee Tsui of the Hong Kong Academy of Sciences and Patrick Tam (University of Sydney, Australia) – another member of the organising committee who is fluent in Cantonese – and it was obvious that the main topic of questioning would be about what JK had done. We also wanted to stress to JK that he should take the opportunity to present the story in full at the summit in the Wednesday morning session. Jennifer and I also arranged to meet him that evening over dinner.
The questions in the press briefing were indeed very much focused on JK and his activities. This was a pity since the summit was going to cover many other topics of importance, including new developments in understanding the science of genome editing, uses of editing methods for somatic gene therapy, how ethical and public views had evolved over the past few years, and the different approaches to regulation according to culture and country.
That evening, Jennifer, myself and JK were joined by a few other committee members, including Alta Charo (University of Wisconsin-Madison, USA) and Matt Porteus (Stanford University, CA, USA). JK had brought his laptop to show his data. As he explained what he’d done, we were increasingly horrified, while JK was getting more and more anxious, in part because we were challenging him, but also because he had apparently started to receive threats and was nervous the press would find him. He left, having checked out of the hotel where all of the speakers were staying, and moved to a different, undisclosed hotel. I maintained contact with JK via e-mail and continued to encourage him to speak at the summit, and we discussed the arrangements we were prepared to make for him. This involved splitting the session he was in to allow the first four speakers to have a separate Q&A session before JK’s talk. Of course, we also had to take special security measures. He disclosed his location to Hong Kong University security, who brought him to the venue, where he was to wait in a hidden room until I called for him to give his presentation. We knew there were going to be many journalists attending – indeed there were about 160 corralled into one section of the auditorium – and that they would have many questions. To prevent an unruly Q&A session, we asked the journalists to write their questions out in advance. I also had permission to close the session if the media or other audience members misbehaved, and I warned everyone of this, both at the start of the session and just before JK’s talk.
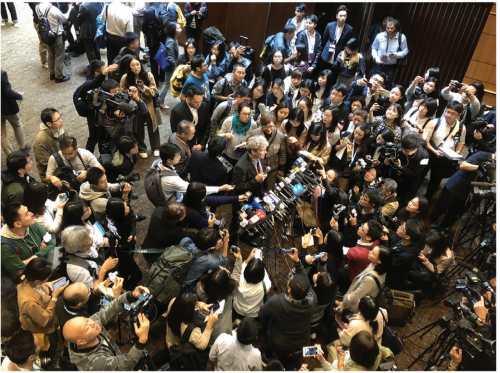
As with the rest of the summit, the first four talks of the session were excellent and stimulated some good discussion. However, everyone was anticipating JK’s talk. There was a nervous wait between my calling him to come on to the stage and his appearance, and then we couldn’t hear anything because the cameras were going off continuously. I had to ask the photographers to stop before things quietened down enough for JK to give his talk. Matt Porteus then joined us on the stage and the two of us questioned him to ensure we all had the full story. This is when it transpired that there was a second woman with an early pregnancy from a genome-edited embryo, and that JK himself had taken the consent from the ‘patients’ (the prospective parents), which is against standard practice in experimental clinical practice. David Baltimore, the chair of the organising committee, then made a personal statement, relating his views – essentially his horror and dismay at what he had just heard –before I took questions from the audience and read selected ones from the media. The whole idea was to get JK to talk, because we knew that this would be the only opportunity that most people would have of interacting with him. The questions were often challenging and the answers sometimes evasive, sometimes direct, but all revealed how much JK had thought his work important, but how little he matched normal standards of evidence and clinical practice.
JK did not want to face the media after the session and was whisked away by the security team. He returned fairly promptly to Shenzhen, where he lives, although he was rapidly barred from his university, who deny knowledge of his activities. There is now an official investigation into what JK has done, and how he managed to evade proper oversight. He is apparently not under arrest, but he is being guarded and it is likely that his movements are restricted.
So, what do we know about the study itself? We know that JK submitted a paper(s) to a journal, but it is doubtful that the study meets the (or any) journal’s requirements concerning ethics approval, consent, etc. The hospital referred to in some of the clinical trial documents denies knowing about the work, although it is possible this might be to protect the identity of the families concerned. The latter was something JK stressed was important, but he clearly had not thought through very carefully what would happen to them when the story broke. We also know that there were eight couples enrolled in the trial, but that one dropped out. In total, many embryos have been manipulated, cultured, subjected to preimplantation genetic diagnosis (PGD) and then frozen. We don’t know how many attempts have been made at transferring them. All we know is that two embryos from one couple were implanted, which resulted in the twin baby girls (known as ‘Lulu’ and ‘Nana’), and that another embryo transfer has led to an ‘early stage pregnancy’. It is clear that JK, who is a physicist by training, had been building up to do this for quite some time, but he clearly bypassed the normal practices of science and clinical practice. He apparently did talk to a few experts on genome editing, but ignored their advice, and should have talked to more. He did not properly consider the risks of using genome-editing techniques in human embryos; indeed, he ignored evidence indicating incorrect on-target alterations, off-target events and mosaicism in the embryos that were implanted. Moreover, JK did not give adequate thought to the gene he was targeting. CCR5 is clearly an interesting gene. It is the subject of the first somatic genome-editing clinical trial for treating patients with HIV/AIDS. There are millions of people who naturally have mutations in CCR5, the most common being the delta-32 mutation, which is thought to have arisen in Northern Europe and confers resistance to HIV/AIDs. Perhaps that is why JK thought that making babies with this mutation would be fine. But he clearly hadn’t read widely enough or thought deeply enough about the consequences. There are almost no people with the delta-32 mutation living in China (Jiang et al., 1993). Therefore, it is necessary to ask ‘why?’ Perhaps the mutation simply has not spread this far. Or is it because carrying this CCR5 mutation might also confer susceptibility to something else? It is already known that it makes individuals more sensitive to Western Nile virus. There are also claims that it can make people more sensitive to the bad effects of influenza, although there are also reports suggesting that it does not (e.g. Matos et al., 2019). These studies deal with relatively low numbers of individuals in different countries, before or after recent pandemics may have skewed results, making it difficult to come to any conclusion, and certainly not with respect to the consequences of mutating CCR5 in individuals of Chinese origin. Some papers published a while ago do report other different specific CCR5 mutations in China (Ansari-Lari et al., 1997; Shioda et al., 2001), with some in vitro evidence suggesting weak HIV resistance, but there does not seem to have been any follow-up studies to confirm this. JK may have been aware of this research, but went ahead anyway, without judging that more needs to be done to provide concrete data. It has also been reported that decreased CCR5 activity can improve cognitive function in mice (Zhou et al., 2016). Of course, mice and humans are very different, but this raises the issue of whether mutating CCR5 might actually ‘enhance’ individuals rather than just making them resistant to a virus. Again, JK said publicly that he was aware of this study, but he ignored it.
He clearly bypassed the normal practices of science and clinical practice.
JK’s rationale was clearly to make children resistant to HIV. Apparently, there is a lot of stigma associated with being HIV-positive in China, or even having a family member who is, and children with HIV-positive parents are often ostracized. This may sound like an acceptable reason, but dealing with the social issues should really be a priority. Moreover, if the father is HIV-positive, as in this case, there are already methods to prevent HIV transmission to children that work extremely well. These involve first ensuring that the viral load is low by providing anti-viral drugs, and then washing the sperm prior to IVF. There was, therefore, no compelling reason or unmet need to use germline genome editing of CCR5.
The genome-editing technology itself is, in most people’s opinion, not yet ready for use, but this is also something that was overlooked by JK. It is clear that both babies are mosaic for the edits, i.e. not all their cells contain them. This happens when the edits occur in the late one-cell embryo or even at the two-cell stage, and current research seeks to develop methods to avoid this inefficiency. While off-target events don’t seem to be as much of a concern now, there are still issues with on-target events not being necessarily what you want. JK used simple non-homology end joining (NHEJ) to make small mutations. Initially, he told us that he was trying to recreate the delta-32 mutation but that this hadn’t worked in one of the babies. In fact, what we know now is that it had not worked at all: none of the embryos he implanted contained delta-32 mutations. They harbour completely novel mutations, of which we have absolutely no understanding. They may fail to confer HIV-resistance and could even lead to deleterious effects on the immune system or the brain. There was no preclinical data to assess the consequences of the specific mutations engineered by JK in the embryos before they were transferred in to the mothers. All this shows that JK didn’t know enough about CCR5 or the potential risks of tinkering with this gene. Of course, we could now recreate those mutations in mice or other animals and determine their effects. In theory, it would also be possible to take blood samples from Lulu and Nana when they are older and see whether their white cells are resistant to HIV. However, it’s not going to be easy to fully understand the effects of the mutations he made. The role of CCR5 in the brain is poorly understood, and it will not be simple to test the consequences of the mutations made, on either HIV resistance or CNS function. Nor will it be trivial to assess whether such genome-edited individuals are more prone to the serious effects of influenza, etc.
JK had not published any of his preclinical data, raising some doubt that he was competent to carry out what he has claimed, but in failing to do so he has given the impression that he wanted to conduct the work in secret. Of course, this also means he has failed to benefit from the critical process of peer-review. He obviously hadn’t taken sufficient advice to understand the best way of going about doing a very novel, clinical procedure. He also seems to have assumed he knew best when it came to the ethics of what he was doing and the way to obtain consent from the parents, when in reality this fell far short of normal practice, with JK conducting much of this himself, apparently with his ex-mentor Michael Deem (from Rice University, Houston, TX, USA), another physicist. He also did not talk to the relevant regulators to seek their approval. Yet he did seem to be aware of the regulations; however, when challenged, he argued that they were guidelines – they weren’t laws – and that they were drawn up with respect to stem cell research and were not relevant to what he had done. Naturally, there was quite a lot of discussion at the summit about whether or not what he did was illegal. We will have to wait and see exactly what happens, but most commentators in China say that he has directly contravened laws, although it is unclear whether there are any penalties prescribed for doing so.
So why did JK do this? I think that he honestly thought he was doing a good thing and that everyone would realise this. He seems a driven and ambitious person, who had had success in his work on genome-sequencing technologies, and he wanted to be the first to carry out germline genome editing. He told us that his hero was Bob Edwards, who pioneered IVF, and that he thought it was amazing how many babies have been born through this approach. JK thought germline genome editing would be the next big thing and wanted to emulate his hero. However, Edwards published all the experimental and preclinical work that led up to the first successful application of IVF, and subsequent research. Other scientists, clinicians and the relevant authorities knew what Edwards was doing and why. There weren’t specific regulations at the time, and there probably had not been much public dialogue beforehand, something that has subsequently become important, but Edwards didn’t do anything against people’s expectations, and his intentions were not just clear, they were open. In contrast, JK failed to do any of this.
JK’s rationale for doing what he claims was to try to make children resistant to HIV. Some have argued that this is a form of enhancement, and that this is wrong in itself. However, it is not as simple as that. Vaccines give people disease resistance and their use is not only widely accepted, it is encouraged. However, JK did not properly take into account the risks of editing CCR5, and the way that he did this, versus any benefit. Making novel genetic alterations, especially in a gene whose normal function is not sufficiently well understood, poses lots of risks, and of course there are risks to the children if their identity becomes known. Moreover, all these risks are unnecessary since, as mentioned above, there was no clinical need or benefit for the genome editing in this case. But are there instances in which genome-editing human embryos might be beneficial? In my opinion, there are. For instance, there are cases in which one parent is homozygous for a dominant disease-causing mutation – an obvious case is Huntington’s disease. Although this is very rare overall, there are clusters of individuals where this happens, and thus cases where such diseases have blighted families for generations. There are also rare instances where both parents are homozygous for a recessive deleterious variant of a gene and, again, it is not possible for them to have children that aren’t affected. In the case of heterozygote parents, PGD following IVF can be used to select embryos that aren’t affected. But while PGD sounds straightforward – it involves testing for the presence of the abnormal and normal allele in a biopsy of a few cells taken from each preimplantation embryo after IVF, and only implanting those that are disease free – there are lots of complications associated with this approach. It is necessary to find an embryo that is going to be free from the disease, but that is also good enough quality to give you a child, and that’s often a challenge, especially if the number of embryos obtained is low, which happens all too often. Some genetic diseases affect fertility, adding to the problem. A recent paper that evaluated data on PGD showed that a surprisingly large number of families never got the child they wanted because it was just too inefficient (Steffann et al., 2018). And that’s just if you’re screening the embryos for one gene variant. If you have to do two or more, it becomes really difficult to find an appropriate embryo to transfer. This is the case for ‘saviour’ siblings, where a couple already have one child, but that child has developed leukaemia, and they want to have a second child anyway in order to use bone marrow from the second child to rescue the first. Indeed, in a recent programme conducted at Harvard Medical School involving eight families, each woman went through, on average, five cycles of IVF, which is a lot, but only one baby was born who could be a saviour sibling. By using genome editing to correct the mutation leading to leukaemia, and by just carrying out the screening for tissue typing, it may have been possible to have helped all of those families.
But are there instances in which genome-editing human embryos might be beneficial? In my opinion, there are.
We also need to be aware that, as somatic gene therapy and conventional treatments improve, we are going to reach a situation where many more individuals suffering a genetic disease will survive to reproductive ages. They may want to have their own genetically related children, but without passing on probably even one deleterious allele to their children. Duchenne Muscular Dystrophy, for example, is an interesting case. Very few boys with this survive to reproductive age. However, if somatic gene editing works, those boys will now have the gene corrected in the relevant somatic cells but not in their germline. They might feel that embryo genome editing could give them the chance to overcome this and have children of their own that are unaffected and also not burden future generations with the need to undergo PGD or be fearful of having children. Overall, I think there is a medical need for genome editing in human embryos, a conclusion reached by the US National Institutes of Sciences’ and the Nuffield Council’s reports on human genome editing and by other organisations.
Although it is still too early to begin clinical trials, I think it would actually be irresponsible for us not to explore this opportunity further. We need to do the basic research, determine exactly what we can and can’t do, and work out whether we can really make genome editing efficient and safe enough to use in human embryos. The science is progressing fast, and new methods look very promising. The newly developed approach of base editing, for example, may be much safer than other approaches because it doesn’t involve a double-strand DNA break and hence avoids NHEJ-induced inappropriate on-target deletions or insertions. Off-target effects can be minimised by careful design of guide RNAs and through introducing the genome-editing components to minimise the period during which they can act. In fact, evidence now suggests that off-target effects are very rare. For example, work from my colleague Kathy Niakan (Francis Crick Institute, London, UK) revealed some on-target problems, but no off-target events (Fogarty et al., 2017). Shoukhrat Mitalipov (OHSU, Portland, OR, USA) also used genome editing in human embryos and did not observe off-target events (Ma et al., 2017, 2018). Even in JK’s study, the PGD analysis suggested that while there might have been an off-target event in one embryo, when they analysed DNA from the babies at birth this had disappeared. But of course, we have not seen all the data and how it was generated; there could be additional off-target events of which JK is unaware.
Assuming we can get to a point where the editing is efficient and safe, we clearly need to make sure it is used appropriately. Indeed, in the NAS report on Human Genome Editing (published in February 2017), we set out various guidelines, conditions and principles that should be considered when editing the human genome. These clearly weren’t enough to stop JK, so there have been, of course, calls for a moratorium. But I don’t think this would serve any purpose. How do we enforce one? Should this be just a temporary pause? For how long? What conditions would need to be met before we could lift the moratorium? Would a moratorium have stopped JK? I don’t think it would have. Moreover, to achieve a moratorium you would have to have consensus from all countries, which is again extremely unlikely. Therefore, I think it’s more a question of coming up with better guidelines. This would have to be carried out in a much more detailed way than has been the case to date. We clearly need to set out the minimal conditions that would have to be met with respect to a variety of issues: the scientific and clinical issues surrounding the gene that is being modified; the types of alleles that are being altered; the clinical need for the suggested alteration; and the efficiency, accuracy and safety of the proposed techniques (in terms of off-target events, on-target events, mosaicism, etc.). We should also establish the minimum requirements in terms of preclinical data (e.g. experiments in animals, human stem cells and perhaps in human embryos in vitro) and ask that they should be published. Processes for obtaining consent and ethical review approval should also be spelled out. Finally, we should also detail how the patients would be looked after and tracked, how we could actually diagnose what has happened in the embryos, how long-term follow up studies would be reported, and how patient protection and privacy will be considered. It has been suggested that this call for such a detailed translational pathway might encourage clinical applications and potentially ‘rogue’ applicants. However, my view, and that of the summit organising committee, is that it would act to discourage them if it is sufficiently detailed and stringent; it should deter practitioners who cannot meet those conditions. They will know in advance that they will not get support from other scientists, clinicians, regulators, local ethical review panels, journals, etc., unless the requirements have all been met. Once we have this kind of framework, countries can use it appropriately, adapting it into their own regulatory systems. But we do need to make sure that the rules and regulations we set now are flexible enough to account for rapid progress in the science and in the attitude of the public who may benefit.
Of course, this is not the first time that the development or application of a biological technique has shocked or concerned the public: recombinant DNA, the first IVF baby, Dolly the cloned sheep and mitochondrial replacement were all met with opposition when they were first announced. Is this case any different? I’m hoping that we get over the shock, and that genome editing of human embryos gradually becomes a viable and sensible approach to deal with some distressing genetic conditions.
When the first test tube babies were announced, the public and the media were generally very happy about it. But this was soon followed by a backlash. In that case, the backlash was driven largely by gut reactions and fear of dystopian futures coming from science fiction, although religious, ‘pro-life’ and anti-progress views also contributed. Of course, things then calmed down and IVF is now a well-accepted technique, albeit one where new developments still occupy the media. ‘Three-parent babies’ produced by mitochondrial replacement was also an approach that created a lot of fuss, but the notion behind it has become more widely accepted. Actually, I think this technique and its application represents a good lesson on how you should go about developing a new technology that applies to human embryos. Lots of hard work went into looking at the science, evaluating the clinical need, exploring the ethical issues, asking the public for their views, changing the law in the UK and establishing detailed regulations and guidelines, including considering the future welfare of the patients and any children born. Notably, all of this was carried out in an open manner, with all the preclinical scientific data published and active debate encouraged. Now, based on this process, other countries such as Australia and Singapore might change their regulations to make mitochondrial replacement possible. It’s a pity that JK did not follow this example.
This level of public exposure can only be good for the field and highlights the importance of establishing a dialogue with the public.
Overall, while JK’s behaviour has largely been deemed unconscionable by the scientific community, ethicists and others, I don’t think we should consider this a big setback to the field. JK seems to have been driven in part by ambition and a desire for fame – his motives were just wrong. But we should use his case as an opportunity to highlight how things should be done and how the vast majority of scientists – including developmental biologists – are actually very responsible. The whole affair has had another good outcome, in that it has certainly stimulated much wider debate than we ever thought would be possible. Just as a simple example, the organising committee of the first summit on Human Genome Editing in 2015 were delighted that between 6000 and 7000 people watched the live webcast. We had 1.8 million watch the live webcast this time. In addition, the worldwide media coverage means that many, many more people have been talking about the topic and thinking about these issues. Although some of this has stirred up negativity, this level of public exposure can only be good for the field and highlights the importance of establishing a dialogue with the public. Indeed, at the public event we ran in Hong Kong after the main summit finished, which was organised with the help of the Hong Kong Association for Rare Diseases and a local Café Scientifique, participants were critical of JK’s actions but were not negative about the potential uses of the technology. In fact, many realised that it could have great benefit. This just highlights that we need to talk more with the public about these kinds of techniques. Obviously, genome editing – in both the germline and somatic cells – needs to be considered. However, there are other techniques, such as culturing human embryos in vitro beyond the current 14-day limit, embryo-like entities and human-animal chimeras, that need to be debated. Another big issue is in vitro-derived gametes: if we can make eggs and sperm in vitro then this will change many things, not just in terms of research, but potentially in terms of reproductive options. All these ‘ethical minefields’ really need to be discussed more broadly, with a goal to develop flexible but robust regulation that can keep up with changes in both science and public attitudes.
I know that public engagement exercises are often expensive, and it is sometimes hard to reach out to people and give them the information that’s needed for them to be properly involved in these types of discussions. However, we clearly need participation from many more scientists and other relevant individuals (e.g. ethicists, regulators) to raise the level of the conversation with members of the public, not only to make sure that they are well informed, but also to seek their views. The decision of whether or not techniques such as genome editing in human embryos ever go into the clinic cannot be a decision made by scientists or clinicians alone; it has to be a decision that is made by all those concerned.
Acknowledgements
This article, which originated from an interview with Seema Grewal (Senior Editor, Development), is a personal reflection of the events that occurred prior to or at the Second International Summit on Human Genome Editing, and its style reflects this. I am indebted to my colleagues on the summit organising committee and from the Academies, and our hosts at the University of Hong Kong, who not only put together an excellent meeting but coped so well with the whole episode involving JK.
References
Ansari-Lari, M. A., Liu, X. M., Metzker, M. L., Rut, A. R. and Gibbs, R. A. (1997).
The extent of genetic variation in the CCR5 gene. Nat Genet. 16, 221-222.
Fogarty, N. M. E., McCarthy, A., Snijders, K. E., Powell, B. E., Kubikova, N.,
Blakeley, P., Lea, R., Elder, K., Wamaitha, S. E., Kim, D. et al. (2017). Genome
editing reveals a role for OCT4 in human embryogenesis. Nature 55, 67-73.
Jiang, J. D., Wang, Y., Wang, Z. Z., Chen, X. H., Guo, Z. M., Pan, H. L., Bekesi,
G. J., Wang, A. X. and Chen, H. S. (1993). Low frequency of the ccr5delta32 HIVresistance allele in mainland China: identification of the first case of ccr5delta32
mutation in the Chinese population. Scand. J. Infect. Dis. 31, 345-348. https://
www.ncbi.nlm.nih.gov/pubmed/?term=10528870.
Ma, H., Marti-Gutierrez, N., Park, S. W., Wu, J., Lee, Y., Suzuki, K., Koski, A., Ji,
D., Hayama, T., Ahmed, R. et al. (2017). Correction of a pathogenic gene
mutation in human embryos. Nature 548, 413-419.
Ma, H., Marti-Gutierrez, N., Park, S. W., Wu, J., Hayama, T., Darby, H., Van
Dyken, C., Li, Y., Koski, A., Liang, D. et al. (2018). Reply. Nature 560, E10-E23.
Matos, A. R., Martins, J. S. C.C., Oliveira, M. L. A., Garcia, C. C., Siqueira, M. M.
(2019). Human CCR5Δ32 (rs333) polymorphism has no influence on severity and
mortality of influenza A(H1N1)pdm09 infection in Brazilian patients from the post
pandemic period. Infect. Genet. Evol. 67, 55-59.
Regalado, A. (2018). Chinese scientists are creating CRISPR babies MIT
Technology Review, 25 November. https://www.technologyreview.com/s/
612458/exclusive-chinese-scientists-are-creating-crispr-babies/.
Shioda, T., Nakayama, E. E., Tanaka, Y., Xin, X., Liu, H., Kawana-Tachikawa, A.,
Kato, A., Sakai, Y., Nagai, Y. and Iwamoto, A. (2001). Naturally occurring
deletional mutation in the C-terminal cytoplasmic tail of CCR5 affects surface
trafficking of CCR5. J. Virol. 75, 3462-3468. https://www.ncbi.nlm.nih.gov/
pubmed/11238872.
Steffann, J., Jouannet, P., Bonnefont, J. P., Chneiweiss, H. and Frydman, N.
(2018). Could failure in preimplantation genetic diagnosis justify editing the human
embryo genome? Cell Stem Cell 22, 481-482.
Zhou, M., Greenhill, S., Huang, S., Silva, T. K., Sano, Y., Wu, S., Cai, Y.,
Nagaoka, Y., Sehgal, M., Cai, D. J. et al. (2016). CCR5 is a suppressor for
cortical plasticity and hippocampal learning and memory. eLife e20985.
 (No Ratings Yet)
 (2 votes)