We are creating an exciting new role to enhance the community content on our journal websites.
We publish five important journals that serve the biological research community. All have effective publishing platforms and a good social media presence. We now seek to extend our community engagement, raise awareness of our charitable activities and build connections with early career scientists.
We are looking for an enthusiastic and motivated team player to support us in this initiative, which is initially planned as a 2—3 year project to determine future directions. Working with experienced editorial teams, you will have the opportunity to develop content for the journal websites that appeals to our communities. We are open to new creative ideas.
Core responsibilities include:
Engaging the scientific community through the journal websites.
Generating more dynamic content, including writing short pieces to draw in a broad audience.
Measuring usage and online behaviours to assess and guide strategies.
Working with the journal teams on other community engagement content such as social media and video interviews.
Seeking opportunities to actively engage early career scientists.
Identifying opportunities within an evolving engagement strategy.
Diplomatic and collaborative liaison with multiple teams, balancing their needs as we develop cross-title projects.
The successful applicant will have:
Research experience in the biological sciences, ideally a PhD in a field relevant to one or more of our journals.
Experience with community engagement such as blogging, social media or outreach.
A strong understanding of the opportunities presented by the online environment.
Excellent and proven writing skills.
Web skills would be an advantage (creating and editing webpages, CMS).
With an attractive salary, this is an exciting opportunity to work on prominent and highly successful journals within a well-established publishing company. The role is based in our attractive modern offices on the outskirts of Cambridge, UK.
The Company of Biologists (biologists.com) exists to support biologists and inspire advances in biology. At the heart of what we do are our five specialist journals – Development, Journal of Cell Science, Journal of Experimental Biology, Disease Models & Mechanisms and Biology Open – two of them fully open access. All are edited by expert researchers in the field, and all articles are subjected to rigorous peer review. We take great pride in the experience of our editorial team and the quality of the work we publish. We believe that the profits from publishing the hard work of biologists should support scientific discovery and help develop future scientists. Our grants help support societies, meetings and individuals. Our workshops and meetings give the opportunity to network and collaborate.
To apply, please send your CV by email to recruitment[at]biologists.com along with a covering letter that states your current salary, summarises your relevant experience and explains why you are enthusiastic about this opportunity. You must be able to demonstrate your entitlement to work in the UK.
Applications should be made as soon as possible and by 4th December (late applicants may be considered)
At the BSDB’s Autumn Meeting on chimeras, scientist and artist Mia Buehr exhibited some of her art inspired by developmental biology. Here, she introduces her pieces. You can keep up with her work at theaccidentalembroiderer.typepad.com
I was born into a family of artists, and painting and drawing were always second nature to me. However I was also deeply interested in animals and eventually did an undergraduate degree in zoology followed by a post-graduate degree in genetics and development. When I first arrived in the UK from America, I was lucky enough to meet Anne McLaren, and then worked in her lab for some 22 years, at first in Edinburgh and later in London. When she retired I moved to the lab of Austin Smith in Edinburgh, where I stayed until he took over the directorship of the Wellcome Trust Centre for Stem Cell Research in Cambridge.
Throughout my career in science I sketched as a hobby, and when I began to work less in the lab I began to draw and paint more. However it wasn’t until recently, at the suggestion of Dr Jenny Nichols, that I began to think of using themes and ideas from biology in art. Jenny arranged for some of my work to be shown at the autumn meeting of the BSDB, in Edinburgh, where it was well received, and this encouraged me to devote more time and effort to working with biological images. Here are a few of the first things that I did. They are all made with computerised machine embroidery, a technique usually used commercially for such things as embroidering logos on hats and sweatshirts. However I find that it’s also an intriguing medium to use for more interesting subjects.
I continue to interpret images from biology in drawing, painting and fabric art, and would welcome suggestions from other members of the community for suitable subjects. Biology is an intensely visual science and fascinating images, which could be so effective as subjects for art, are abundant in all fields of biological research.
Germline
Chimaera
8-cell
Compacting
Blastocyst
Culture
Purkinje
Egg
Zebrafish
Embryo fish
Newts
Doe and fawn
Structural Bird
Structural Deer
Independent assortment
Germline
A chimaera, an animal made up of cells of more than one genetic origin, is represented in this picture by the grey mouse, presumably developed from cells of white and black mouse strains. But the cells of the chimaera maintain their own genetic identity and may appear again in its progeny. In this case the young white and black mice illustrate that the cells of both white and black strains can still give rise to living animals. This shows that the grey mouse is a germline chimaera, something that all those of us who work with chimaeras would recognise as a successful result
Chimaera
This is simply a stylised representation of how a chimaera is formed from a combination of two (or more) different cell types: the yellow and brown mice “merge” in the form of a chimaera.
Conceptual chimaera
This somewhat allegorical version of a lab rat may not be immediately recognisable as a chimaera, but he was inspired by the idea of chimaeras. As a chimaera is made up of cells from more than one genetic origin, so this rat is made up of different patterns that come together to make a whole.
Strains
There are hundreds of different strains of mice, and the variation in coat colour and pattern between them is fascinating. Here are just a few of them: you may recognise C57/Bl6, CBA, 129, DBA, W, JF1/Mg and BALB/c
Pre-implantation
This series of images is inspired by the earliest stages in the development of the mouse embryo, from the 8-cell stage, through compaction to the morula and finally the blastocyst. They were interesting designs to create, because they’re all basically round balls of cells – that is, three-dimensional structures – and it was an intriguing challenge to use different densities of embroidery to give this three-dimensional effect. You may notice that the blastocyst has the addition of several alien cells (in red) which suggest that it’s an injection chimaera
Culture
Here are some cells as they might appear in culture. It’s true that they seem to be plant rather than animal cells, but of course botanical material has just as much visual appeal as cells from an animal. The red and blue colour scheme reflects conventional haematoxylin and eosin staining but it also makes for a cheerful and colourful image. The green cells suggests that not all cells in a culture may be identical – maybe these are cells derived from a chimaeric organism
Purkinje
And while we’re on the subject of cells, here are some Purkinje cells of the brain. Not only do they have a fascinating structure, but they can sometimes take on wonderful colours when tissue sections are stained for the microscope. These colours are of course not a part of the cells or their function but they’re still beautiful to look at. And I love the beautiful branching, tree-like patterns the cells make
Young chick
As a mouse embryologist I’m more familiar with the mouse than with any other animal. But other animals have also contributed hugely to understanding of genetics and embryology. One of these is the chick, a fascinating organism, and here is a young chick developing in the egg, perched on top of the yolk…
Egg
…and here it is when a little bit older
Zebrafish
Another important research organism with which I have no practical experience is the zebrafish, but after reading some papers on zebrafish genetics it proved impossible to resist responding to the huge variety of colours and patterns produced by various crossing experiments. Here are a few of the many different colour and pattern variation of zebrafish that I’ve seen
Embryo fish
And while we’re on the subject of fish, here’s a very young, embryonic fish
Newts
As my PhD thesis was about amphibian germ cells I had to include an amphibian image in the collection somewhere. I particularly liked this piece because it shows how subtle the machine embroidery technique can be. You can’t see it from the scan, but the eggs and embryos are made up of four separate layers of thin embroidery. They look different depending on how the light hits the embroidery – sometimes you can see the embryos clearly, and sometimes they’re hardly visible at all.
Doe and fawn
Of course deer aren’t usually used as subjects in genetics and embryology (although I did once start a project about stem cells in deer antlers) But I like deer, and we have so many where I live in Aberdeenshire that I had to put one in. This is just a doe with her as-yet-unborn fawn
Structural Bird / Structural Deer.
The visual relationship between the skeleton and the soft tissues of the body is such a complicated one that I’ve never really managed to capture it in a visual image. So these are simple compromises doing no more than suggesting the importance of the skeletal structure that underlies the entire shape and form of the living animal
Independent assortment
And finally a childishly simple visual interpretation of the phenomenon of independent assortment, visualising how the alleles governing various blue and silver phenotypes might be re-distributed in the progeny of the fish. It’s far from what you could call a scientific presentation, but it’s effective as an image, and it was fun to do
This interview by Catarina Vicente first featured in Development.
Paola Arlotta is a neurodevelopmental biologist based at the Harvard Department of Stem Cell and Regenerative Biology in Boston, MA, USA. Her lab studies the birth, differentiation and assembly of neuronal circuits in the cerebral cortex with the aim of developing novel therapies for degenerative and neuropsychiatric diseases. Paola has recently become an editor for Development, and we asked her about her research and career, and her recent efforts to support women in science.
When did you first become interested in biology?
I can’t remember a time when I was not interested in biology. My parents tell me that even as a child I was very curious about nature, and would spend hours in the garden digging up worms and looking at ants. I became seriously interested in biology in high school. I had an incredible science teacher who was very inspirational. He made us think deeply about how nature works, we did experiments, it was always very exciting. I knew that I had to study biology at university, and that is what I did.
Your lab studies the birth, differentiation and circuitry assembly of neurons in the cerebral cortex. Why does this topic interest you?
The cerebral cortex interests me because it is really the part of the brain that makes us human and controls the most complex functions that human beings are capable of, such as language – we are having this very conversation thanks to our neocortex. The neuronal cell types that underlie those complex behaviours have fascinated neuroscientists for centuries. Now, due to technological advances, we can really examine these cells. We can begin to understand mechanistically how this outstanding numbers of neuron types is made, how they choose their partners in order to make the circuits that underlie cerebral cortical functioning, and so on. Looking at this system is fascinating. I am intrigued by complex systems; they’re really hard to study, but it’s very rewarding.
What are the questions that your lab is currently tackling?
The central focus of our work has been to understand cortical development, and the mechanisms of fate specification and maintenance of neuron identity. But lately we have started to address fascinating new questions, some more fundamental while others more applied. For example, we are very interested in understanding how the diversity and function of cerebral cortex neurons, in particular the excitatory pyramidal neurons, affects the behaviour of other cells. We are particularly interested in their interaction with oligodendrocytes, the cells that myelinate the axons. Starting from this fundamental question – whether there is a special type of communication between neurons and oligodendrocytes – we made a very interesting discovery. It was previously thought that myelin was deposited along the axons of all neurons using the same mechanism. We discovered that this is not in fact true for all neurons. We are realising that the interactions are more complex and involve many different classes of cells. We are following the idea that there might be node-type cells, in this case pyramidal neurons, that can influence the behaviour of other cell types, and this system can evolve and change really quickly, guaranteeing the more complex functions of the cortex.
Another fundamental question that may have translational impact relates to the stability of neuronal identity. All neurons in the mammalian cerebral cortex, including our own, are made during embryonic development. We live and die with the cells that were made when we were embryos, so a human neuron can last 100 years. The dogma in the field is that neurons cannot change. Once they have a certain identity they keep it for the life of the organism. We are beginning to challenge that, although this is a very new field and there is much that we don’t understand. It seems that within the first couple of weeks postnatally, the young neurons of the mouse brain can actually change their identity if you challenge them with a powerful enough transcription factor. This suggests that neurons have the ability to change. My lab is building on this initial work. This is a very important question from a fundamental point of view because it can tell us whether neurons stay the same during the life of the organism or not. But it is also interesting from a therapeutic point of view because it might be an alternative way to achieve neuron replacement in vivo. Many neurodegenerative diseases affect only certain classes of neurons. Perhaps it might be possible to turn some of the spared neurons into those that the disease affects.
You recently started using brain organoids to study development and disease. Can you tell us about this technology and why it’s useful to you?
I have become very interested in complex neurodevelopmental diseases like autism-spectrum disorder and neuropsychiatric diseases. We know so little about these diseases; in some cases we don’t even know which neurons or circuits are targeted, although we do know that the cerebral cortex is affected in most cases. We also know that these are diseases of the human brain that fundamentally affect core human capacities, so they are very hard to model in mice. We (like others) are using what we know about the normal development of the cerebral cortex to attempt to induce the formation not just of neurons or glia, but of actual brain tissue, including the cerebral cortex, in a dish. This is what I call ‘next-generation’ 3D organoids. They are very complex tissue-like structures that start from human pluripotent stem cells, then form embryoid bodies, and later form primitive ventricles and vesicles, a process which, at least morphologically, resembles early brain development. We have built on the protocol that was developed by Juergen Knoblich and others, and we have tried to extend the developmental window of these organoids as much as we can to be able to look at circuits. To achieve this, organoids have to grow and develop for a very long time so that they attain cellular diversity and then form a meaningful set of circuits that we can study. I am very excited about this project because it is the first time that we have been able to build on our knowledge of development to attempt to model a meaningful replica of what we see in vivo. And because we are using human cells, these 3D organoids could be incredible screening platforms to understand how disease mutations affect human circuits, and for clinical and drug screening.
Do you think there are ethical issues with ‘growing a brain in a dish’?
I think we need to be confident but careful with this type of work. There is a lot of misconception out there regarding what these models really are. I don’t like it when people call them ‘mini-brains’. They are only a very oversimplified replica of what you find in vivo. We are still trying to understand how to make them develop, even on a micro scale, and attain the cellular diversity and circuits that we know exist in the human brain. So, calling them ‘mini-brains’ is just making a headline. Yes, we need to be careful not to cross ethical boundaries, but at the same time these models could be extremely powerful to understand devastating human diseases about which we know nothing. We should keep this in mind when we think about what should and should not be done.
Your work is at the crossroads between the neural development and stem cell fields. How do you think the relationship between these two fields is evolving?
When I was interviewing for a lab head position, I had to make a choice about the kind of department that would be ideal for my work – either a neurobiology department or a stem cell department. At the Harvard Department of Stem Cell and Regenerative Biology I can have both, because I am also surrounded by an incredible community of neuroscientists. What I have learned from being at the interface between neuroscience and stem cell biology is that if you are trying to model complex tissue and organ physiology, you really need both expertises. You need a stem cell biologist to understand the starting point and the potential, and to really push the technological boundaries. But you also need to have a deep understanding of the type of tissue and cells that you are trying to model. If you are working on a disease of the brain, chances are you need a neuroscience background, or to collaborate closely with a neurobiologist. I think this interface is growing. When I first started there was not as much participation by neuroscientists as I see today. It was necessary for people to appreciate the limitations of the neuron differentiation protocols to allow the field to develop. Now the cream of neuroscience is really embracing the idea that you can make meaningful neurons, and now even meaningful tissue, in the dish that resembles what they are used to seeing in vivo. I think that’s wonderful because we do need neuroscientists working with stem cell biologists to push this field to the next level. The more this interface is fostered via funding and meetings that bring people together the better it will be.
You have recently become an editor for Development. How do you hope to contribute to the journal?
I was very excited to join. I grew up as a scientist reading the journal and I really respect the other editors. I think my contribution is related to this interface between stem cell biology and neurobiology. My roots, and the majority of the work done in my lab, is on neurodevelopment, but I am a faculty member in a department submerged in stem cell biology. I can see from the colleagues around me where the field is going and where the excitement is. I think I can bring this unique perspective. I would really like to see more high-level papers in Development that bring together neurobiology and stem cell biology, regenerative biology and disease modelling.
Recently you and other prominent scientists proposed a list of seven actionable strategies for advancing gender equality in science, technology, engineering and mathematics (STEM). Why did you think it was important to write this document and what do you hope to get out of it?
It was very important for me to write this document. As a woman in science I always felt respected and valued. I never felt that because I was a woman I couldn’t get the faculty position I wanted, for example. However, even in an ideal situation like mine, I still feel that there were times in my life when I really had to make very difficult choices between being the mother and the scientist that I really wanted to be. I probably had my children at the worst possible times. I had my daughter in the last two years of my postdoc, when you do most of your work and interviews, and my son during the first year of my lab. But it turned out ok and I am of the firm belief, which I try to tell to all the young women that train in my lab, that you should do things for your personal life when you think is the right time for your personal life, and not when people think it is a good time for your career. You will then find a way to make it work. That said, I feel that certain practical things that can be addressed with money could have made the process much easier, especially in the first year after my children were born. I would have liked to have been able to spend a little more time with them, or stay at home a little longer on maternity leave, without fearing that my lab would not progress as fast as it should. It is important to raise awareness of this issue. There are not many women that choose to go onto a faculty position after their postdoc that will lead them to leadership in their field, and this is true both for academia and industry. This is because it requires you to invest so much of your personal time when you also have to invest so much effort and love in your own family – if you have one.
I am a practical person and I think there are practical solutions that can be implemented at an institutional level. I and others at the New York Stem Cell Foundation started with this first but, I hope, meaningful step. With these first seven points we tried to highlight the issues in the field, and we suggested ways to address them. Since the publication of this article we have met twice more as a group and have expanded our score card to include many other detailed points, but we wanted to start with a simple strategy so that the idea could take ground. We would like to make the leaders of major institutions accountable for the number of women they recruit and retain, in order to receive certain funding. Many funding agencies are becoming sensitive to this issue, and are considering ways to raise awareness and implement changes. This is by no means our own original idea, and we were inspired by what the Athena SWAN project is doing in the UK. Our project aims to find real solutions that are practical, doable and implementable, and that can change the situation for women in science. And these changes will benefit male scientists as well. I want my postdocs to know that this is the most beautiful job that they could have. It doesn’t have to be done with difficult decisions that neglect some of their fundamental needs.
What is your advice for young scientists?
I think that they should follow their dreams, and I really mean it. If they have a great idea, if they have a certain vision, they need to be brave from day one to implement it. Be brave, be bold, don’t be conservative! Then science becomes fun, and all the other things we have to deal with, like politics, don’t matter.
What would people be surprised to find out about you?
I was a figure skater for many years, with all of the costumes and jumps that come with it! I am also a pretty hard-core skier. I’ve skied since I was 2 and skated since I was 5 (although I stopped in college). I grew up in Northern Italy and my mum is from the Alps, so it runs in the family. My mum was a climber and a very good skier. She could probably still beat us on the slopes at 72!
Applications are invited for a post-doctoral fellow position (scholarship) in Gonçalo Castelo-Branco´s group, Karolinska Institutet, Stockholm, Sweden (http://ki.se/en/mbb/goncalo-castelo-branco-group) Our research group is interested in the molecular mechanisms defining the epigenetic state of cells of the oligodendrocyte lineage, using transcriptomic and epigenomic approaches ((including single-cell technologies). We are particularly focused on how interplay between transcription factors, non-coding RNAs and chromatin modifying enzymes contributes to the transition between epigenetic states in oligodendrocyte precursor cells, with the aim to design epigenetic based-therapies to induce regeneration (remyelination) in demyelinating diseases, such as multiple sclerosis (please refer to our publications in Neurobiology of Disease 2014, Science 2016).
The applicant must have a strong background in oligodendrocyte/myelin biology, in particular with oligodendrocyte precursor cell culture, FACS sorting, immunohistochemistry/FISH and in vivo work (experience with development biology and/or rodent models of disease such EAE or other demyelination models will be particularly valued). Applicants should hold a doctoral degree or expect to defend in 2016 or early 2017. For more information please visit: https://ki.mynetworkglobal.com/en/what:job/jobID:120966/where:4/
Closing date: 2016-12-15
Gonçalo Castelo-Branco, Associate Professor
Laboratory of Molecular Neurobiology
Department of Medical Biochemistry and Biophysics
Karolinska Institutet
Scheeles väg 1,17177 Stockholm, Sweden
The Copenhagen Bioscience PhD programme offers talented students with a university degree from outside of Denmark an opportunity to launch their careers in the vibrant environment of the Novo Nordisk Foundation research centre cluster. Sixteen students will be recruited annually for enrolment in August. For the start in August 2017, the programme will be open for applications from October 3, 2016 to December 15, 2016.
Students will be selected based on academic achievements, research experience, academic references and interviews. The interviews will take place in Copenhagen on March 19-22, 2017. The Novo Nordisk Foundation will pay for travel and accommodation for selected candidates in association with the interview visit.
General Programme Outline
The four-year programme is divided into a predoctoral year followed by three years of PhD training at one of the Novo Nordisk Foundation research centers (see below). They are based at the University of Copenhagen and the Technical University of Denmark.
The first year of the programme includes short rotations, a common course, common seminars and selection of a PhD project. All awardees will have to pass an examination at the end of the first year in order to qualify for the following three years of PhD education. You can find more information at the programme website.
Salary and tuition fee will be fully covered by the Novo Nordisk Foundation. Housing is offered for the first year, in the city centre of Copenhagen, ranked as the most liveable city in the world, again, in 2016.
Eligibility
A fully completed application form submitted via the Novo Nordisk Foundation’s web-based application system before the deadline.
The programme is open for applicants who have received a university degree from outside of Denmark that would qualify them to enroll into a PhD programme in the country where the degree was obtained.
The programme is also open for applicants with Danish degrees who have at least a year of full-time research experience from outside Denmark.
The applicant must provide a minimum of two academic references.
Proof of English language skills (e.g. TOEFL or GRE scores).
All applicants must have lived outside Denmark for a minimum of one year leading up to the programme start date.
Applicants should not be resident in Denmark at the time of the application deadline.
List Of Centers and Topics
At the Novo Nordisk Foundation Center for Basic Metabolic Research (CBMR) topics are on investigating how the interaction between genes and environment affects the human metabolism. Check out the application website for more details.
At the Novo Nordisk Foundation Center for Biosustainability (CFB) topics include promoting the transformation from oil-based chemical industry into more sustainable biobased industry that meets the needs of society for chemicals and pharmaceuticals manufactured using specifically designed cell cultures: cell factories. Check out the application website for more details.
At the Novo Nordisk Foundation Center for Protein Research (CPR) topics are on integrative protein technologies. Check out the application website for more details.
At the Novo Nordisk Foundation Section for Basic Stem Cell Biology at the Danish Stem Cell Center (BasicStem at DanStem) topics include how to induce stem cells to differentiate into certain types of cells and the specific role of cancer stem cells in developing different types of cancer. Check out the application website for more details.
More Information
For questions about the application process or general questions about the programme, check out the programme and application websites or contact Amelia Green at amelia.green@cpr.ku.dk
Department/Location: Wellcome Trust – Medical Research Council Cambridge Stem Cell Institute, University of Cambridge
Salary: £29,301-£38,183
Reference: PS10618
Closing date: 01 December 2016
Fixed-term: The funds for this post are available for 2 years in the first instance.
The Wellcome Trust – Medical Research Council Cambridge Stem Cell Institute is an international centre of excellence for stem cell research and regenerative medicine. Scientists in the Institute collaborate to advance our knowledge of various stem cell types and to perform pioneering work in translational research areas, providing the foundation for new medical treatments.
We are looking for a self-motivated, reliable and well-trained post-doctoral researcher to join the research team of Dr. Maria Alcolea. Her team will investigate epithelial stem cell plasticity upon tissue regeneration and early cancer using oesophageal models.
In order to protect tissue integrity, epithelial cells have a significant ability to change and adapt their behaviour in response to changing tissue perturbations. Investigating the cellular and molecular mechanisms governing this dynamic cell behaviour, and the potential implications for early cancer development will represent the main focus of this study.
We will utilise a combination of in vivo lineage tracing techniques using genetic mouse models, ex vivo 3D organ cultures, and single cell transcriptional network analysis to define changes in epithelial cell behaviour during tissue regeneration and cancer.
We are looking for candidates who hold a PhD degree or will obtain a PhD degree within a year in the field of biochemistry /molecular and cell biology /developmental biology.
1) Some research experience since completion of PhD.
2) Background in molecular and cell biology.
3) Knowledge in genetic animal models.
4) At least one publication with 1st authorship would be preferable, but not a requirement.
5) Previous experience with in vivo models, gene manipulation and expression profiling, confocal imaging, disease modelling and primary tissue culture methods would be highly advantageous, but not essential.
We are specifically looking for candidates that are collaborative, with effective communication skills and enjoy working in a team. Proven capacity to design, execute, and interpret your own experiments is essential.
Start date is flexible but can be as early as March 2017.
To apply online for this vacancy and to view further information about the role, please visit: http://www.jobs.cam.ac.uk/job/11996. This will take you to the role on the University’s Job Opportunities pages. There you will need to click on the ‘Apply online’ button and register an account with the University’s Web Recruitment System (if you have not already) and log in before completing the online application form.
Please upload your Curriculum Vitae (CV) and a covering letter in the Upload section of the online application to supplement your application. If you upload any additional documents which have not been requested, we will not be able to consider these as part of your application.
The closing date for all applications is the Thursday 01 December 2016.
Interviews will be held in January 2017. If you have not been invited for interview by 20th December 2016, you have not been successful on this occasion.
Please quote reference PS10618 on your application and in any correspondence about this vacancy.
The University values diversity and is committed to equality of opportunity.
The University has a responsibility to ensure that all employees are eligible to live and work in the UK.
TheSmith Groupat the Wellcome Trust – Medical Research Council Stem Cell Institute in Cambridge in partnership with the Computational Biology Group at Microsoft Researchoffers an exciting interdisciplinary4-year PhD studentship commencing October 2017.
The pluripotent ground state of embryonic stem cells (ESCs) is governed by a self-reinforcing interaction network of transcription factors (Dunn et al, Science 2014). Combinations of factors within this network can induce somatic cells to acquire pluripotency, a process called molecular reprogramming (Takahashi and Yamanaka, Cell, 2006). Experimental and computational efforts have led to circuitry mapping of the key players in maintenance of the ESC state. However, how this molecular circuitry is launched and fully connected during reprogramming remains unclear.
This project is a cross-disciplinary investigation to address systematically how cells transit to the pluripotent ESC state at the molecular network level. The multi-step, heterogeneous and asynchronous nature of the reprogramming process presents technical challenges. This project is designed to overcome these challenges by using a minimal reprogramming system and integrating quantitative single-cell gene expression profiling at defined reprogramming stages with computational network synthesis and modelling. This approach will transform a temporal series of single-cell snapshots of network status into reconfiguring network trajectories. Predictions formulated from the synthesised trajectories will be tested experimentally and the results used for iterative refinement of the model set.
Aspart of the BBSRC doctoral training programme, this 4-year PhD contains tailored training courses in the first six months of the studentship. In addition, a key element of this project is that the student will spend three months atMicrosoft Research Cambridge, under the supervision of our collaborator,Dr Sara-Jane Dunn, to develop wider training and skills.
For further details about our group and the institute, please visit: http://www.stemcells.cam.ac.uk/
Funding Notes
UK and EEA studentswho have, or are expecting to attain, at least an upper second class honours degree (or equivalent) in relevant biological subjects are invited to apply. The interdisciplinary nature of the project means thatwe welcome applications from students with mathematical and computing experience who are interested in using their skills to address biological questions.
How to Apply
Application details are available at View Website. Please ask your referees to submit references directly to the SCI Graduate Administrator: sci-phd@stemcells.cam.ac.uk, using “BBSRCiCASE student reference” in the subject header. The deadline is20th January 2017and shortlisted candidates will be interviewed in February.
Our latest monthly trawl for developmental biology (and other cool) preprints. See June’s post for background, and let us know if we missed anything
This month features quite a bit of cell biology, both in early embryos and in a dish, with work on microtubules from the labs of Andreas Prokop, Tim Mitchison and Manuel Thery. We also found investigations into zebrafish cell migration and gastrulation, lots of new C. elegans work, a new view on superenhancers, some genomed Swedes, and some cats.
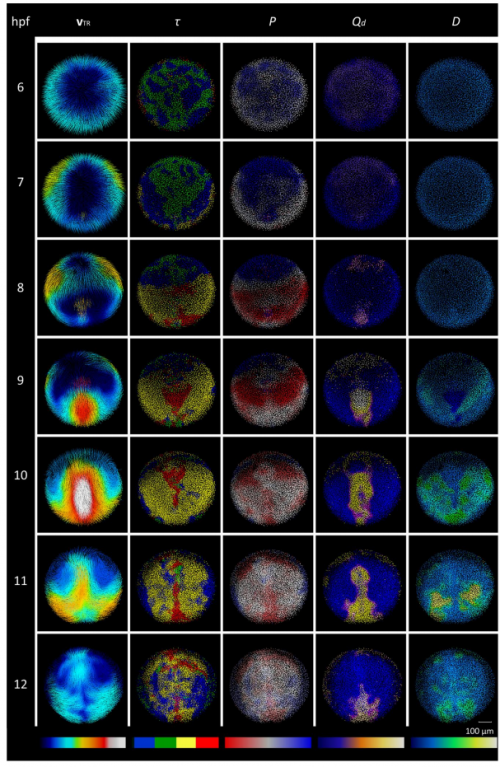
The ‘Phenomenology of gastrulation,’ from Figure 1 of Pastor-Escuredo, et al’s work on mechanical deformation in zebrafish gastrulation
As in the last months, the preprints predominantly came from bioRxiv, but we also found some in PeerJand arXiv. If we missed anything out, let us know. Happy preprinting!
Morphological plant modeling: Unleashing geometric and topologic potential within the plant sciences. Alexander Bucksch, Acheampong Atta-Boateng, Akomian Fortune Azihou, Mathilde Balduzzi, Dorjsuren Battogtokh, Aly Baumgartner, Brad Binder, Siobhan Braybrook, Cynthia Chang, Viktoriya Coneva, Thomas DeWitt, Alexander Fletcher, Malia Gehan, Diego Hernan Diaz Martinez, Lilan Hong, Anjali Iyer-Pascuzzi, Laura Klein, Samuel Leiboff, Mao Li, Jonathan Lynch, Alexis Maizel, Julin Maloof, RJ Cody Markelz, Ciera Martinez, Laura Miller, Washington Mio, Wojtek Palubicki, Hendrik Poorter, Christophe Pradal, Charles Price, Eetu Puttonen, John Reese, Ruben Rellan-Alvarez, Edgar Spalding, Erin Sparks, Chris Topp, Joseph Williams, Daniel Chitwood
SweGen: A whole-genome map of genetic variability in a cross-section of the Swedish population. Adam Ameur, Johan Dahlberg, Pall Olason, Francesco Vezzi, Robert Karlsson, Par Lundin, Huiwen Che, Jessada Thutkawkorapin, Andreas Kusalananda Kahari, Mats Dahlberg, Johan Viklund, Jonas Hagberg, Niclas Jareborg, Inger Jonasson, Asa Johansson, Sverker Lundin, Daniel Nilsson, Bjorn Nystedt, Patrik Magnusson, Ulf Gyllensten
The genome of the crustacean Parhyale hawaiensis: a model for animal development, regeneration, immunity and lignocellulose digestion. (Revision) Damian Kao, Alvina G Lai, Evangelia Stamataki, Silvana Rosic, Nikolaos Konstantinides, Erin Jarvis, Alessia Di Donfrancesco, Natalia Pouchkina-Stantcheva, Marie Semon, Marco Grillo, Heather Bruce, Suyash Kumar, Igor Siwanowicz, Andy Le, Andrew Lemire, Michael Eisen, Cassandra Extavour, William Browne, Carsten Wolff, Michalis Averof, Nipam H Patel, Peter Sarkies, Anastasios Pavlopoulos, Aziz Aboobaker
Pre-metazoan origin of animal miRNAs. (Revision) Jon Brate, Ralf Stefan Neumann, Bastian Fromm, Arthur Alexander Blorstad Haraldsen, Paul Grini, Kamran Shalchian-Tabrizi
Of cats and men: the paleogenetic history of the dispersal of cats in the ancient world. Claudio Ottoni, Wim van Neer, Bea De Cupere, Julien Daligault, Silvia Guimaraes, Joris Peters, Nikolai Spassov, Mary E. Pendergast, Nicole Boivin, Arturo Morales-Muniz, Adrian Balasescu, Cornelia Becker, Norbert Benecke, Adina Boronenant, Hijlke Buitenhuis, Jwana Chahoud, Alison Crowther, Laura Llorente, Nina Manaseryan, Herve Monchot, Vedat Onar, Marta Osypinska, Olivier Putelat, Jacqueline Studer, Ursula Wierer, Ronny Decorte, Thierry Grange, Eva-Maria Geigl
A fully funded postdoctoral position is available in the Laboratory of Regulatory Evolution (Tschopp group) at the Zoological Institute, University of Basel, Switzerland.
Topic of research
The lab’s research interests focus on how developmental processes can get modified, to give rise to morphological diversification on an evolutionary time-scale. As a model system, we are studying the development of the vertebrate skeleton with its associated neuromuscular system.
Vertebrate autopods (hands and feet) display the highest degree of morphological diversification in the appendicular skeleton, reflecting e.g. distinct modes of locomotion. While digit loss in the autopod has occurred in multiple vertebrate lineages, there seems to be a strong constraint to maintain the maximum number of digits at five, even though extra digits might prove beneficial in certain species.
The present project will investigate the potential for developmental plasticity in the limb neuromuscular system in response to changes in dactyly, i.e. altering digit numbers in vertebrate hands and feet. Specific questions we will address include: How are muscle patterning and motorneuron axonal pathfinding coping with changes in digit numbers in vertebrate hands and feet? How is motorneuron pool complexity in the spinal cord affected by additional digit targets in the periphery?
We will use a range of methods, including experimental embryology in chicken, genetic mouse models, axonal backfilling, NextGeneration-Sequencing and functional experiments using gene knock-down and overexpression.
For more information please visit http://evolution.unibas.ch/tschopp/research/
Your profile
The successful candidate will have a PhD in developmental biology and/or neurobiology, and will have skills in embryology, molecular biology and NextGeneration-Sequencing. Experience in axonal backfilling techniques will be a big plus. A basic understanding of Unix and the R language for statistical computing would be beneficial. You are interested in learning and using new technology to address long-standing questions in developmental and evolutionary biology.
We offer
– Highly interactive and interdisciplinary research environment
– Attractive employment conditions, very competitive salary by international standards, full funding available for 2 years
– The project builds on a solid foundation of confirmed preliminary data
Application / Contact
Please send your application with a brief statement of motivation, a current CV and contacts for references to patrick.tschopp@unibas.ch
Evaluation will begin on Dec. 1st 2016 and suitable candidates will be contacted shortly after. Earliest starting date is 1 January 2017.
Here are the highlights from the current issue of Development:
Signalling cross-talk in the plant root
In plants, root architecture is responsive to environmental changes. The plant hormones cytokinin, auxin and ethylene are known to regulate root growth: cytokinin signalling, acting via type-B ARR effectors, inhibits both proliferation and elongation of root cells, while auxin promotes cell division in the root apical meristem. Various mechanisms exist by which these signalling pathways interact to enable precise spatiotemporal control of root growth. On p. 3982, G. Eric Schaller and colleagues identify another level of cross-talk between these pathways in Arabidopsis. In a screen for regulators of cytokinin-mediated root growth control, they identify mutations in the gene encoding the auxin influx carrier AUX1 that enhance the cytokinin insensitivity of arr mutants. AUX1 seems to be specifically involved in cytokinin-mediated inhibition of root cell elongation but not proliferation. Since AUX1 is required for shootward transport of auxin via the lateral root cap, the authors propose that spatial modulation of this flux controls cell elongation in this region. Moreover, they identify a negative-feedback loop in the system – with ARRs inhibiting AUX1 expression, and AUX1 promoting ARR10expression – that might set up oscillating patterns of hormone flux and gene expression in the root.
Polarisation of the self-organised optic cup
The demonstration that embryonic stem cell (ESC) cultures could self-organise into optic cup-like structures provided a striking and elegant example of the degree to which tissues and organs can self-organise. But outside the embryo context, and in the absence of more global patterning cues, can they adopt appropriate axial identity and polarity? Mototsugu Eiraku and co-workers now investigate dorsoventral (DV) patterning in in vitro formed, mouse ESC-derived optic cups (p. 3895). In vivo, DV polarity is regulated by the Wnt, Shh and BMP pathways, leading to dorsal-specific expression of Tbx5and ventral expression of Vax2. The authors find that these expression domains, and the asymmetric morphogenetic events that form the optic fissure, are largely preserved in ESC-derived optic cups, although less robustly than in vivo. Ventral identity seems to be the default status, with dorsal identity being induced by localised activation of BMP signalling. As in vivo, this is controlled by Wnt signalling, which appears to be induced specifically at the retinal/non-retinal border at one side of the forming optic cup. How this local activation of Wnt is achieved in the in vitro system is unclear, but the data presented highlight the impressive degree to which tissues can self-organise, and demonstrate the utility of this in vitro system for understanding both patterning and morphogenesis.
What do matrix metalloproteinases do in the mammary gland?
During mammary gland development, mammary epithelial tissue undergoes branching morphogenesis to invade the surrounding mammary fat pad. Morphologically, the gland is relatively simple at birth, but undergoes dramatic remodelling during puberty. Based primarily on work in vitro, the matrix metalloproteases MMP14 (MT1-MMP) and MMP15 (MT2-MMP) are thought to play key roles in this branching morphogenesis, both through protease-dependent remodelling of the extracellular matrix and through protease-independent mechanisms. By analysing early (prepubertal) postnatal mammary gland development in mice (p. 3956), Stephen Weiss and colleagues now challenge this model. They find that, in contrast to in vitro data, global deletion of MMP14 or MMP15 has no significant effect on this phase of mammary gland branching, casting doubt on the degree to which proteinase-mediated extracellular matrix remodelling is required for this morphogenetic event. However, the authors also uncover unexpected and differential roles for the two MMPs in adipose development: MMP14 deletion impairs white fat differentiation, while MMP15 mutants show enhanced beige/brown fat formation. The mechanisms underlying this remain unclear, but these data suggest that current models of the roles of these MMPs in mammary gland development may need revising.
Regulating Hh signalling with Rusc
The Hedgehog (Hh) signalling pathway plays multiple fundamental roles during development, yet despite its importance our understanding of the mechanisms regulating pathway activity is still incomplete. Jing Yang and colleagues now identify the Rusc family of RUN and SH3 domain-containing proteins as negative regulators of Hh signalling. In this study (p. 3944) Rusc2 is first identified as an interactor of Sufu – a protein that binds Gli proteins (downstream effectors of the Hh pathway) and suppresses their transcriptional activity. In cell culture, Rusc1 and Rusc2 can inhibit Hh-induced Gli activation in a Sufu-dependent manner. Upon Hh stimulation, Sufu and Gli normally dissociate, allowing Gli translocation to the nucleus. Rusc appears to form a complex with Sufu/Gli in unstimulated cells, and various lines of evidence suggest a model whereby Rusc stabilises the Sufu/Gli complex, and its dissociation upon Hh stimulation is required for Gli activation. Importantly, in vivo experiments in Xenopus embryos are consistent with Rusc1/2 acting as negative regulators of Hh signalling; knockdown of Rusc1 induces phenotypes consistent with Hh pathway overactivation. Thus, this work characterises a new component of the Hh pathway and adds to our understanding of the mechanisms underpinning Hh signal transduction.
A new view of human GnRH neurons
Reproduction in mammals is dependent on specific hypothalamic neurons secreting gonadotropin-releasing hormone (GnRH). During embryonic development, GnRH neurons originate in the nose and migrate to the brain. Here, they release GnRH into the pituitary portal blood circulation for delivery to the pituitary, thus inducing the secretion of fertility-related hormones. Although this system is well studied in mice and other mammals, very little is known about human GnRH neuron development. Here (p. 3969), Paolo Giacobini and colleagues undertake a detailed analysis of the GnRH system in first-trimester human embryos by tracking the origin, migration pattern, final destination and number of GnRH neurons. By applying 3D imaging of solvent-cleared organs (3DISCO) technology to human foetuses for the first time, the authors gain unprecedented insights into the development of the GnRH system, including identifying unexpected migratory routes and brain locations of GnRH neurons. Intriguingly, the authors find a greater number of GnRH neurons than previously thought and reveal that only approximately 20% of these cells colonise the hypothalamus by the end of the first trimester, with the rest being quite widely distributed. While the long-term fate and function of these extra-hypothalamic GnRH neurons remains unclear, their presence raises the possibility of non-fertility-related roles for the GnRH system.
Building bone around blood vessels
It is well known that, in addition to providing nutrients to growing tissues, blood vessels in the developing embryo can play more active roles in directing morphogenesis, patterning and differentiation – primarily through the secretion of signalling molecules. In bone, invasion of blood vessels precedes osteogenesis, and endothelial-derived signalling factors have been shown to regulate ossification. On p. 3933 Elazar Zelzer and co-workers now identify another role for the vasculature in controlling bone morphogenesis. They find that collagen I, the main extracellular matrix component that serves as a template for mineralisation, is deposited by osteoblasts onto endothelial cells within the bone. This is possible because, unlike most blood vessels, vessels within the developing bone are devoid of basement membrane. The collagen-coated vessels then serve as a template for mineral deposition, such that ossification spatially and temporally follows vascular patterning. Notably, disrupting vascularisation of the bone also disrupts bone deposition. This work establishes a previously unrecognised mechanism by which the vasculature regulates bone morphogenesis, and also raises a number of intriguing questions as to the mechanisms underlying the regulation of endothelial basement membrane deposition and the fate of mineralised vessels.
An interview with Paola Arlotta
Paola Arlotta is a neurodevelopmental biologist based at the Harvard Department of Stem Cell and Regenerative Biology in Boston, MA, USA. Her lab studies the birth, differentiation and assembly of neuronal circuits in the cerebral cortex with the aim of developing novel therapies for degenerative and neuropsychiatric diseases. Paola has recently become an editor for Development, and we asked her about her research and career, and her recent efforts to support women in science. See the Spotlight article.
Rebuilding a broken heart: lessons from developmental and regenerative biology
In May 2016, the annual Weinstein Cardiovascular Development and Regeneration Conference was held in Durham, North Carolina, USA. The meeting assembled leading investigators, junior scientists and trainees from around the world to discuss developmental and regenerative biological approaches to understanding the etiology of congenital heart defects and the repair of diseased cardiac tissue. In their Meeting Review, Muge Kuyumcu-Martinez andMichael Bressan present several of the major themes that were discussed throughout the meeting and highlight the depth and range of research currently being performed to uncover the causes of human cardiac diseases and develop potential therapies.
Post-transcriptional modifications in development and stem cells
Cells adapt to their environment by linking external stimuli to an intricate network of transcriptional, post-transcriptional and translational processes. Among these, mechanisms that couple environmental cues to the regulation of protein translation are not well understood. Chemical modifications of RNA allow rapid cellular responses to external stimuli by modulating a wide range of fundamental biochemical properties and processes, including the stability, splicing and translation of messenger RNA. In their Review, Michaela Frye andSandra Blanco focus on the occurrence of N6-methyladenosine (m6A), 5-methylcytosine (m5C) and pseudouridine (Ψ) in RNA, and describe how these RNA modifications are implicated in regulating pluripotency, stem cell self-renewal and fate specification.
 (No Ratings Yet)


 (13 votes)


 Paola Arlotta is a neurodevelopmental biologist based at the Harvard Department of Stem Cell and Regenerative Biology in Boston, MA, USA. Her lab studies the birth, differentiation and assembly of neuronal circuits in the cerebral cortex with the aim of developing novel therapies for degenerative and neuropsychiatric diseases. Paola has recently become an editor for Development, and we asked her about her research and career, and her recent efforts to support women in science. See the
  In May 2016, the annual Weinstein Cardiovascular Development and Regeneration Conference was held in Durham, North Carolina, USA. The meeting assembled leading investigators, junior scientists and trainees from around the world to discuss developmental and regenerative biological approaches to understanding the etiology of congenital heart defects and the repair of diseased cardiac tissue. In their
  Cells adapt to their environment by linking external stimuli to an intricate network of transcriptional, post-transcriptional and translational processes. Among these, mechanisms that couple environmental cues to the regulation of protein translation are not well understood. Chemical modifications of RNA allow rapid cellular responses to external stimuli by modulating a wide range of fundamental biochemical properties and processes, including the stability, splicing and translation of messenger RNA. In their