In the latest Genetics Unzipped podcast we’re reporting back from the Manova Global Health Summit in Minneapolis last month, exploring the latest advances in health technology such as CRISPR-based gene therapies, infection-fighting bacteriophage and the possibility of curing HIV with stem cell transplants.
Plus veteran New York Times columnist Jane Brody’s advice for a healthy life, and reflections on progress in cancer from US journalist and advocate Katie Couric.
If you enjoy the show, please do rate and review and spread the word. And you can always send feedback and suggestions for future episodes and guests to podcast@geneticsunzipped.com Follow us on Twitter – @geneticsunzip
We study stem cells, development, and regeneration in the cnidarian Hydractinia. The questions we are interested in are related to how cells make decisions in these contexts. Techniques we use in the lab include random-integration and CRISPR-Cas9 mediated transgenesis/mutagenesis, flow cytometry, cell and tissue transplantation, gene expression analysis, and confocal microscopy for fixed tissues and live imaging experiments.
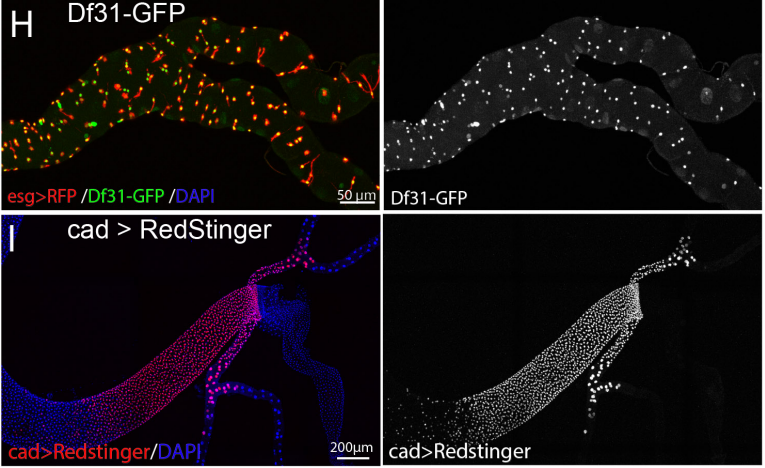
Cnidarians (sea anemones, corals, and jellies) are emerging model organisms in developmental biology and evolution. Hydractinia symbiolongicarpus, our lab animal, is one of only a few established cnidarian models. The animal grows well in the lab, reproduces sexually every day, and is highly regenerative. A high quality, PacBio based genome sequence is available together with numerous tissue-specific transcriptomes. Hydractinia is small, translucent, and sessile in most stages of its life cycle. This enables in vivo experiments that are very difficult to perform on other animals.
One postdoc will work on characterizing the transcriptomes of all Hydractinia cell lineages at single-cell resolution. The work will also include functional studies on key lineage regulators. The second postdoc will study the transcriptional changes and chromatin landscape that underlie a novel type of regeneration involving natural reprogramming of somatic cells. The positions are funded by NSF and Wellcome, respectively, and are available for three years each.
Candidates must have a PhD in developmental biology, cell biology, or related area. A strong background in molecular biology, experience in working with an animal model, or bioinformatics would be advantageous.
To apply, send a cover letter articulating your interest in one of the projects, your CV, and contact info for at least two references, ideally as a single PDF, to Prof. Uri Frank <uri.frank@nuigalway.ie>. Informal enquiries are welcome.
Stem cells are typically defined by their ability to self-renew and differentiate. These activities are tightly controlled by both intrinsic cues and extrinsic cues from the microenvironment, known as the SC niche. This niche consists of multiple components, among which blood vessels (BVs) are critical as they not only supply oxygen and nutrients to the SCs but also provide molecular signals. BVs form a perivascular-niche for many adult SCs including neural, mesenchymal and hematopoietic SCs. A molecular connection between SCs and vasculature contributes to tissue homeostasis and repair. However, it remains unclear whether this connection also exists in epithelial stem cells, and it’s also unknown whether SCs can conversely promote remodeling of their own environment for proper tissue homeostasis.
The Tumbar lab at Cornell University uses the mouse hair follicle as a model system to study SCs. Hair follicles (HFs) are characterized by a cyclic destruction and reconstruction, which consists of three morphologically distinct and synchronous phases (Figure 1) : 1) growth and proliferation which results into the formation of a new hair shaft known as anagen; 2) apoptosis driven regression, or catagen; 3) and the resting phase, or telogen. In these three phases, SCs exhibits distinct behaviors such as proliferation, migration, or quiescence.
Figure 1: Stem cell behavior during hair cycle in adult skin. Hair cycle is divided into morphologically distinct and synchronous phases: 1) growth and proliferation; 2) apoptosis driven regression; 3) and the resting phase. At the end of quiescence phase stem cells (shown as blue circles) migrate out of their niche (shown as purple crescent) and in response to the activation signals and they change their gene expression, these are called early progenitor cells (shown as red circles). Transcription factor Runx1 is highly expressed in these cells. During the growth or proliferation phase stem cells undergo self-renewal to fill the vacant space and they differentiate and proliferate to make hair shaft. Towards the end of the proliferation differentiated cells undergo apoptosis and stem cells return to quiescence.
A decade ago, when Tudorita (Doina) was a postdoc with Elaine Fuchs studied the transcriptional profile of the hair follicle stem cells (HFSCs) by purifying label-retaining cells in the lineage tracing experiment (Tumbar et al., 2004). Interestingly, many differentially expressed genes in this population encode secreted molecules, suggesting that in addition to receiving signals from the niche, HFSCs may also modulate the niche (Fuchs et al., 2004). More recently, the Tumbar lab has identified runt-related transcription factor 1 (Runx1) as a HFSC regulator. Epithelial Runx1 knockout mice have significant delay in hair growth (Hoi et al., 2010; Osorio et al., 2008). Runx1 is highly expressed in activated SCs or early progenitor cells and its expression is lost when these cells are proliferating (Figure 1). Microarray analysis further revealed gene expression changes in response to altered Runx1 level in the epithelium (Lee et al., 2014).
Our journey started when Prachi, Post-doc in the lab, got intrigued by the microarray data: the gene changes include secreted molecules whose functions are implicated in vascular remodeling, indicating a cross talk between vasculature and stem cell activation. We started to look for blood vessel remodeling in response to varying levels of Runx1 using mutants: Runx1 epithelial knockout mice (Runx1 EpiKO) and Runx1 epithelial transgenic overexpression mice (Runx1 EpiTG). Blood vessel connection in the skin has mainly been studied for oxygen and nutrition, and its molecular signaling aspect has been addressed in depth. Quick experiments of immunostaining for CD31, an endothelial marker, showed visual differences that were exciting and prompted us to begin our investigation on the connection between HFSC and the vascular niche. We were interested in testing whether the vasculature signals for HFSC activation and/or if HFSCs themselves send signals to remodel vasculature during normal hair homeostasis.
Our basic idea was to perturb one compartment, either epithelium or endothelium, and see what would happen to the other compartment. Taking lead from our earlier observation that BVs are remodeled in response to varying levels of Runx1, undergrad student Catherine focused on quantifying the direct contact between vasculature and different regions of the hair follicle. By subsequent quantification, we found that Runx1 mutants showed distinct patterns of vasculature contact. However, these patterns were at first confusing, and we were not sure how to interpret them.
We then began our analysis by quantifying the area covered by CD31 immunostained vasculature under the hair germ and above the muscle. The quantification process was not easy. First, the selection of CD31 immunostained vasculature needs to be manual, because software such as ImageJ or ilastik are not yet as smart as humans in accurately picking out the vasculature. Second, some of the images were not good quality – for example, some stainings appeared hazy, or in some slides the hypodermis was washed away. Those images could be used for contact quantification, but would not be good for area quantification. Therefore, a lot of stainings had to be repeated. Another problem we encountered the different way different researchers quantified their data. The first part of quantification was done by Flora Eun, a brilliant undergrad who soon graduated and left the lab, and the second part of the job was then picked up by graduate student Nina Li. However, Nina was able to be more precise than Flora in selecting the vasculature, so it did not make sense to combine their data as it would create large error within the dataset. To avoid this problem, Nina then quantified the entire dataset, and compared her statistical result with Flora’s preliminary result. Since both statistical results show the same trend that Runx1 EpiKO has significantly more vasculature than control mice, we felt comfortable to further pursue the study.
We then noticed that the thickness of the hypodermis was different in each mouse, but were able to confirm that this thickness did not relate to the amount of vasculature. Since we reasoned that Runx1 might modulate the vascular niche via secreted molecules, the vasculature in close vicinity to the hair germ should be the most affected population, and they should also be the most important if they can send signals back to the hair germ. We used a more stringent method to quantify vascular differences: we drew a thin stripe under the hair germ, and only quantified the vasculature in this selected region. As expected, Runx1 EpiKO had significantly higher amount of vasculature than control mice, suggesting that HFSCs may actively modulate their own vascular niche via Runx1 expression.
In the reverse signaling, from endothelium to epithelium, we did an initial screen before pursuing a particular mutant. From Dr. Anne Eichmann, we acquired two vasculature-related mutants: Cdh5-CreERT2 mediated endothelial knockout mice for Neuropilin 1 (Nrp1) and activin-receptor like kinase 1 (Alk1) genes (Nrp1 EndKO and Alk1 EndKO). Both genes are critical for endothelial cell homeostasis, and perturbation of either one can lead to serious vasculature related diseases. Since we wanted to know whether perturbation of the endothelium affects hair follicle homeostasis, the idea was to perturb BV during quiescence stage before beginning of next stages of HFSCs proliferation and differentiation. When Prachi started optimizing time points and dosage for knockouts she wasn’t sure that if Alk1 conditional knockout out would be viable and show phenotypes, as previously reported knockout pups could only survive 48 hours after birth. Another question was whether adult vasculature patterns can be remodeled by introducing genetic mutations.
We first checked the hair cycle progression on a few mutant mice after knockout induction at PD17, and sacrificed around PD35. While Nrp1 EndKO did not exhibit obvious epithelial phenotype, we were excited to find Alk1 EndKO showed a hair cycle delay phenotype. Alk1 EndKO in the quiescence stage of hair cycle seemed to modulate vascular remodeling and result in delayed progression of stem cell activation. Therefore, we decided to make further investigation on Alk1 EndKO. To confirm the hair cycle delay phenotype, we checked more mice and at various time points between PD22 to PD35. To distinguish between quiescence and early proliferation, since overall morphology does not differ much at these stages, we did both immunofluorescence staining for Ki67, a proliferation marker, and H&E staining to carefully determine the hair cycle stages for our samples. After checking more than 20 mice, we concluded that Alk1 EndKO mice have delayed proliferation marked by the lack of Ki67 staining. We also confirmed that observed delay was not due to less number of early progenitor cells in the mutant mice but rather as a result of delay in HFSC proliferation.
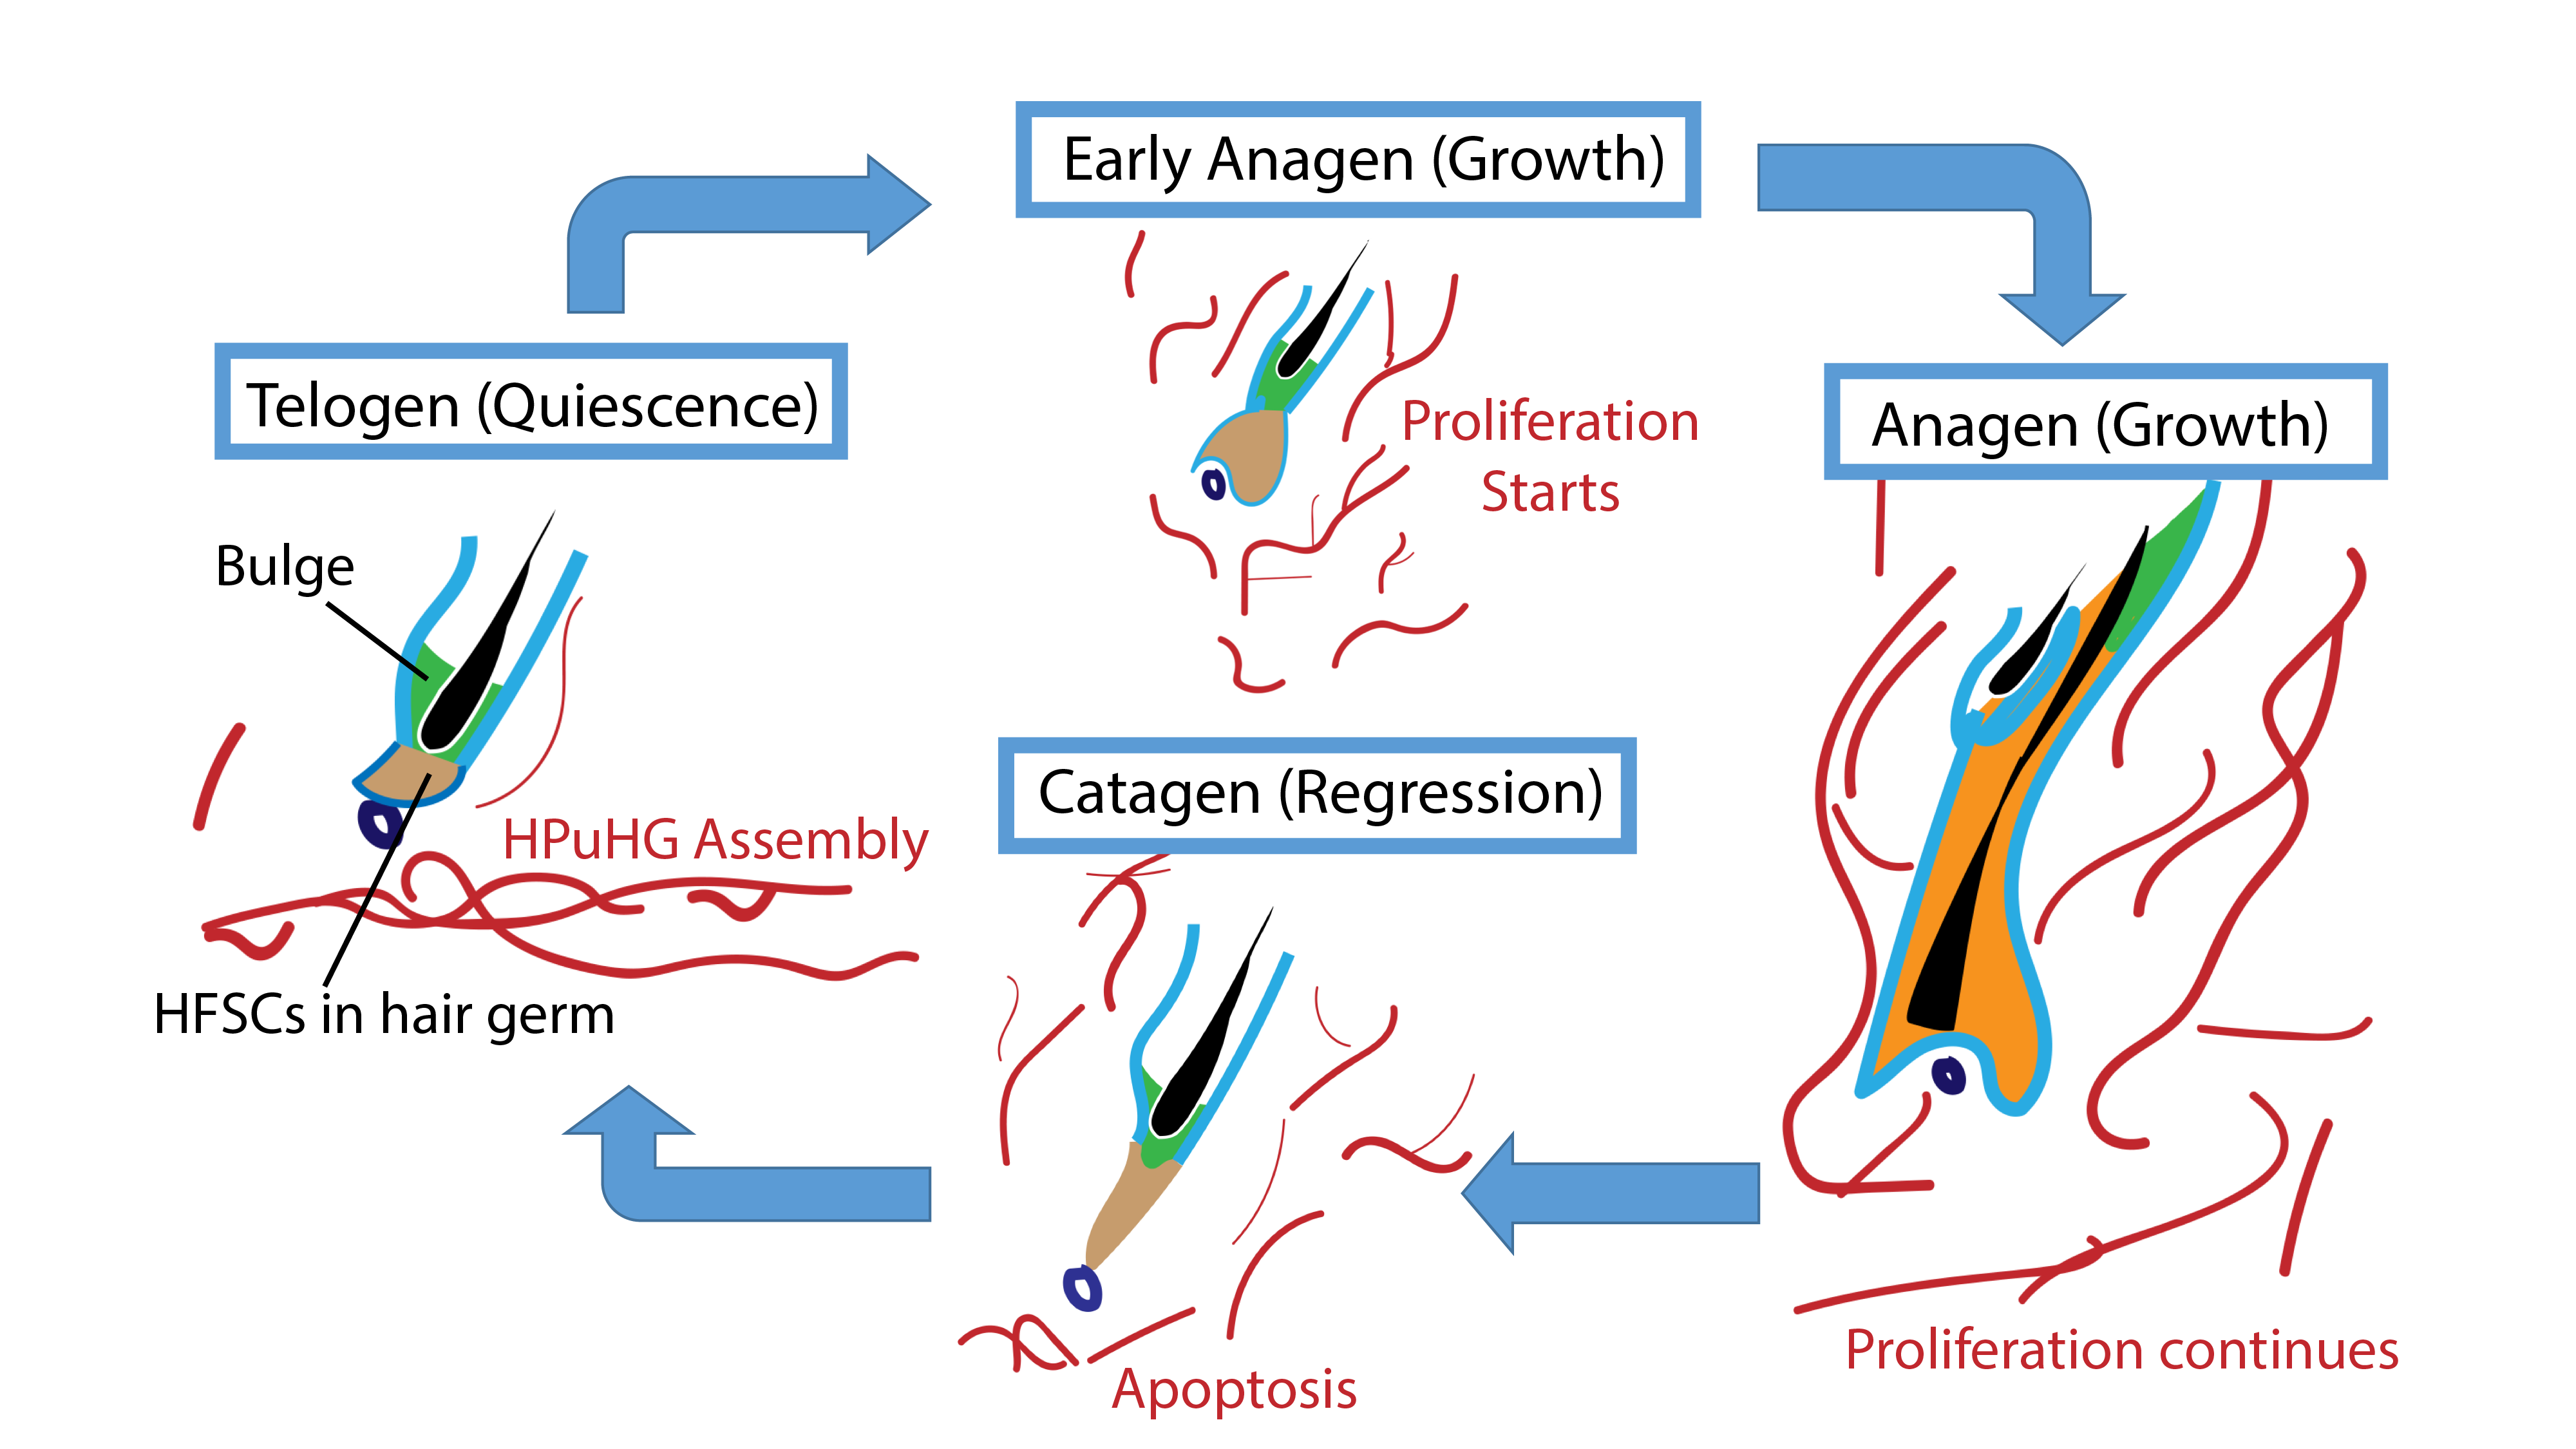
We then wondered what changes in the skin vasculature could lead to the Alk1 EndKO hair cycle delay phenotype. Again, we did immunofluorescence staining for CD31 and we found that there are more CD31+ vasculature in vicinity of the hair germ. The similarity between Alk1 EndKO and Runx1 EpiKO led us to wonder what is the importance of the vasculature near the hair germ. To answer this question, we first investigated the nature of this vasculature during hair homeostasis using wildtype mice (Figure 2).
Figure 2: Skin vasculatures during the hair cycle. The hair cycle consists of three stages. In telogen, both bulge cells and primed stem cells (hair follicle stem cells, HFSCs) in the hair germ remain quiescent. When the hair follicle receives signals to enter anagen, bulge cells proliferate and self-renew, and HFSCs in hair germ proliferate and differentiate to give rise to multiple lineages. In catagen, the regression stage, differentiated lineages generated in anagen undergo apoptosis. Eventually, the hair follicle enters telogen again. During the hair cycle, skin vasculatures (shown as red cables) also change in parallel to the hair follicles. From late catagen to telogen, a horizontal plexus under hair germ (HPuHG) assembles. In anagen, endothelial cells proliferate and disperse. In catagen, endothelial cells undergo apoptosis and deposit to form the HPuHG.
We checked the vasculature arrangement at different stages of the hair cycle. Interestingly, we found that at quiescence stage, a horizontal vascular plexus is formed under the hair germ, which we named it “Horizontal Plexus under Hair Germ (HPuHG)”. This vascular plexus quickly disperses as the hair follicle starts proliferating. Then after apoptosis, the skin vasculature deposits to form the HPuHG again. Since we looked at the quiescence stage in Runx1 EpiKO and in Alk1 EndKO, a stage when HPuHG exists, we believed that the vascular phenotype in the two mutants is in fact an increase in the HPuHG vasculature. These observations strengthened our idea that BVs have distinct role in molecular signaling in addition to nutrition and oxygen, contrary to our belief that increased vasculature causes delay in hair growth. Moreover, distinct pattern of BVs during hair growth supports the idea that BVs are important part of HFSCs niche.
To understand whether molecular signal derived from endothelial cells could cause the HFSC activation defect, we checked if a well-established HFSC quiescence factor BMP4 is also expressed in skin endothelial cells. Previous study indicated endothelial cells express BMP4 in the lung (Frank David et al., 2005). We did immunofluorescence staining for CD31 and BMP4, and found colocalization between the two signals, indicating skin endothelial cells are a source of BMP4. While the expression level of BMP4 in endothelial cells and the average BMP4 intensity in interfollicular epidermis are not altered by the mutation of Alk1 or Runx1, the average intensity of BMP4 in the selected HPuHG region is higher in mutants than in control mice. Western blots also showed elevated BMP4 level in Alk1 EndKO. Though more solid evidence such as RNA-Seq of hair follicle cells from the mutant skin is needed to conclude that endothelial BMP4 is the cause of the HFSC activation delay, our data showed a correlation between BMP4 level, amount of vasculature, and HFSC activation defect. Specifically, our data suggested that excessive HPuHG vasculature may lead to excessive BMP4 in the vicinity of the hair germ, thus delaying the HFSC activation.
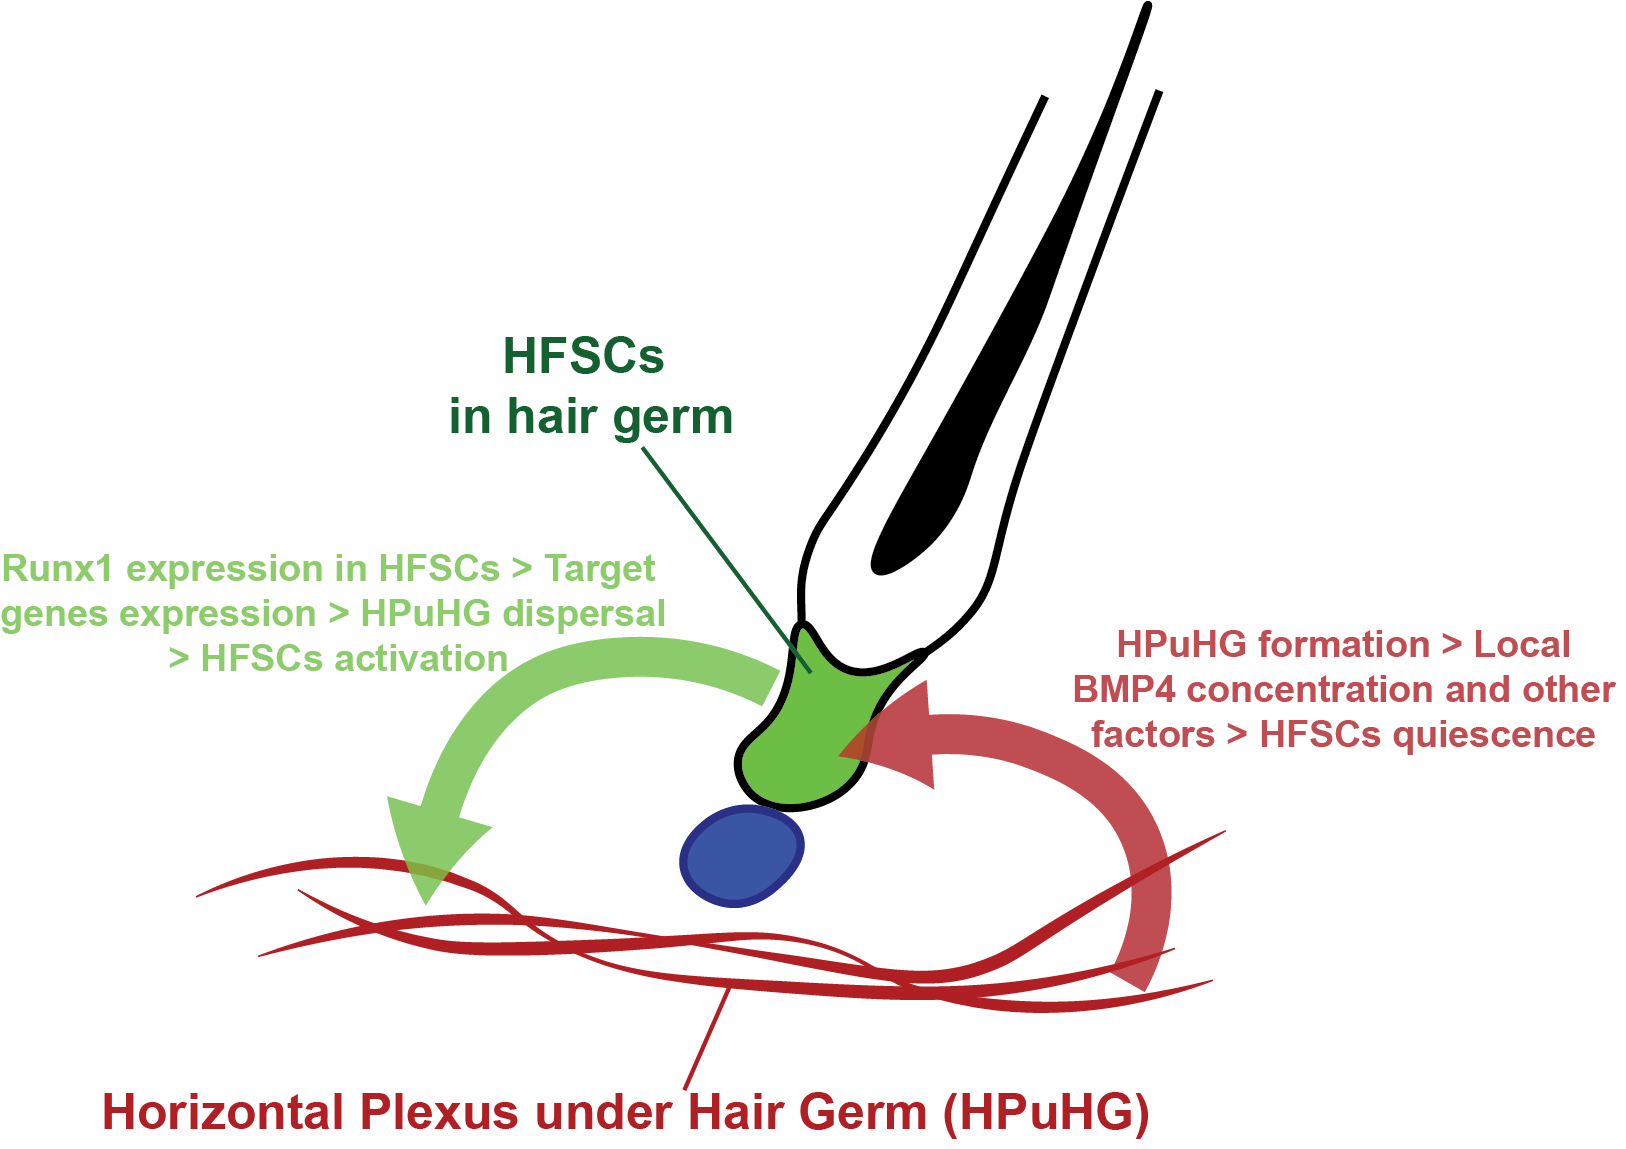
There have been previous investigations into the association between the skin vasculature and the hair follicle, but these have focused mainly on hair growth related to vasculature and failed to provide molecular evidence on how the vasculature regulates hair homeostasis (Ellis and Moretti, 1959; Mecklenburg et al., 2000). Our current research focuses on the quiescence stage that has been overlooked for many years, and how cross talk between HFSC and their environment influences their activity. Our data support a model where HFSCs are capable of sending signals to their vascular niche, and the vascular niche can reciprocally control HFSC activation (model summarized in Figure 3).
Figure 3: Hypothetical model of the cross-talk between HFSCs and their vascular niche. Our work suggested that a cross-talk exists between HFSCs and their vascular niche. In our hypothetical model, HPuHG (shown as red cables) starts to form from late catagen to telogen. Endothelial cells near the HPuHG secrete quiescence factors such as BMP4 to maintain the quiescence of HFSCs. In the reverse signaling, HFSCs in the hair germ (shown in green) use Runx1 as a master regulator to modulate their vascular niche. Specifically, many secreted molecules encoded by vasculature-related genes are downstream of Runx1. In response to Runx1 expression, HFSCs remodel the vasculature around them. Proper dispersal of the vasculature leads to the activation of HFSCs.
To our knowledge, this is the first publication suggesting a niche modulation role of HFSCs, and also a first documentation of the non-cell autonomous role of Runx1. Though more molecular details underlying the cross-talk between HFSCs and their vascular niche are to be elucidated, our research has opened a new window for future investigation. The Alk1 mutation has been studied in hereditary hemorrhagic telangiectasia, a disease marked by the fusion between arteries and veins. Our current study may further the understanding of its prevalence in skin, and may also provide new thoughts for future therapy. It also has implications for tissue regeneration and in clinical settings where targeting cancer SC niche through anti-angiogenic targets can be promising therapeutics.
Mecklenburg, L., Tobin, D.J., Müller-Röver, S., Handjiski, B., Wendt, G., Peters, E.M.J., Pohl, S., Moll, I., and Paus, R. (2000). Active Hair Growth (Anagen) is Associated with Angiogenesis. Journal of Investigative Dermatology 114, 909-916.
POST-DOC POSITION IN DEVELOPMENTAL CELL BIOLOGY AND PHYSIOLOGY (3 years in Nice, IBV, France).
Position available (starting early 2020) to functionally characterize the role of Hedgehog in the inter-cellular and inter-organ communication in Drosophila.
Hedgehog proteinsare known key signaling mediators that govern tissue patterning and homeostasis during both development and adult life. The laboratory is interested in how Hedgehog proteins traffic in the producing tissue and exert their function in the receiving tissue, both in a paracrine and hormonal manner.
We have shown that the Endosomal Sorting Complex Required forTransport (ESCRT) promotes Hedgehog proteins loading on exo-vesicles to exert their effect at long distances. We also have shown recently that circulating Hedgehog has a protective role and have identified targets of Hedgehog signaling in glial cells involved in this process. This newly identified role for Hedgehog is important to provide protection during the ageing process. The post-doctoral project aims to gain further insight into the trafficking, vesicular secretion and the extracellular spread of Hedgehog proteins, both at the intercellular and inter-organ level, using cell biology and genetic technics. Invivoimaging and single molecule tracking (in collaboration with computational science lab) has also been developped on our tissue models and will be further usedto investigatethe dynamics of Hedgehog release and spreading.
Interested candidates should have strong knowledge of, and experience in fly genetics, cell biology and optic microscopy (confocal/spinning disc). The position is funded for 3 years in duration. Candidates must have a Ph.D. degree, and can be nationals of any country.
Selectedreferences: Ayers et al., Dev.Cell2010 vol18, 605–620; Briscoe and Thérond, NatRevMolCellBiol.Vol. 14, 2013; Matusek et al., Nature2014 Dec 4;516(7529): 99-103; D’Angelo et al., Dev.Cell2015 Feb. 9 ; 32, 290-303.
Candidates should send a Curriculum Vitae and a list of three referees to:
Welcome to our monthly trawl for developmental biology (and related) preprints.
This month features a series of preprints on stem cell mechanics and tools to help you make organoids, some nectins and some nestins, plenty of auxin in our plant section, and some phantom crustaceans and macabre French genomics in our ‘Why Not’ section.
They were hosted on bioRxiv, PeerJ, andarXiv. Let us know if we missed anything, and use these links to get to the section you want:
Plexin-B2 is a key regulator of cell mechanics during multicellular organization
Chrystian Junqueira Alves, Rafael Dariolli, Theodore Hannah, Robert J. Wiener, Nicolas Daviaud, Rut Tejero, G. Luca Gusella, Nadejda M. Tsankova, Rodrigo Alves Dias, José Paulo R. Furtado de Mendonça, Evren U. Azeloglu, Roland H. Friedel, Hongyan Zou
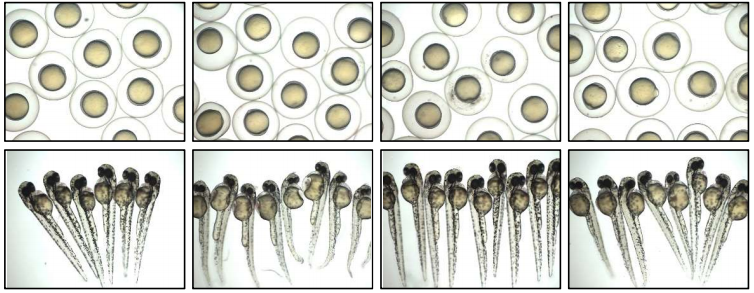
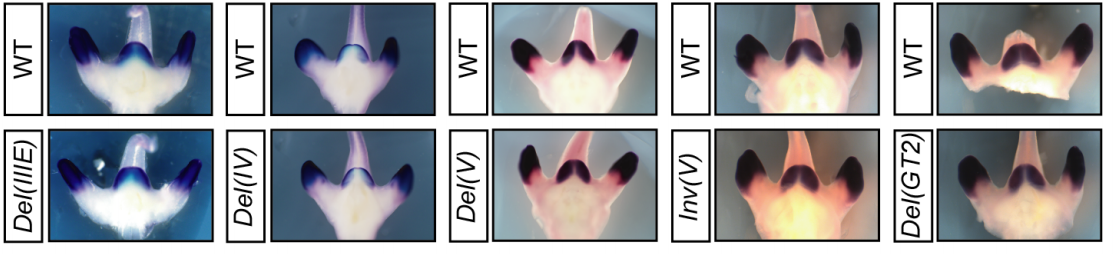
Transgene-mediated skeletal phenotypic variation in zebrafish
Charles B. Kimmel, Alexander L. Wind, Whitney Oliva, Samuel D. Ahlquist, Charline Walker, John Dowd, Bernardo Blanco-Sánchez, Tom A. Titus, Peter Batzel, John H. Postlethwait, James T. Nichols
Integrating healthcare and research genetic data empowers the discovery of 49 novel developmental disorders
Joanna Kaplanis, Kaitlin E Samocha, Laurens Wiel, Zhancheng Zhang, Kevin Arvai, Ruth Eberhardt, Giuseppe Gallone, Stefan H Lelieveld, Hilary Martin, Jeremy McRae, Patrick Short, Rebecca Torene, Elke de Boer, Petr Danecek, Eugene James Gardner, Ni Huang, Jenny Lord, Inigo Martincorena, Rolph Pfundt, Margot Reijnders, Alison Yeung, Helger Yntema, DDD study, Lisenka Vissers, Jane Juusola, Caroline Wright, Han Brunner, Helen V Firth, David R Fitzpatrick, Jeffrey C Barrett, Matthew E Hurles, Christian Gilissen, Kyle Retterer
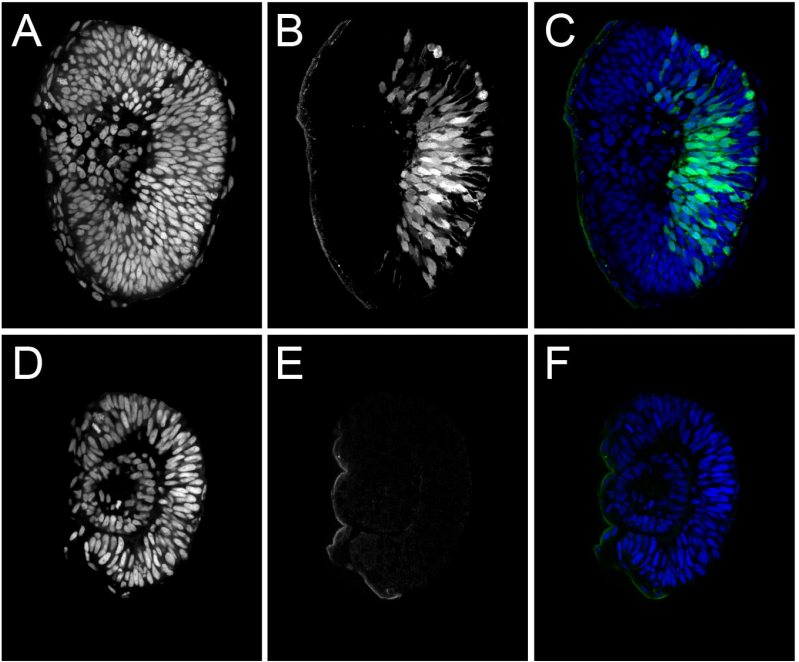
Single-cell analysis of human retina identifies evolutionarily conserved and species-specific mechanisms controlling development
Yufeng Lu, Fion Shiau, Wenyang Yi, Suying Lu, Qian Wu, Joel D. Pearson, Alyssa Kallman, Suijuan Zhong, Thanh Hoang, Zhentao Zuo, Fangqi Zhao, Mei Zhang, Nicole Tsai, Yan Zhuo, Sheng He, Jun Zhang, Genevieve L. Stein-O’Brien, Thomas D. Sherman, Xin Duan, Elana J. Fertig, Loyal A. Goff, Donald J. Zack, James T. Handa, Tian Xue, Rod Bremner, Seth Blackshaw, Xiaoqun Wang, Brian S. Clark
Predicting cellular position in the Drosophila embryo from Single-Cell Transcriptomics data
Jovan Tanevski, Thin Nguyen, Buu Truong, Nikos Karaiskos, Mehmet Eren Ahsen, Xinyu Zhang, Chang Shu, Ke Xu, Xiaoyu Liang, Ying Hu, Hoang V.V. Pham, Li Xiaomei, Thuc D. Le, Adi L. Tarca, Gaurav Bhatti, Roberto Romero, Nestoras Karathanasis, Phillipe Loher, Yang Chen, Zhengqing Ouyang, Disheng Mao, Yuping Zhang, Maryam Zand, Jianhua Ruan, Christoph Hafemeister, Peng Qiu, Duc Tran, Tin Nguyen, Attila Gabor, Thomas Yu, Enrico Glaab, Roland Krause, Peter Banda, DREAM SCTC Consortium, Gustavo Stolovitzky, Nikolaus Rajewsky, Julio Saez-Rodriguez, Pablo Meyer
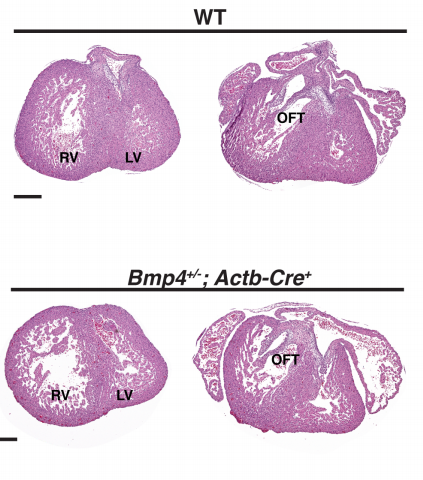
Single-Cell RNA-Seq Reveals Endocardial Defect in Hypoplastic Left Heart Syndrome
Yifei Miao, Lei Tian, Marcy Martin, Sharon L. Paige, Francisco X. Galdos, Jibiao Li, Alyssa Guttman, Yuning Wei, Jan-Renier Moonen, Hao Zhang, Ning Ma, Bing Zhang, Paul Grossfeld, Seema Mital, David Chitayat, Joseph C. Wu, Marlene Rabinovitch, Timothy J. Nelson, Shuyi Nie, Sean M. Wu, Mingxia Gu
Parkinson’s disease phenotypes in patient specific brain organoids are improved by HP-β-CD treatment
Kyriaki Barmpa, Isabel Rosety, Lisa M. Smits, Jonathan Arias-Fuenzalida, Jonas Walter, Gemma Gomez-Giro, Anna S Monzel, Xiaobing Qing, Gerald Cruciani, Ibrahim Boussaad, Christian Jaeger, Aleksandar Rakovic, Emanuel Berger, Paul Antony, Christine Klein, Rejko Krüger, Philip Seibler, Javier Jarazo, Jens C. Schwamborn, Silvia Bolognin
Atypical neurogenesis in induced pluripotent stem cell (iPSC) from autistic individuals
Dwaipayan Adhya, Vivek Swarup, Roland Nagy, Lucia Dutan Polit, Carole Shum, Kamila Jozwik, Paulina Nowosiad, Irene Lee, David Skuse, Eva Loth, Deirdre Howley, Frances A Flinter, Grainne McAlonan, Maria Andreina Mendez, Jamie Horder, Declan Murphy, Daniel H. Geschwind, Jack Price, Jason Carroll, Deepak P. Srivastava, Simon Baron-Cohen
Plants with self-sustained luminescence
Tatiana Mitiouchkina, Alexander S. Mishin, Louisa Gonzalez Somermeyer, Nadezhda M. Markina, Tatiana V. Chepurnyh, Elena B. Guglya, Tatiana A. Karataeva, Kseniia A. Palkina, Ekaterina S. Shakhova, Liliia I. Fakhranurova, Sofia V. Chekova, Aleksandra S. Tsarkova, Yaroslav V. Golubev, Vadim V. Negrebetsky, Sergey A. Dolgushin, Pavel V. Shalaev, Olesya A. Melnik, Victoria O. Shipunova, Sergey M. Deyev, Andrey I. Bubyrev, Alexander S. Pushin, Vladimir V. Choob, Sergey V. Dolgov, Fyodor A. Kondrashov, Ilia V. Yampolsky, Karen S. Sarkisyan
A proximity biotinylation map of a human cell
Christopher D. Go, James D.R. Knight, Archita Rajasekharan, Bhavisha Rathod, Geoffrey G. Hesketh, Kento T. Abe, Ji-Young Youn, Payman Samavarchi-Tehrani, Hui Zhang, Lucie Y. Zhu, Evelyn Popiel, Jean-Philippe Lambert, Étienne Coyaud, Sally W.T. Cheung, Dushyandi Rajendran, Cassandra J. Wong, Hana Antonicka, Laurence Pelletier, Brian Raught, Alexander F. Palazzo, Eric A. Shoubridge, Anne-Claude Gingras
CRISPR-Cas12a-assisted PCR tagging of mammalian genes
Julia Fueller, Konrad Herbst, Matthias Meurer, Krisztina Gubicza, Bahtiyar Kurtulmus, Julia D. Knopf, Daniel Kirrmaier, Benjamin C. Buchmuller, Gislene Pereira, Marius K. Lemberg, Michael Knop
3D super-resolution deep-tissue imaging in living mice
Mary Grace M. Velasco, Mengyang Zhang, Jacopo Antonello, Peng Yuan, Edward S. Allgeyer, Dennis May, Ons M’Saad, Phylicia Kidd, Andrew E. S. Barentine, Valentina Greco, Jaime Grutzendler, Martin J. Booth, Joerg Bewersdorf
Insights from a survey-based analysis of the academic job market
Jason D. Fernandes, Sarvenaz Sarabipour, Christopher T. Smith, Natalie M. Niemi, Nafisa M. Jadavji, Ariangela J. Kozik, Alex S. Holehouse, Vikas Pejaver, Orsolya Symmons, Alexandre W. Bisson Filho, Amanda Haage
Community Standards for Open Cell Migration Data
Alejandra N. Gonzalez-Beltran, Paola Masuzzo, Christophe Ampe, Gert-Jan Bakker, Sébastien Besson, Robert H. Eibl, Peter Friedl, Matthias Gunzer, Mark Kittisopikul, Sylvia E. Le Dévédec, Simone Leo, Josh Moore, Yael Paran, Jaime Prilusky, Philippe Rocca-Serra, Philippe Roudot, Marc Schuster, Gwendolien Sergeant, Staffan Strömblad, Jason R. Swedlow, Merijn van Erp, Marleen Van Troys, Assaf Zaritsky, Susanna-Assunta Sansone, Lennart Martens
Wikidata as a FAIR knowledge graph for the life sciences
Andra Waagmeester, Gregory Stupp, Sebastian Burgstaller-Muehlbacher, Benjamin M. Good, Malachi Griffith, Obi Griffith, Kristina Hanspers, Henning Hermjakob, Kevin Hybiske, Sarah M. Keating, Magnus Manske, Michael Mayers, Elvira Mitraka, Alexander R. Pico, Timothy Putman, Anders Riutta, Núria Queralt-Rosinach, Lynn M. Schriml, Denise Slenter, Ginger Tsueng, Roger Tu, Egon Willighagen, Chunlei Wu, Andrew I. Su
Guidelines for reporting single-cell RNA-Seq experiments
Anja Füllgrabe, Nancy George, Matthew Green, Parisa Nejad, Bruce Aronow, Laura Clarke, Silvie Korena Fexova, Clay Fischer, Mallory Ann Freeberg, Laura Huerta, Norman Morrison, Richard H. Scheuermann, Deanne Taylor, Nicole Vasilevsky, Nils Gehlenborg, John Marioni, Sarah Teichmann, Alvis Brazma, Irene Papatheodorou
A team of neuroscientists led by Professor Christiana Ruhrberg (UCL, UK) and Professor Anna Cariboni (University of Milan, Italy) have found two molecules that work together to help set up the sense of smell and pave the way to puberty in mice. These findings, reported in the journal Development, may help our understanding of why patients with the inherited condition Kallmann syndrome cannot smell properly and cannot start puberty without hormone treatment.
Aficionados of 1990s jazz and fans of David Lynch’s Twin Peaks might remember the distinctive contralto vocals of “Little” Jimmy Scott. Jimmy’s naturally high singing voice was caused by a rare genetic disease, known as Kallmann syndrome, which affects about 1 in 30,000 males and 1 in 120,000 females.
Kallmann syndrome is caused by the lack of a hormone that stimulates the brain to produce signals needed to reach sexual maturity. As a result, people with the condition don’t go through puberty and instead retain a child-like stature, no sex drive and underdeveloped genitals. Currently, the most common treatment is hormone-replacement therapy to bypass the brain and kick-start puberty. Unlike similar reproductive conditions, Kallmann syndrome patients also have no sense of smell – a tell-tale sign of this particular disorder.
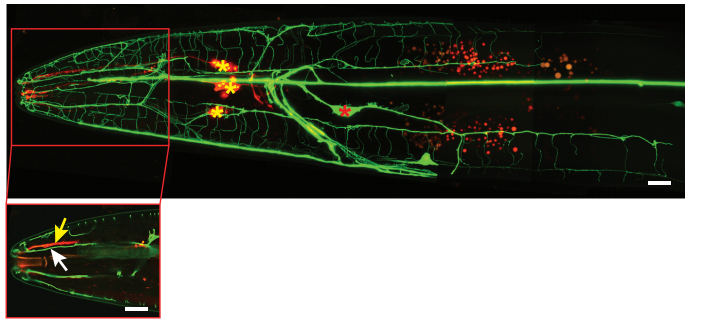
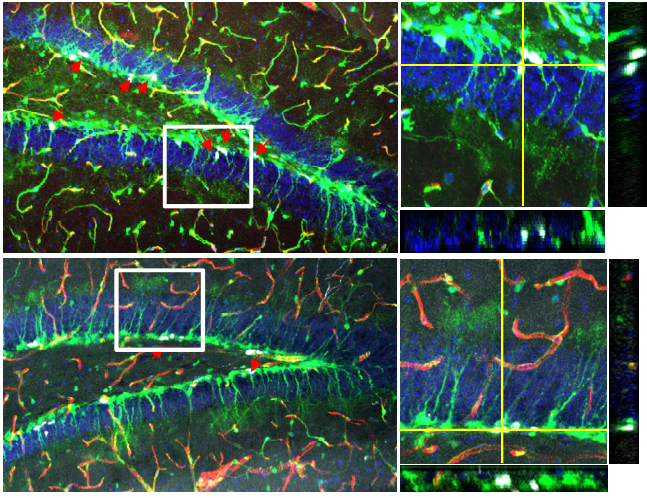
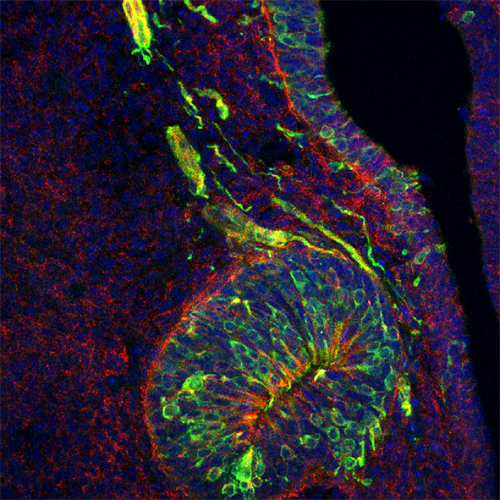
Now, research has identified two molecules, called PLXNA1 and PLXNA3, that might be linked to the condition. Scientists have found that both molecules are present in nerves that extend from the nose into the brain of developing mice. These nerves transmit signals essential for the sense of smell and also guide hormone-secreting nerve cells from their place of origin in the nose to their destination in the brain, where they regulate the onset of puberty. The study has revealed that both types of nerve are not wired properly when PLXNA1 and PLXNA3 are absent in developing mice. Consequently, the brain regions that process smells are poorly formed and the brain also lacks the puberty-promoting nerve cells – the same symptoms shown by Kallmann syndrome patients.
“By studying the mouse as a model organism, we have identified a pair of genes that can cause an inherited condition with symptoms similar to human Kallmann syndrome. This is an important finding, because the nerves that convey our sense of smell and that guide the puberty-inducing nerve cells arise in a very similar way during the development of mice and humans whilst they are still in the womb,” explained Professor Christiana Ruhrberg, who led the UK team.
This research gives hope to patients with an unknown cause of Kallmann syndrome by testing for defects in the PLXNA3 gene together with PLXNA1, which has been previously implicated. The lead author from the University of Milan, Professor Anna Cariboni added, “Although Kallmann syndrome can be treated with hormone injections if diagnosed early, knowing the underlying genetic causes can make a huge difference to speed up diagnosis and give treatment to the right patients at an earlier time.”
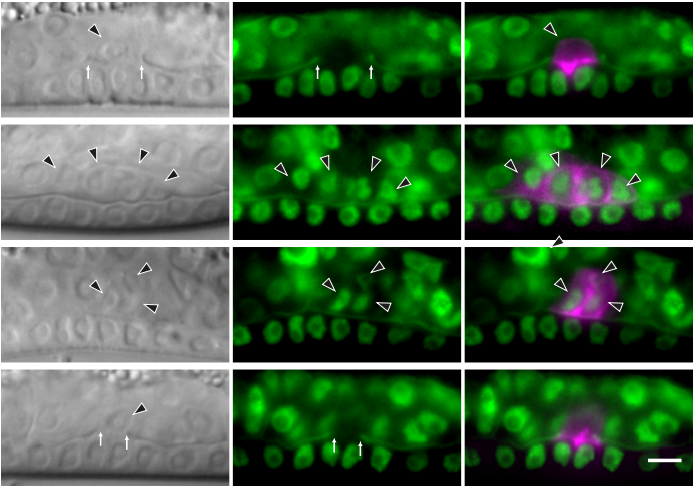
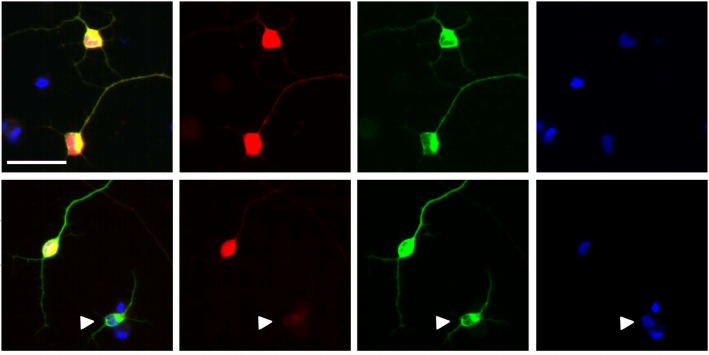
The image contains a circular structure within the developing nose that gives rise to puberty-inducing nerve cells, shown in green. Some of these nerve cells leave their birth place to travel in small clumps along nerve cables. These cells and the cables also have the PLXNA3 molecule, which is coloured red, but appears yellow, because of the red and green overlap. All cells are also highlighted in blue. CREDIT: Roberto Oleari, University of Milan.
Pre-trained Models for Developmental Biology Authors: Bradly Alicea, Richard Gordon, Abraham Kohrmann, Jesse Parent, Vinay Varma
Our virtual discussion group (DevoWormML) has been exploring a number of topics related to the use of pre-trained models in machine learning (specifically deep learning). Pre-trained models such as GPT-2 [1], pix2pix [2], and OpenPose [3] are used for analyzing many specialized types of data (linguistics, image to image translation, and human body features, respectively) and have a number of potential uses for the analysis of biological data in particular. It may be challenging to find large, rich, and specific datasets for training a more general model. This is often the case in the fields of Bioinformatics or Medical Image analysis. Data acquisition in such fields is often restricted due to the following factors:
* privacy restrictions inhibit public access to personal information, and may impose limits on data use.
* a lack of labels and effective metadata for describing cases, variables, and context.
* missing data points, which require a strategy to normalize and can make the input data useless.
We can use these pre-trained models to extract a general description of classes and features without requiring a prohibitive amount of training data. We estimate that the amount of required training data may be reduced by an order of magnitude. To get this advantage, pre-trained models must be suitable to the type of input data. There are a number of models specialized for language processing and general use, but options are fewer within the unique feature space of developmental biology, in particular. In this post, we will propose that developmental biology requires a specialized pre-trained model.
This vision for a developmental biology-specific pre-trained model would be specialized for image data. Whereas molecular data might be better served with existing models specialized for linguistic- and physics-based models, we seek to address several features of developmental biology that might be underfit using current models:
* cell division and differentiation events.
* features demonstrating the relationship between growth and motion.
* mapping between spatial and temporal context.
Successful application of pre-trained models is contingent to our research problem. Most existing pre-trained models operate on two-dimensional data, while data types such as medical images are three-dimensional. A study by Raghu et.al [4] suggests techniques specified by pre-trained models (such as transfer learning by the ImageNet model) applied to a data set of medical images provides little benefit to performance. In this case, performance can be improved using data augmentation techniques. Data Augmentation, such as adding versions of the images that have undergone transformations such as magnification, translation, rotation, or shearing, can be used to add variability of our data and improve the generalizability of a given model.
One aspect of pre-trained models we would like to keep in mind is that models are not perfect representations of the phenomenology we want to study. Models can be useful, but are often not completely accurate. A model of the embryo, for example, might be based on the mean behavior of the phenomenology. Transitional states [5], far-from-equilibrium behaviors [6], and rare events are not well-suited to such a model. By contrast, a generative model that considers many of these features might generally underfit the mean behavior. We will revisit this distinction in the context of “blobs” and “symbols”, but for now, it appears that models are expected to be both imperfect and incomplete.
The inherent imperfection of models is both good and bad news for our pursuit. On the one hand, specialized models cannot be too specific, lest they overfit some aspects of development but not others. Conversely, highly generalized models assume that there are universal features that transcend all types of systems, from physical to social, and from artificial to natural. One example of this is found in complex network models, widely used to represent everything from proteomes to brains to societies. In their general form, complex network models are not customized for specific problems, relying instead on the node and edge formalism to represent interactions between discrete units. But this also requires that the biological system be represented in a specific way to enforce the general rules of the model. For example, a neural network’s focus on connectivity requires representations of a nervous system to be simplified down to nodes and arcs. As opposed to universality, particularism is an approach that favors the particular features of a given system, and does not require an ill-suited representation of the data. Going back to the complex networks example, there are specialized models such as multi-level networks and hybrid models (dynamical systems and complex networks) that solves the problem of universal assumptions.
Another aspect of pre-trained models is in balancing the amount of training data needed to produce an improvement in performance. How much training data can we save by applying a pre-trained model to our data set? We can reformulate this question more specifically to match our specific phenomenon and research interests. To put this in concrete terms, let us consider a hypothetical set of biological images. These images can represent discrete points in developmental time, or a range of biological diversity. Now let us suppose a developmental phenotype for which we want to extract multiple features. What features might be of interest, and are those features immediately obvious?
In the DevoWorm group (where we mostly deal with embryogenetic data), we have approached this in two ways. The first is to model the embryo as a mass of cells, so that the major features of interest are the shape, size, and position of cells in an expanding and shifting whole. Last summer, we worked on applying deep learning to
While these models were effective for discovering discrete structural units (cells, filaments), they were not as effective at directly modeling movement, currents, or transformational processes. The second way we have approached this is to model the process of cell division and differentiation as a spatial and discrete temporal process. This includes the application of representational models such as game theory [7] and cellular automata [8]. This allows us to identify more subtle features that are not directly observable in the phenotype, but are less useful for predicting specific events or defining a distinct feature space.
Our model must be capable of modeling multiple structural features concurrently, but also sensitive to scenarios where single sets of attributes might yield more information. Ideally, we desire a training dataset that perfectly balances “biologically-typical” motion and transformations with clearly masked shapes representing cells and other phenotypic structures. Generally speaking, the greater degree of natural variation in the training dataset, the more robust the pre-trained model will turn out to be. More robust models will generally be easier to use during the testing phase, and result in a reduction in the need for subsequent training.
Finally, specialized pre-trained models bring up the issue of how to balance rival strategies for analyzing complex processes and data features. Conventional artificial intelligence techniques have relied on a representation which relies on the manipulation of symbols or a symbolic layer that results from the transformation of raw data to a mental framework. By contrast, modern machine learning methods rely on data to build a series of relationships that inform a classificatory system. While a combination of these two strategies might seem obvious, it is by no means a simple matter of implementation [9]. The notion of “blobs” (data) versus “symbols” (representations) draws on the current debate related to data-intensive representations versus formal (innate) representations [10-12], which demonstrates the timeliness of our efforts. Balancing these competing strategies in a pre-trained model allows us to more easily bring expert knowledge or complementary data (e.g. gene expression data in an analysis of embryonic phenotypes) to bear.
We will be exploring the details of pre-trained models in future discussions and meetings of the DevoWormML group. Please feel free to join us on Wednesdays at 1pm UTC at https://tiny.cc/DevoWorm or find us on Github (https://github.com/devoworm/DW-ML) if you are interested in discussing this further. You can also view our previous discussions on the DevoWorm YouTube channel, DevoWormML playlist (https://bit.ly/2Ni7Fs2).
[2] Isola, P., Zhu, J-Y., Zhou, T., Efros, A.A. (2017). Image-to-Image Translation with Conditional Adversarial Nets. Proceedings of Conference on Computer Vision and Pattern Recognition (CVPR).
[3] Cao, Z., Hidalgo, G., Simon, T., Wei, S-E., and Sheikh, Y. (2018). OpenPose: Realtime Multi-Person 2D Pose Estimation using Part Affinity Fields. arXiv, 1812.08008.
[4] Raghu, M., Zhang, C., Kleinberg, J.M., and Bengio, S. (2019). Transfusion: Understanding Transfer Learning for Medical Imaging. arXiv, 1902.07208.
[5] Antolovic, V., Lenn, T., Miermont, A., Chubb, J.R. (2019). Transition state dynamics during a stochastic fate choice. Development, 146, dev173740. doi:10.1242/dev.173740.
[6] Goldenfeld, N. and Woese, C. (2011). Life is Physics: Evolution as a Collective Phenomenon Far From Equilibrium. Annual Review of Condensed Matter Physics, 2, 375-399. doi:10.1146/annurev-conmatphys-062910-140509.
[7] Stone, R., Portegys, T., Mikhailovsky, G., and Alicea, B. (2018). Origins of the Embryo: Self-organization through cybernetic regulation. Biosystems, 173, 73-82. doi:10.1016/j.biosystems.2018.08.005.
[8] Portegys, T., Pascualy, G., Gordon, R., McGrew, S., and Alicea, B. (2016). Morphozoic: cellular automata with nested neighborhoods as a metamorphic representation of morphogenesis. In “Multi-Agent Based Simulations Applied to Biological and Environmental Systems“. Chapter 3 in “Multi-Agent-Based Simulations Applied to Biological and Environmental Systems”, IGI Global.
[9] Garnelo, M. and Shanahan, M. (2019). Reconciling deep learning with symbolic artificial intelligence: representing objects and relations. Current Opinion in Behavioral Sciences, 29, 17–23.
[10] Zador, A.M. (2019). A critique of pure learning and what artificial neural networks can learn from animal brains. Nature Communications, 10, 3770.
The Department of Biological Sciences at Auburn University invites applications for a tenure-track faculty position beginning Fall 2020 at the rank of Assistant Professor in Developmental Biology with an emphasis in either Plant or Vertebrate/Terrestrial Systems.
We seek highly collaborative candidates who will examine fundamental mechanisms governing developmental processes. A successful candidate is expected to establish an extramurally funded, internationally recognized research program focused on developmental biology. Instructional responsibilities include development of graduate and/or undergraduate courses in developmental biology related to their area of emphasis. Faculty will join recent hires in Evolutionary-Developmental Biology of Marine Invertebrate Systems and an emerging group of Developmental Biologists in the department.
Applicants must have a Ph.D. in Biological Sciences or a closely related discipline at the time employment begins, and relevant postdoctoral experience. The successful candidate must possess excellent written and interpersonal communication skills. Desired qualifications include a strong record of publication, teaching experience, and demonstrated (or potential) ability to acquire extramural funding.
The MRC Weatherall Institute of Molecular Medicine (WIMM) has fully funded 4-year Prize PhD (DPhil) Studentships available to start in October 2020. These Studentships are open to outstanding students of any nationality who wish to train in experimental and/or computational biology.
The Institute is a world leading molecular and cell biology centre that focuses on research with application to human disease including bioinformatics analysis. It houses over 500 research and support staff in more than 50 research groups working on a range of fields in Haematology, Gene Regulation & Epigenetics, Stem Cell Biology, Computational Biology, Cancer Biology, Human Genetics, Infection & Immunity. The Institute is committed to training the next generation of scientists in these fields through its Prize PhD Studentship Programme.
The fully funded studentships include a stipend of £18,000 per annum and cover University and College fees.
Further information on the studentships, how to apply, and the projects available can be found at:
The dependence of a protein’s function on its structure is a well-known phenomenon. Back in 1970’s, it was suggested that most proteins would fold into one energetically stable or favorable conformational state in the cell determined by their primary amino acid sequence. This led to the notion of “one sequence to one structure to one function”. Later, the identification of prions which have more than one stable structure or conformation in the same cell suggested there are exceptions to this rule. However, in the early days of this discovery, one of these conformations was nonfunctional and disease causing; therefore, the dogma still held true. Later, the discovery of functional non-toxic counterparts of prions, called prion-like proteins, challenged the dogma. These proteins not only existed in different conformations but also had different functions associated with different conformations, expanding the functional space proteins can occupy.
Today, prion-like proteins are shown to have roles in different physiological processes including adaptation to changing environmental conditions, immune response and memory formation. In all of these processes, they act as transcriptional or translational regulators, or signaling components at the molecular level, leading to a global change in cellular response. Most of these prion-like proteins are well-studied yeast prions and are often determinants of heritable phenotypes. When we look at higher order organisms, the examples of such proteins are restricted. Recent computer-based screens show these proteins are prevalent throughout all kingdoms of life; yet it is still unknown what functions they serve in different conformational states in normal physiology of higher order organisms.
Walking on Drosophila Proteome
Kausik Si’s research lab (https://research.stowers.org/silab/) at Stowers Institute for Medical Research in Kansas City is home to the very first prion-like protein found in Drosophila, called Orb2, which is important for the persistence of memory. The discovery of Orb2 and the commonality of prion-like proteins in yeast led to the idea that prion-like proteins could work in many other physiological processes. The Si lab conducted a small-scale computational screen on the Drosophila proteome to find out novel prion-like proteins. Focusing on the top scoring proteins, his team performed an experimental screen using exogenously expressed versions of the selected candidate proteins with various conventional techniques used to characterize prion-like properties (see the publication for technical details). This eventually led to a small set of 5 proteins that could be used to explore the effects of their conformation on their functions in vivo. Some of these proteins have well-known functions, and the only thing needed was to relate the conformations to these functions. The most challenging part was analyzing the proteins which did not have any functional information but only a protein sequence. Herzog, once called CG5830, was one such protein. It was at this point as a naïve but venturesome graduate student, I came into the picture!
Things got a little bit spicier
What one does when faced with a newly discovered completely unknown protein: a homology search to find out what similar proteins do in other organisms. Herzog’s homolog in mammals is a phosphatase, called SCP1, which regulates RNA polymerase II activity. When I took over the Herzog project, I first did several experiments to understand whether Herzog is really a homolog of SCP1. However, I found that even though Herzog has in vitro phosphatase activity, it doesn’t have functional similarity to SCP1 in the cell. So, I was back to where I started.
A protein has different roles at each level of biological organization, from molecules to organism, and the particular functions it performs at one level add up and lead the way to the next level, eventually telling us how that protein contributes to the life of the organism. Now, to understand Herzog completely, I needed to systematically characterize its functions at the molecular, cellular, and organismal levels. I had a lot of questions: Is it a phosphatase in the cell? If so, what are the substrates? Where does it localize? What does it partner with to do its job? What does it control? How important it is for the fly? Finally and most importantly what is the connection between its conformation and function? To answer all these questions, I needed a flexible medium of work. Luckily enough, I was working with Drosophila melanogaster, which has various tools and resources making it easy to manipulate at all these different levels.
Herzog all the way down
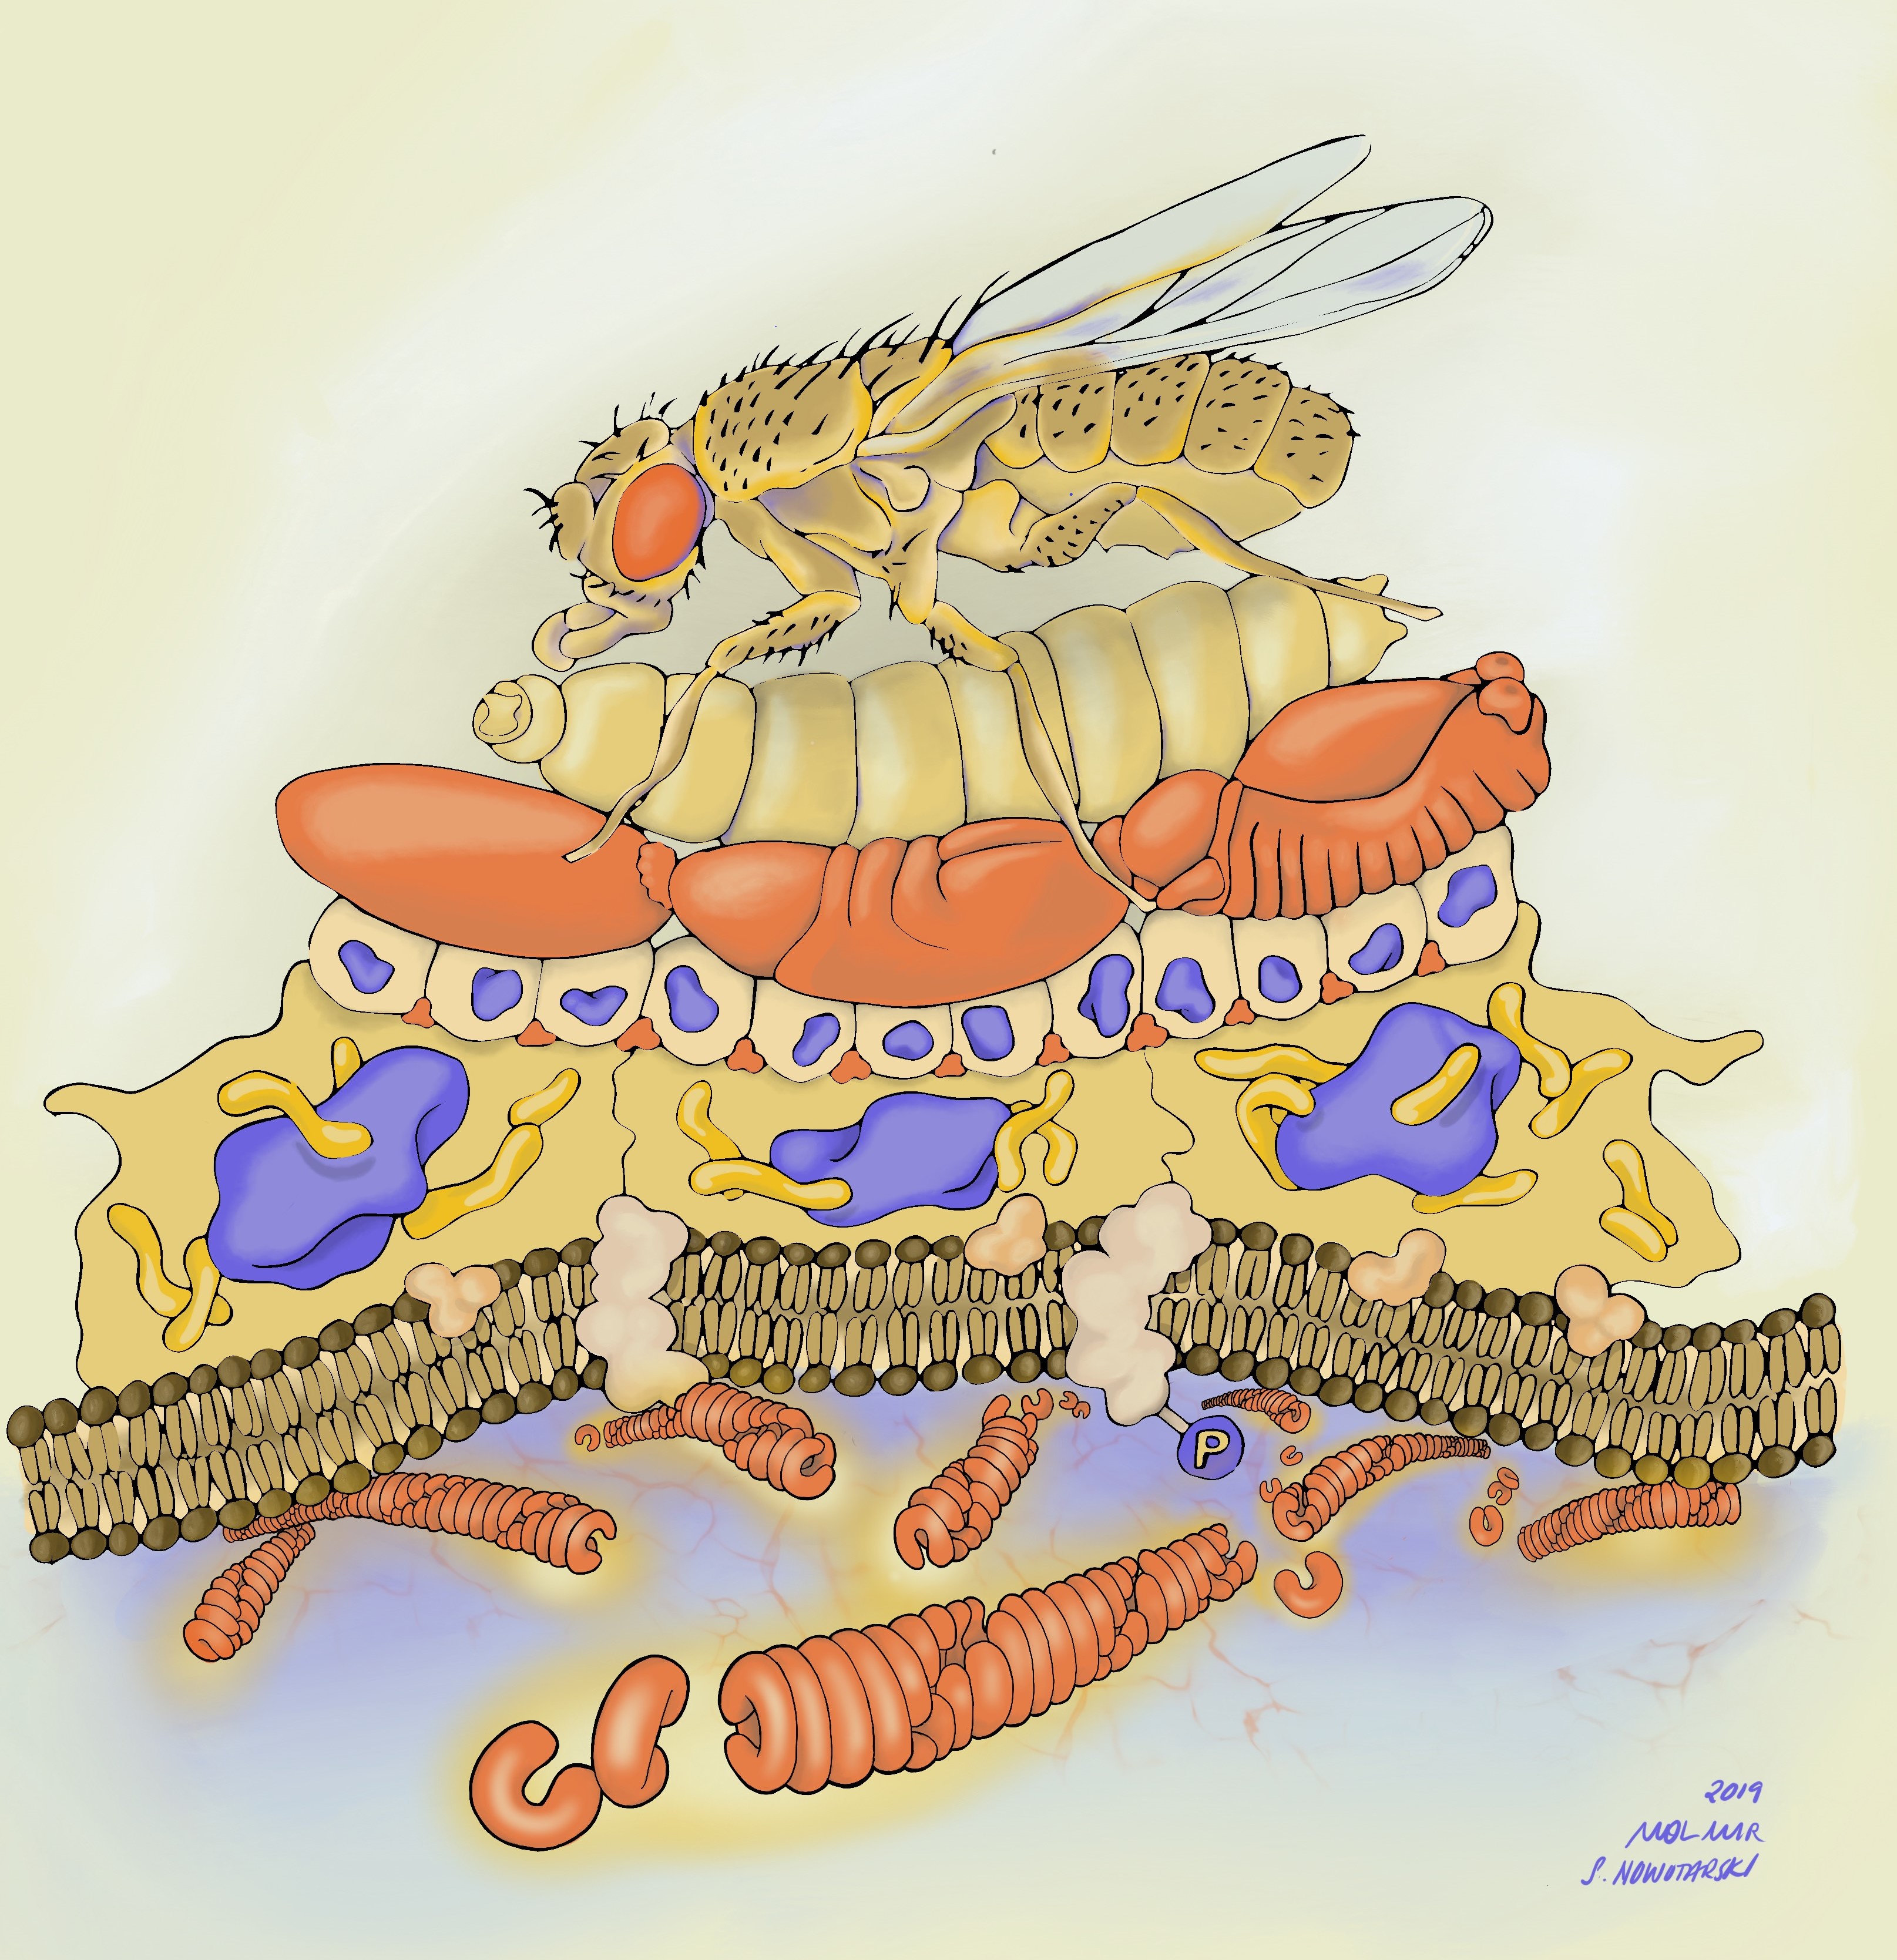
Before I get into the details of our story, I want to point you to the illustration below to put things in context. Along with our publication, I decided to submit potential cover images. One of those images was drawn by Stephanie Nowatarski, PhD (a really good old Drosophilist, now Planari-st and artist; http://stephanienowotarski.com/) in collaboration with Mol Mir (a researcher and art-maker; https://molmir.com/). It depicts our model from bottom (molecular structure) to top (animal viability)- highlighting the scalar structure of the analysis we performed in the paper.
This Illustration depicts the paper’s model from bottom to top- starting with the prion structure of Herzog associated with membrane and likely associated with phosphorylated proteins, acting as a phosphatase. The color of Herzog is carried up through the scale of the organism from cell to tissue to embryogenesis and depicts both Herzog’s localization at membranes on a tissue level and its importance in embryogenesis. The top tiers complete the view of developmental biology, from larvae to adult fly.
The two main strategies I followed to discover the function of Herzog were: 1- To look for the phenotypic effect of herzog mutations on the organism; and 2-To follow its expression pattern over time and space.
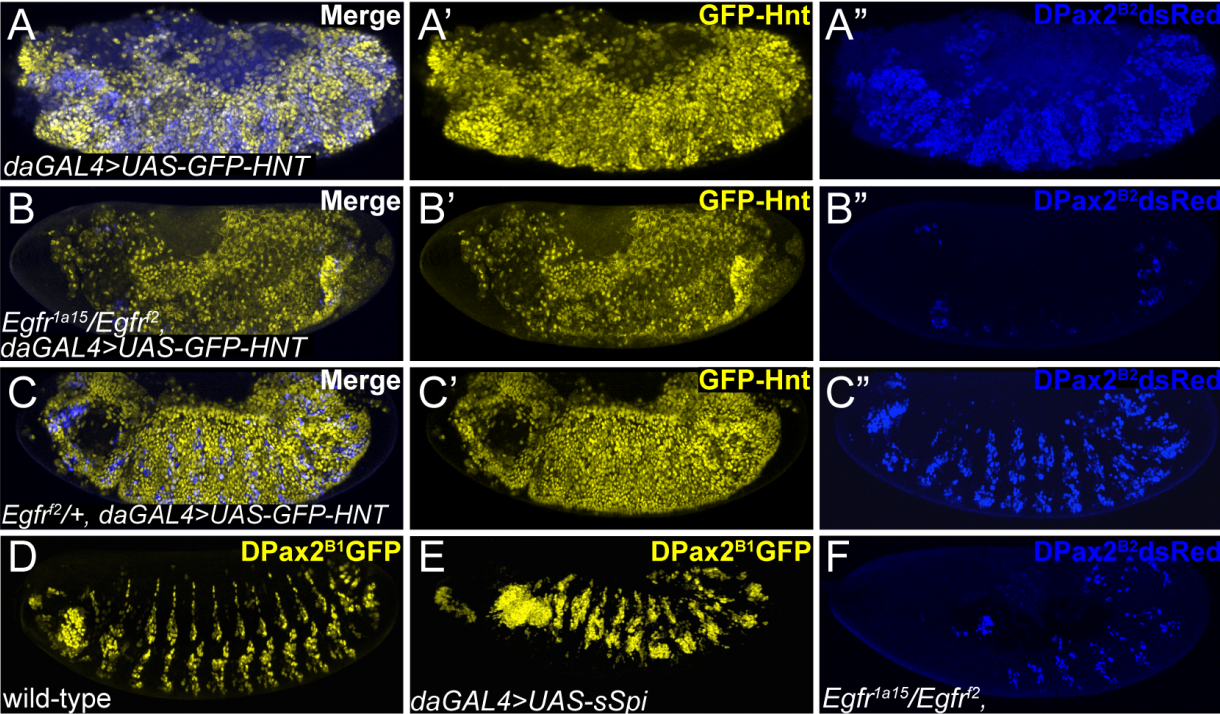
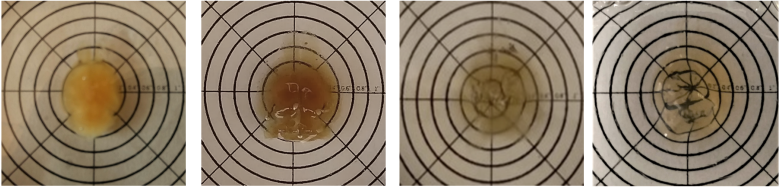
CRISPR-derived herzog mutant lines, which lack the middle phosphatase domain and the rest of the C-terminal of the protein, were embryonic lethal in the F2 generation. To understand when and where they had defects during embryonic development, I first examined their cuticles. I observed that mutants do not have the characteristic denticle pattern of a differentiated embryo. Referring to the famous “Heidelberg screen”, it was clear that herzog mutant embryos had defects in segment polarity, which is regulated mainly by two genes, i.e., engrailed and wingless. In embryos, engrailed starts expressing just after cellularization at the beginning of gastrulation. Staining of herzog mutant embryos right at this stage for engrailed showed us a diffused expression of engrailed in these mutants compared to wild type. When I looked at wingless, which is normally expressed at the posterior end of each segment later in development, I observed that while herzog mutants had the correct number of segments, there was an additional stripe of wingless in each segment (this data did not make it to the paper). This suggested that the diffused expression pattern of engrailed led additional cells to gain wingless identity, causing segments to lose their polarity. Most importantly, this told us that herzog has a role in establishing the A-P axis of each segment, acting as an antagonist of wingless signaling which begins with gastrulation. But how about the normal expression pattern of herzog? For that, the herzog mutant phenotype suggested two possibilities: 1- Herzog protein is both expressed and functional at this specific time point, like the other patterning genes, or 2-Herzog is there all along, but something happens at this time point such that the protein becomes functional.
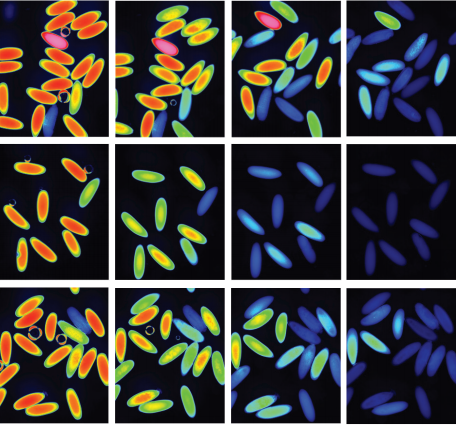
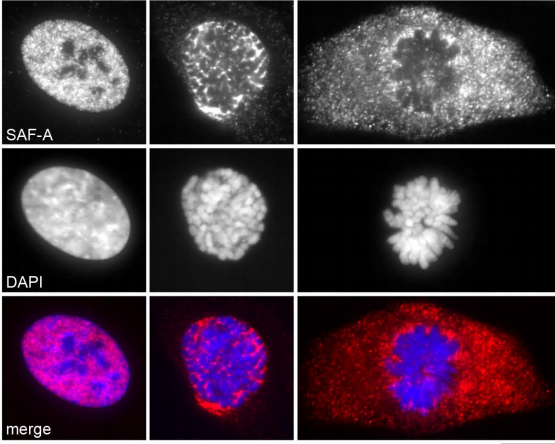
Let’s find the answer! For that, I endogenously tagged Herzog and followed it in the fixed embryos. I observed that Herzog is ubiquitously expressed on the membrane throughout embryonic development. In contrast to the patterning genes it regulates, Herzog does not have a specific expression pattern, which ruled out the first possibility I suggested above. Then I started thinking how I go about the second possibility. Wait a minute! I had embryos with fluorescent Herzog which I could follow live and focus closely! Collaborating with an awesome microscopist, @jeff_j_lange, we saw something happening to the protein just at the start of gastrulation: it is diffusely localized along the membrane until the end of cellularization, and when gastrulation begins, it changes to a punctate form on the membrane, and the punctate pattern persists throughout the rest of embryonic development. Now, I had a phenotype correlating a physical state change in the protein, which raised the curious question: Are the conformations of these two different physical states of Herzog different as would be the case for a prion-like protein? Before answering this question, I should mention that prion-like proteins can exist in at least two different conformations in the same cell: a monomer and an aggregate which can attain various physical conformations with different stabilities, ranging from flexible liquid droplets to very stable amyloids. To understand Herzog’s conformations, I followed it by western blot analysis at different stages of embryogenesis, and I saw that it exists as soluble low molecular weight monomers in all stages of embryogenesis. Interestingly, it transforms into high molecular weight aggregates, just after gastrulation, which correlates with the timing of its punctate pattern. Insolubility of these aggregates, even under the extreme denaturing conditions of boiling and detergents, suggests a stable conformation, like amyloid. In line with this idea, I found that Herzog protein staining colocalizes with an amyloid specific dye in embryos and that purified embryonic Herzog protein can be recognized with amyloid specific antibodies. So, I now had a protein that changes to an amyloid like state during gastrulation, and this coincides with its segment polarity phenotype. However, I still needed to know what this means at the molecular/biochemical level.
To understand the molecular function of Herzog, I thought I could build a reporter system to detect Herzog’s enzymatic activity in the presence or absence of aggregation. For this, I needed to answer two important questions: 1- Which part of the protein causes it to aggregate? and 2- What are the substrates of Herzog? Using truncated versions of Herzog, I found that N terminal prion-like domain of Herzog is responsible for both its aggregation and membrane localization. With proteomic analyses, I found that it interacts with well-known developmental regulators, which have roles in TGFβ/BMP, EGF and FGF signaling pathways and cell cycle. Focusing on one potential candidate called Dah, which was previously found to be dephosphorylated during gastrulation by an unknown phosphatase, I designed an enzymatic assay for Herzog and found that Herzog dephosphorylates Dah, for which N terminal prion-like domain is required. Replacing Herzog’s prion-like domain with a known amyloid forming prion-like domain (which also had a membrane targeting motif) rescued the enzymatic activity. This meant that the phosphatase activity of Herzog depends on its amyloid-like aggregation through its N terminal prion-like domain on the membrane. However, this did not tell us whether there is a clear distinction between activities of monomers and aggregates. In collaboration with an experienced structural biologist, Ruben Hervas Milan, we recapitulated the enzymatic activity of Herzog aggregates with purified protein from embryos. Importantly, we found that aggregates were active, and monomers did not have phosphatase activity. Moreover, when we allowed monomeric recombinant Herzog protein to self-assemble into amyloid-like fibrils, we observed a dramatic increase in enzymatic activity, while dissociation of these fibrils with an amyloid inhibitor abolished the activity.
Putting all these pieces together, I can now say that Herzog’s switch into amyloid-like aggregates is a developmentally regulated process resulting in its enzymatic activation that is essential for the patterning of the embryo.
What is ahead of us?
Although it was previously shown that knock down of prion-like homolog of prion protein in PrP knock out mouse results in an embryonic phenotype, how or whether the conformational change of these proteins affects development has not been studied. Herzog exemplifies for the first time how a protein conformational switch into a higher order amyloid state regulates a specific process in embryonic development. As the first natural example of an amyloid enzyme, Herzog demonstrates an alternative mode of enzymatic regulation: the use of a prion-like domain to regulate catalytic activity with conformational change. Looking ahead, we want to understand how the amyloid structure orients the catalytic domain of the enzyme to alter its activity; how the conformational switch of Herzog is regulated during development and how the aggregation dynamics regulate embryonic patterning.
Looking at its interactors, Herzog seems to have several potential functions at the intersection of multiple developmental signaling pathways. These pathways are inherently dynamic but lead to stable information to carry development forward. How can an enzyme with a seemingly stable conformation like amyloid make it in the dynamic environment of signaling pathways and so in development? Recent studies have shown that identical polypeptides can fold into multiple, distinct amyloid conformations and that amyloid structure can dynamically form and disappear via post translational modifications. We speculate that such structural flexibility and heterogeneity would allow a protein like Herzog to adopt stable yet dynamic conformational states. Moreover, these features may also lead to functional diversity such that a an amyloid-like protein can form distinct functional units, with even opposing functions, in the same cell and can maintain this functional diversity with the help of its stability. Development, which needs to accommodate the changing environment, might utilize such molecular stability and flexibility to tune the time course of development. Therefore, our study lends support to the idea that there can be other prion-like conformational functional switches regulating other important developmental events.
 In the latest Genetics Unzipped podcast we’re reporting back from the Manova Global Health Summit in Minneapolis last month, exploring the latest advances in health technology such as CRISPR-based gene therapies, infection-fighting bacteriophage and the possibility of curing HIV with stem cell transplants.
 (No Ratings Yet)
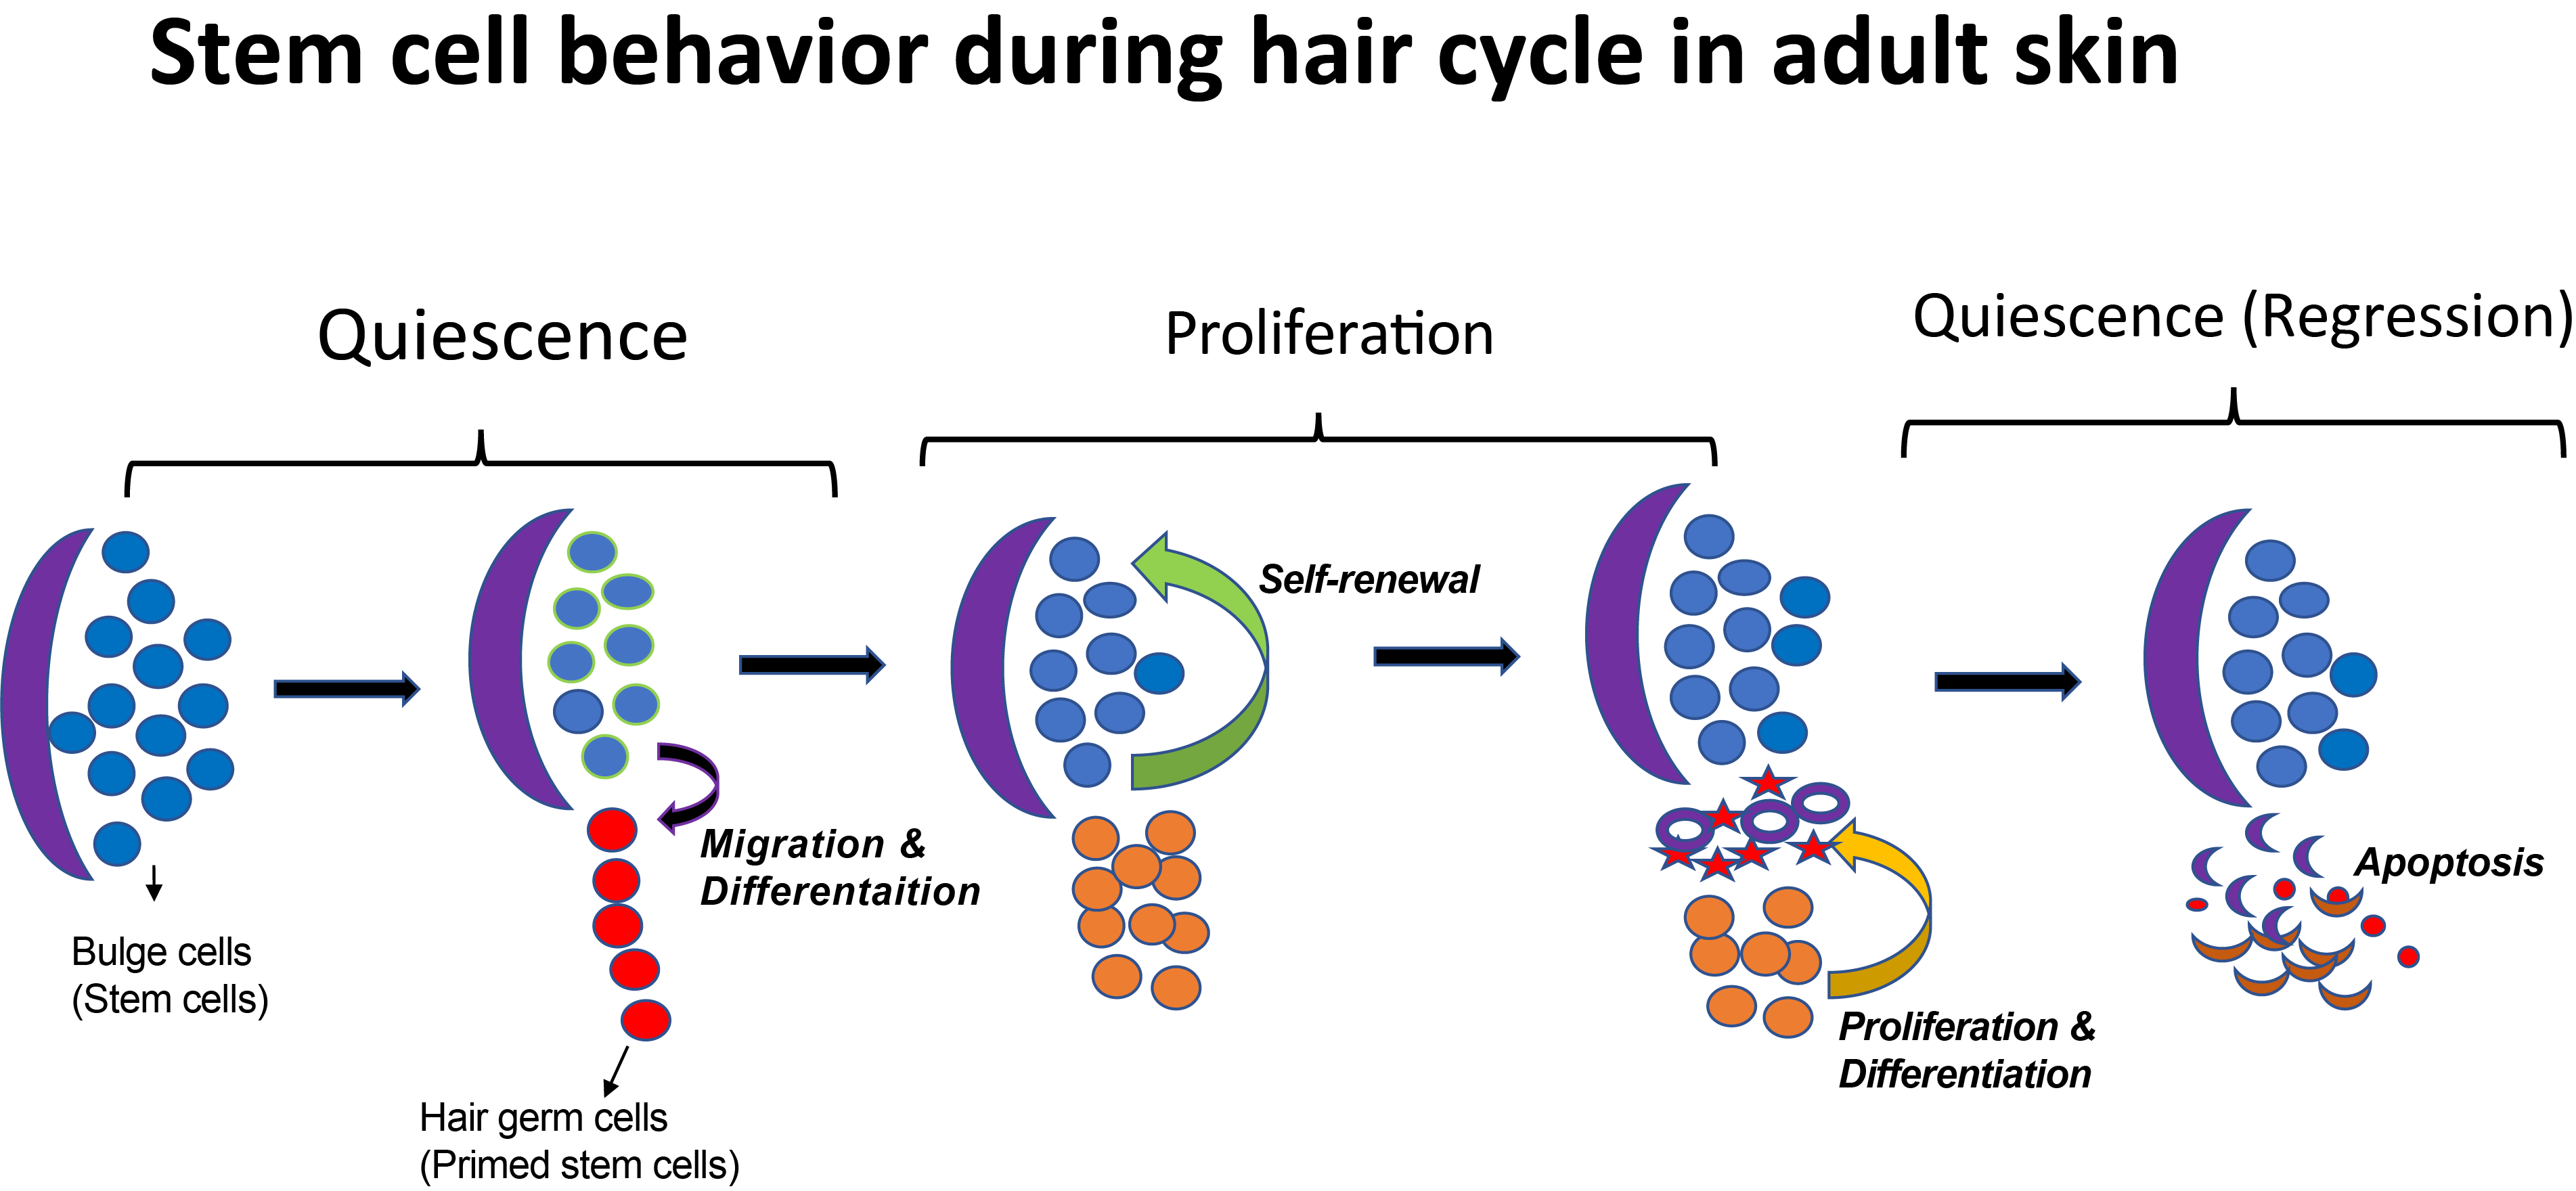
 (4 votes)
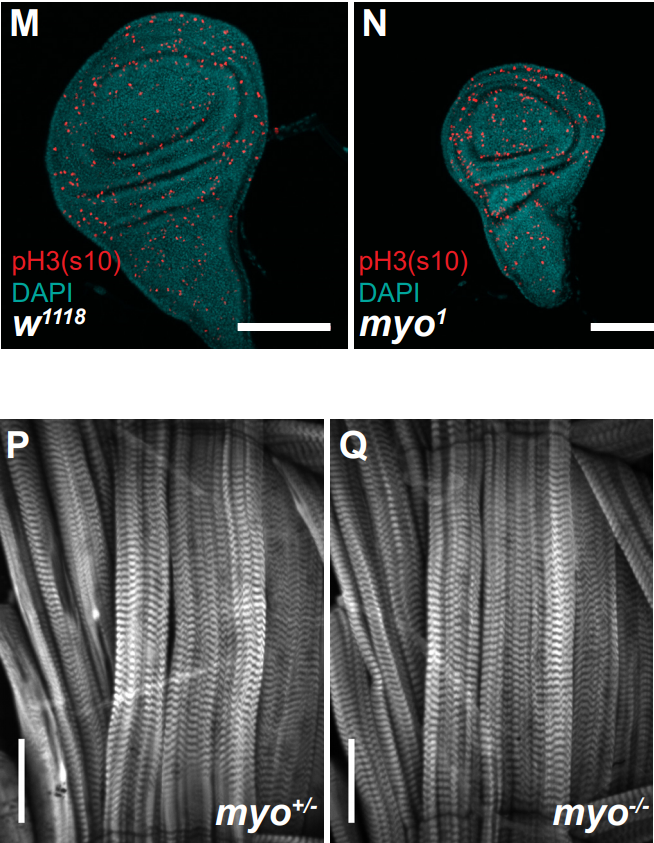


 (6 votes)