The Paridaen lab at ERIBA is currently looking for a highly motivated PhD student and post-doctoral researcher.
ERIBA (The European Research Institute for the Biology of Ageing) is a newly established institute at the University Medical Centre Groningen (UMCG). The mission of ERIBA is to better understand the molecular mechanisms that result in age-related decline and age-related diseases. We aim to develop novel strategies to prevent or combat age-related diseases and to provide evidence-based recommendations for healthy ageing. The research teams are working with different model systems and technology platforms and share their knowledge and expertise to accelerate discoveries. The ERIBA is housed in a new building and is part of the central UMCG campus in the vibrant University City Groningen in the north of the Netherlands. Groningen is a small (200,000 inhabitants), but vibrant city hosting over 25,000 students.
Stem cells act in developing and adult organisms to produce the proper number of specialized cells in the body. It is important that stem cells select an appropriate division mode to ensure proper development, maintenance and repair of tissues. In the Paridaen lab, we aim to understand the mechanisms underlying stem cell decisions in developing and ageing tissues. We employ single cell analyses techniques to study stem cell behaviour in the developing brain, using zebrafish and mouse as our model systems. In particular, we are interested in the role of fate-determining factors such as signalling pathways and subcellular structures in symmetric and asymmetric stem cell divisions.
For more information and application (before 3 September 2017), please see: http://ow.ly/NDeh30dKAxq
A new set of DMDD embryo and placenta data has been released, taking our total dataset to 9.5 million images of around 1300 embryos.
DMDD is a primary screen of embryonic lethal knockout mice, and all data can be freely accessed at dmdd.org.uk. Detailed phenotypes are available for embryos from 73 different knockout lines, and we have phenotyped the placentas from 124 lines. We have also added data on the sex of each embryo.
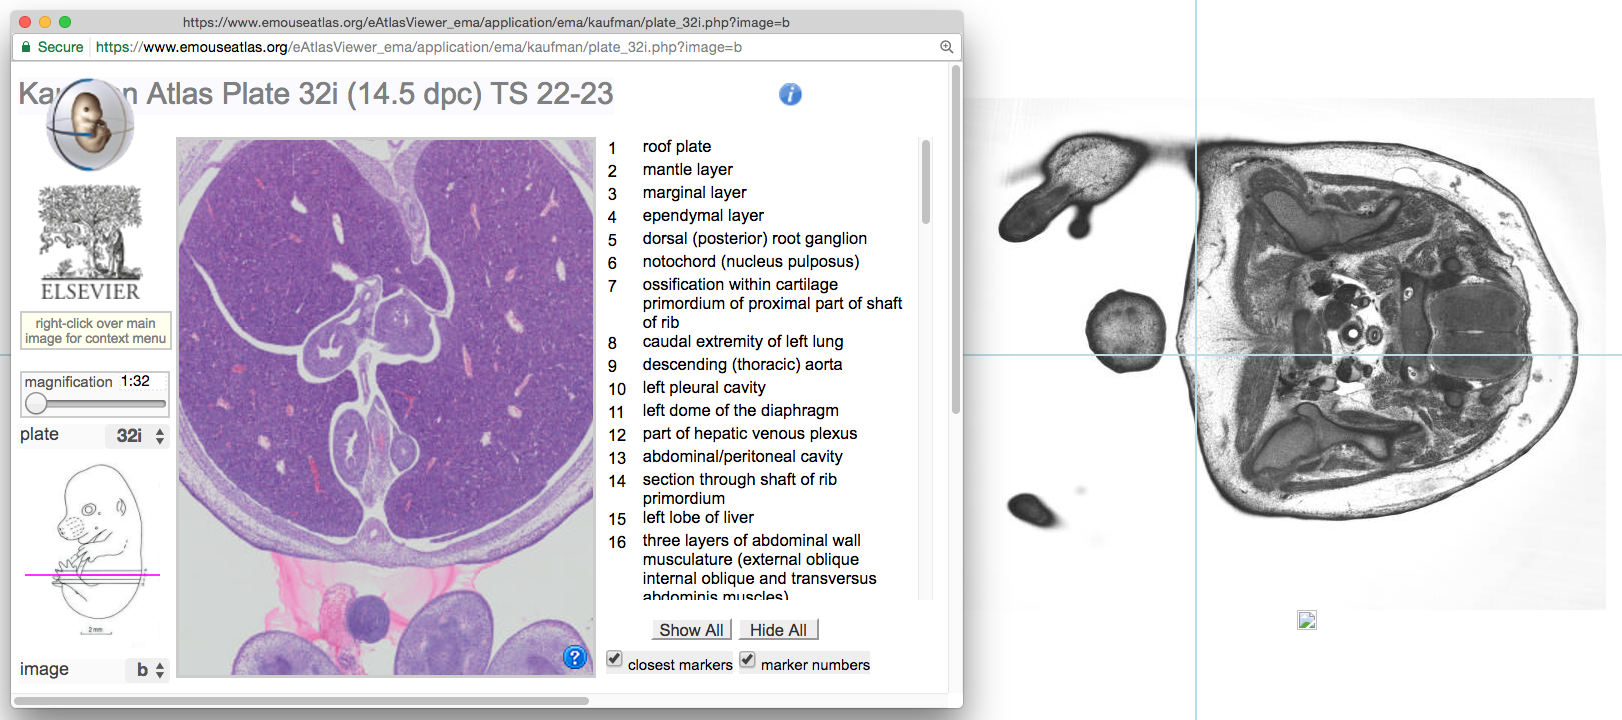
Visitors to our website can now compare HREM embryo images with the closest-matching, annotated histological section from the Kaufman Atlas of Mouse Development. This follows a major project by the eMouseAtlas team at the University of Edinburgh to digitise the Kaufman Atlas at high resolution. The annotated Kaufman sections can be viewed alongside DMDD embryo images to help users who are unfamiliar with the detailed morphological features of a mouse embryo as it develops.
Severe brain phenotypes
Phenotyping of Hmgxb3 knockout embryos revealed severe brain defects, with half of the embryos displaying exencephaly. Embryos from this line also had a range of phenotypes including edema, abnormalities of the optic cup, and defects of the venous system including an abnormal ductus venosus valve and blood in the lymph vessels.
An Hmgxb3 homozygous knockout embryo displays exencephaly.
Gene knockout can lead to a huge number of phenotypes
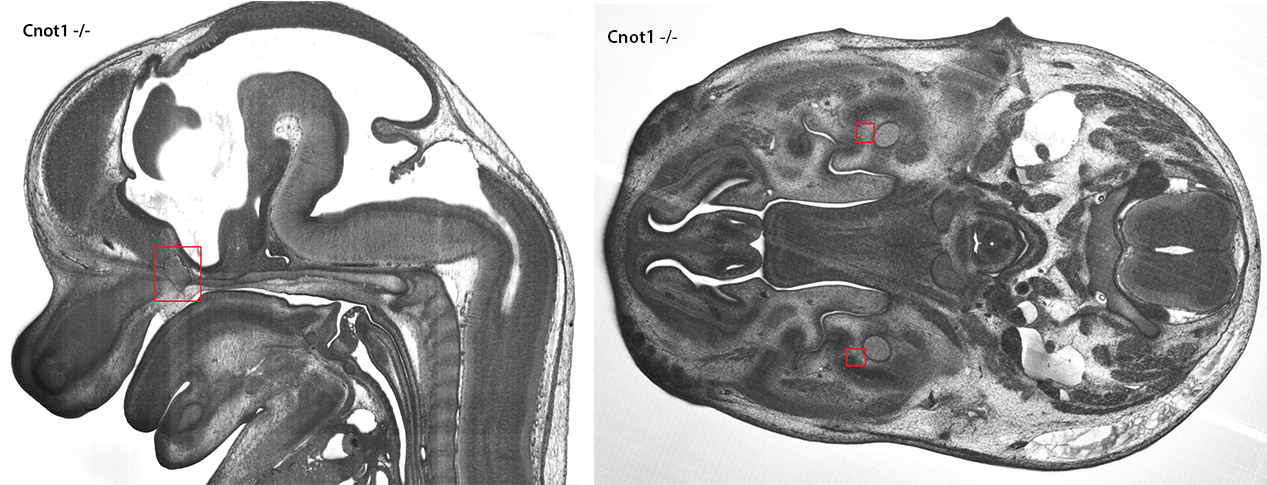
Fifty-five different phenotypes were identified in Cnot1 knockout embryos. These included an absent hypoglossal nerve (which is needed for tongue movement and suckling), abnormalities of the inner ear, testis and thyroid gland, abnormal cell masses that have been classified as embryo tumours, and various heart defects including overriding aortic valve and ventricular septal defects.
The images below show an embryo tumour, and the absence of the mandibular nerve (click the image to view a larger version).
A Cnot1 knockout embryo displays an embryonic tumour (left) and absent mandibular nerve (right) amongst many other phenotypes.
Potential models of human disease
A number of genes studied by DMDD have already been associated with human diseases. For example, Prmt7 mutations have been associated with Short Stature Brachydactyly Obesity Global Developmental Delay Syndrome, an autosomal recessive disease characterised by developmental delay, learning disabilities, mild mental retardation, delayed speech, and skeletal abnormalities. Strikingly, in the Prmt7 knockout embryos studied, the most common phenotypes included neuroma of the motoric part of the trigeminal nerve (a tumour within the skull, affecting the nerve controlling the jaw movements needed for speaking and chewing) and abnormalities of the hypoglossal nerve (which controls movement of the tongue) and the ribs.
Many of the genes studied by DMDD do not currently appear to be associated with any disease, for example Hmgxb3 or Cbx6. There is potential that careful analysis of the phenotypes from lines such as these could contribute to the identification of new disease models, and our data is freely available in order to encourage this.
A detailed description of normal mouse embryo development
The Atlas of Mouse Development by Professor Matthew Kaufman describes normal mouse embryo anatomy using a series of hundreds of annotated histological sections. Even today, twenty three years after its publication, it is still considered to be the gold standard for describing mouse embryo development. As part of a project to update the book in 2012, the original sections were digitised by the Edinburgh Mouse Atlas Group and made freely available on their eHistology resource.
The images have now been integrated into the DMDD database, and users can directly compare any HREM embryo image with the closest-matching annotated Kaufman section.
Each HREM embryo image can now be viewed alongside the closest-matching section from the Kaufman Atlas of Mouse Development.
This new feature is intended to help users who are not fully confident of the details of mouse developmental anatomy. It means that mutant mouse data can now be explored alongside a fully-annotated wild-type reference point.
Development depends on cells coming together in the right place to form functioning tissues. Our latest paper in this series was published recently in Current Biology and asks what happens to the structure and function of the nervous system when motor neuron migration – and hence final position – is disrupted. We caught up with postdoc Kimberly McArthur and her PI Joseph Fetcho, Professor at the Department of Neurobiology and Behaviour at Cornell University.
Joe, can you give us your scientific biography and the main questions your lab is trying to answer?
JF I was always curious about different types of animals, but I was particularly interested in snakes and how they moved. As a graduate student, I studied the locations of spinal motor pools across multiple species, and found that anamniotes (like snakes and fish) – unlike amniotes (like mammals) – lack a clear topographic relationship between motor neuron location in the spinal cord and muscle target location in the periphery. As a postdoc, I started working more with physiology and circuit structure in goldfish, studying the hindbrain Mauthner cell circuit that generates fast escapes, because I thought I could use it to figure out a circuit for a vertebrate behavior from sensory input to motor output before I died. Once I started my own lab, I switched to studying neural circuits in larval zebrafish – which had been an important developmental model for many years, but which also had incredible potential as a vertebrate circuit and behavioral model because of its relative simplicity, optical transparency, and genetic accessibility. Since then, my lab has continued to use zebrafish to study the principles by which neural circuits generate behavior, and how these principles inform and are informed by our understanding of circuit development and evolution.
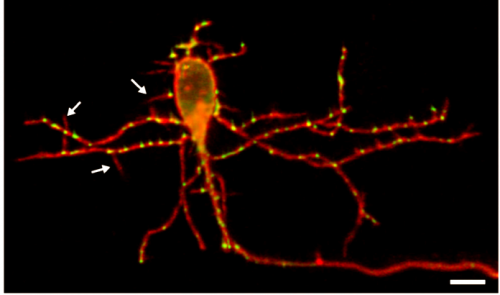
Imaging live synapses in the fish (image sourced from the Fetcho lab website)
And Kim, how did you come to join the Fetcho lab?
KM In my graduate work, I studied state-dependent changes in hindbrain sensorimotor circuits in pigeons – seeing how vestibular reflexes were modified by the transition into flight, and looking for the neural correlates. I was puzzled by the (apparent) lack of topography in the vestibular nuclei, how neighboring neurons can have completely different response properties – and I was a bit frustrated that I didn’t have the tools to easily nail down the identity of the neurons with a specific set of physiological properties. I came across a pair of papers from Joe’s lab (Kinkhabwala et al. 2011 and Koyama et al. 2011, both in PNAS) demonstrating the link between early neuronal topography and circuit recruitment for interneurons in the hindbrain, using larval zebrafish. I was impressed both by the scientific finding and by the way in which the model facilitates a direct line of investigation from genetic profile to cell morphology to physiology to behavior – all in an intact vertebrate.
How did you come to be interested in the relationship between cell positioning and function in the nervous system? Had this been experimentally tested before your work?
JF My predoctoral research dealt with the role of neuronal positioning in spinal motor circuits, and some of our current work demonstrated the correlation between hindbrain interneuron positioning and circuit recruitment. Previous studies have certainly addressed the importance of neuronal positioning; indeed, there is a great deal of evidence that positioning can be critical for proper circuit development. And it’s sensible for the developing nervous system to lean heavily on positioning as a strategy for targeting synaptic connections, as most neurons arise in specific locations and end up in stereotyped locations within a given species. We were interested in the importance of migration and hoped to get a better understanding of exactly what changes in a case where neuronal position is altered by a genetic block of migration in a population of cells that also changes position in evolution. We figured it would help us understand why migration and position seem to matter so much. We did not expect to find so much unaffected by a large position change.
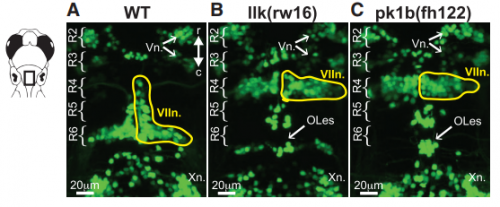
KM Other labs were using zebrafish facial motor neurons to study cellular mechanisms of neuronal migration, because these neurons execute an early caudal migration through the developing hindbrain. Those researchers had identified several mutations that spared the gross organization of the hindbrain but blocked the caudal migration of the facial motor neurons. We saw an opportunity to investigate the impact of this dramatic mis-positioning on the facial motor neurons themselves and the developing cranial motor circuits. We expected that there would be clear functional deficits in mis-positioned neurons, and we thought we’d be able to work out the details of how those deficits occur.
Hindbrains of Tg(Islet1:GFP) larvae at 5 dpf, from Figure 1, McArthur and Fetcho, 2017
Can you give us the key results of the paper in a paragraph?
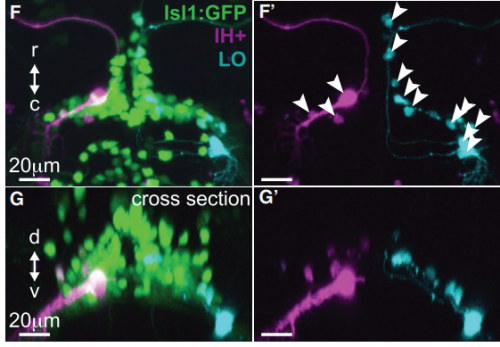
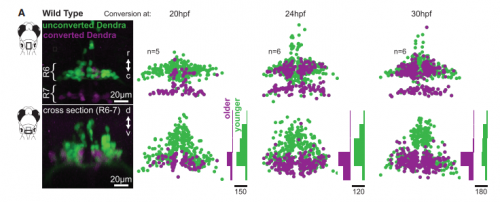
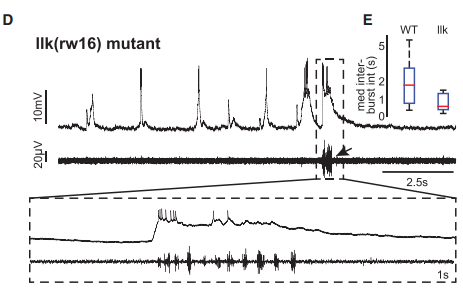
KM Contrary to our expectations, we found several lines of evidence indicating that facial motor neurons were robust to an abnormal shift in their segmental position. Even though their cell bodies and dendritic arbors were in entirely the wrong part of hindbrain, they still established intra-population topography (according to muscle target and relative age) and respiratory activity patterns (observed using intracellular electrophysiology and calcium imaging) that were very similar to wild type neurons. Indeed, wild type and mutant larvae exhibited similar respiratory behavior, which involves significant contributions from facial-innervated structures. Taken together, these results indicate that hindbrain motor networks can be surprisingly robust to a change in neuronal positioning – though there may be underlying differences in the motor circuits that we have yet to identify (which we’re pursuing now).
Backfills from cranial muscles reveal the location of facial motor pools, from Figure 1, McArthur and Fetcho, 2017
Is the resilience to change in position you’ve identified in motor neurons likely to be specific to these cells or a general feature of the nervous system?
KM I don’t believe that resilience to abnormal positioning is specific to facial motor neurons, but we also already know that it isn’t a general feature of every neuronal population – given previous work demonstrating that scrambling cell position can interfere with synaptic targeting in spinal cord, for example. Instead, I think that the developing nervous system deploys different synaptic targeting strategies in different circuits, and that some of these strategies are less sensitive to position than others.
Further, in the case of the facial motor neurons, I’m not convinced that positioning isn’t important. Facial motor neurons are born in roughly the same segmental location across vertebrates, but they end up in different places – suggesting that one location might be more adaptive than another in a particular species, depending on the dominant inputs to the facial motor neurons. It could be something to do with the metabolic cost of maintaining neural processes (i.e. wiring minimization), but I suspect that shifting segmental location might also affect the probability of synaptic input from a specific source (rather than specifying it in a deterministic fashion).
Finally, it’s interesting to note that facial motor neurons did establish the same cross-sectional topography in wild type and mutant larvae. Perhaps relative dorsoventral or mediolateral positioning is more critical than segmental (rostrocaudal) positioning for synaptic targeting in this specific population. This could be because many tracts in the hindbrain run longitudinally, so moving along that axis might have less impact on the inputs than moving in another direction.
Tracking facial motor neuron development and organisation with photoconversion, from Figure 3, McArthur and Fetcho, 2017
And what might be the evolutionary implications of your findings?
KM I think of the developing nervous system as (implicitly) giving each neuron a set of instructions for locating potentially useful synaptic partners. Those instructions can be written using different strategies. For any given synapse, multiple strategies might work equally well – but if there is some perturbation (due to, for example, a genetic mutation or an abrupt environmental change), different strategies will fail in different ways. This will be reflected in how specific circuits respond to developmental perturbations (i.e. which perturbations actually cause dysfunction and disease), and it will shape the landscape of inter-individual variation that is available as a substrate for natural selection. Facial motor neurons, for example, have shifted their segmental location across phylogeny. Perhaps that’s possible because they are targeted for synaptic contact in such a way that core behaviors (like respiration) are robust to a shift in segmental position. This might give the facial nucleus a chance to sample (via mutation) novel, potentially adaptive synaptic connectivity without losing access to its original network.
When doing the research, did you have any particular result or eureka moment that has stuck with you?
KM I was initially a bit disappointed when I couldn’t find a clear functional difference between wild type and mutant facial motor neurons. I’d been framing my research as a case study in which to explore how abnormal positioning does impact function, in a particularly helpful animal model for working through the circuit-level implications. However, as I did more thinking and more reading, I realized how interesting and important this result might be. As useful as it can be to look for factors that (when disrupted) break the system, I think it’s also important to understand how much can go wrong without breaking the system. Indeed, I think this may be part of the reason that many human neurological disorders are so genetically complex: because breaking a single factor (or even a set of factors) involved in circuit formation and function doesn’t necessarily cause observable disease in every individual.
Whole-cell patch-clamp recordings from mutant neurons, from Figure 5, McArthur and Fetcho, 2017
And what about the flipside: any moments of frustration or despair?
KM The biggest technical challenge for me was learning how to do whole-cell recordings in the larval zebrafish brain. When I was a graduate student, I learned how to do extracellular in vivo electrophysiology – which isn’t trivial, but you can start getting data relatively early if you get lucky with your electrode placement. When I started my postdoc, I spent several months learning how to handle the tools, do the dissection, work the scope, and finally record from cells. And I spent almost two months straight focused entirely on recording without actually getting any data. So, it was challenging to spend the first part of my postdoc mostly failing all day – but I also kinda like those moments, because it’s rewarding to overcome a challenge. And it worked out well in the end.
What are your career plans following this work?
KM I’m on the academic job market this year, applying for tenure-track faculty positions that combine research and teaching. I’d like to join a department where I can continue studying the development and function of neural circuits using larval zebrafish.
Tracking motor neuron innervation, from Figure S1, McArthur and Fetcho, 2017
And what’s next for the Fetcho lab?
JF Recently, my lab has started to move into collaborations to advance technologies for neural circuit research, especially for looking with high resolution into brain and spinal cord of intact living adult zebrafish. The goal is to be able to study circuits and behavior in a vertebrate (even in one individual!) from embryo to adult.
Finally, what do you two like to do in NY state when you are not in the lab?
JF Not much. Lab has been my passion and my job. I mostly work, read, and think. I sometimes hang out in or near the woods behind our house looking for snakes and other animals including bears, pileated woodpeckers, turkeys, foxes and bobcats. Animals are my thing. People, not so much.
KM I think I’m your quintessential nerd! I get excited about going to the public library and checking out a stack of books. (No, seriously.) I try to balance my literary diet: nonfiction books about current events, plus lots of horror novels.
We came across this video from EuroStemCelldescribing a project that aimed to increase public awareness of stem cell biology, as well as encourage scientists to get involved in public engagement and interact with other professionals along the way. In their introduction to the video, EuroStemCell give us the background:
“Creative public engagement initiatives are often strengthened by collaborations but how do they come about? What are the benefits and challenges? This short animated film reveals the story, from beginning to end, of a collaborative public engagement initiative involving stem cell scientists, public engagement professionals, artists and social anthropologists. We hope that by sharing what we have learned, it will encourage others to get creative and collaborative!”
Here are the highlights from the current issue of Development:
Computing branching pattern complexity
Bile – a fluid that aids digestion – is transported from the liver to the intestine through the bile duct. Bile reaches the bile duct itself via a complex, highly branched structure called the intrahepatic biliary network. This network spreads throughout the liver but how it is patterned is unclear. On p. 2595, Takuya Sakaguchi and colleagues report a novel computational approach to analyse the 3D structure of this network in developing zebrafish. They use a computational algorithm that renders confocal scans of labelled livers into compact representations of the intrahepatic biliary network, which recapitulate endogenous branching patterns and simplify the branched networks into segments amenable to further analysis. Using this computational approach, the authors identify a small molecule inhibitor of Cdk5 that reduces the density of the biliary network, leaving liver size and biliary epithelial cell numbers unchanged. They also experimentally manipulate the downstream Cdk5-Pak1-LimK-Cofilin cascade to increase branching density, and demonstrate a role for this cascade in regulating actin dynamics in biliary epithelial cells. These findings demonstrate the utility of this computational approach to studying branched tissues and highlight the Cdk5-Pak1-LimK-Cofilin cascade as a potential therapeutic target for liver disorders.
No lung development without Sin(3a)
Sin3a is a co-repressor that modulates the transcription of numerous genes by complexing with chromatin remodelling enzymes that modify histones. Here, Barry Stripp and co-workers reveal a key role for Sin3a during lung development in mice (p. 2618). They report that the foregut endoderm-specific deletion of Sin3a leads to failed lung development and the death of neonatal pups due to respiratory failure. Although lung buds form in early mutant embryos, subsequent branching morphogenesis and development fails, with loss of both the lung endoderm and lung epithelium. Loss of Sin3a also disrupts lung mesoderm differentiation, possibly due to aberrant epithelial-mesenchymal interactions. Interestingly, histone H3 acetylation levels show no significant change in Sin3a-deficient epithelial cells, indicating that loss of histone deacetylation activity is unlikely to contribute to the lung phenotype. Instead, lung epithelial progenitor cells in mutant embryos enter a senescence-like state and arrest in G1. This cell cycle arrest is partially mediated by upregulation of the cell cycle inhibitors Cdkn1a and Cdkn2c. Together, these findings reveal that Sin3a plays a crucial role in regulating early lung endoderm progenitor cell fate, via the transcriptional repression of cell cycle inhibitors, to prevent the induction of a senescence-like state. Whether Sin3a plays a similar role in the postnatal lung awaits further investigation.
Set(d1b)ing oocyte gene expression
Mouse primordial germ cells (PGCs) – the precursors of oocytes and sperm – undergo extensive DNA demethylation as they migrate to the genital ridge. In primary oocytes, DNA undergoes re-methylation, and lysine residues on the tails of histone H3 become methylated. This important epigenetic mark is created in mammals by H3K4 methyltransferases, including Setd1a and Setd1b. Setd1a plays no role in oogenesis, but now Andrea Kranz and colleagues report that the loss of Setd1b in mouse oocytes causes female sterility (p. 2606). Although metaphase II-stage oocytes develop in female Setd1bconditional mutants, both their zona pellucida and meiotic spindle are abnormal. Upon fertilisation, extra sperm enters the perivitelline space of the mutant oocytes and the zygotes become stuck at the pronuclear stage. RNA profiling reveals that Setd1b is required for the expression of key oocyte transcription factors and that its inactivation causes twice as many mRNAs to be upregulated as downregulated. Thus, Setd1b likely promotes the expression of transcriptional repressors, possibly Zfp-KRAB factors, which maintain the oocyte-specific expression programme in late development by reducing earlier, unwanted gene expression. These findings reveal a novel role for Setd1b in regulating the oocyte-to-embryo transition, possibly by regulating the late-oocyte gene expression programme.
PLUS…
The status of the human embryo in various religions
Research into human development involves the use of human embryos and their derivative cells and tissues. How religions view the human embryo depends on beliefs about ensoulment and the inception of personhood, and science can neither prove nor refute the teaching of those religions that consider the zygote to be a human person with an immortal soul. In his Spotlight article, William Neaves discusses some of the dominant themes that have emerged with regard to how different religions view the human embryo, with a focus on the Christian faith as well as Buddhist, Hindu, Jewish and Islamic perspectives.
Interspecies chimeras for human stem cell research
Interspecies chimeric assays are a valuable tool for investigating the potential of human stem and progenitor cells, as well as their differentiated progeny. In their Spotlight article, Hideki Masaki andHiromitsu Nakauchi discuss the different factors that affect interspecies chimera generation, such as evolutionary distance, developmental timing, and apoptosis of the transplanted cells, and suggests some possible strategies to address them.
A framework for understanding the roles of miRNAs in animal development
MicroRNAs (miRNAs) contribute to the progressive changes in gene expression that occur during development. In their Review, Chiara Alberti andLuisa Cochella present a view of miRNAs as a hierarchical and canalized series of gene regulatory networks. In this scheme, only a fraction of embryonic miRNAs act at the top of this hierarchy, with their loss resulting in broad developmental defects, whereas most other miRNAs are expressed with high cellular specificity and play roles at the periphery of development, affecting the features of specialized cells.
Two fully funded PhD Positions in cell, developmental and systems biology
at the Universitätsklinikum Freiburg, Germany
The Walentek lab studies the molecular mechanisms of mucociliary development, regeneration and disease. Mucociliary epithelia line the embryonic epidermis as well as the respiratory tract of many animal species, and provide an important first line of defense against pathogens for the organism. We are particularly interested to elucidate the interactions between cell signaling, transcriptional and post-transcriptional regulation of gene regulatory networks, and the morphogenetic processes at the cellular and tissue-wide levels, which facilitate complex tissue formation and function. Our work aims to provide crucial insights into the logic of self-organization in biological systems as well as into the molecular mechanisms underlying chronic lung diseases.
Two PhD positions will be available starting October 2017 (or later). The group is supported through the Emmy-Noether-Program by the DFG, which provides fully funded PhD positions (65%). We offer a great environment to perform cutting-edge science at the interface between basic biology and translational medical studies. The Walentek lab is affiliated with the excellent Freiburg Medical Center (Universitätsklinikum Freiburg) and situated in the multidisciplinary research building of the ZBSA (Center for Biological Systems Analysis). This setting provides access to state-of-the-art core facilities and collaborations, including advanced light and electron microscopy, proteomics, computational biology, mathematical modeling and genetics/ genomics. PhD students will have the option to participate in the Spemann Graduate School of Biology and Medicine and benefit from advanced training and mentoring opportunities.
Prior experience in cell/developmental biology, genetics/ genomics, or (bio)informatics is highly desired. Interested students should apply with a cover letter stating their motivation, a CV (incl. list of publications if applicable), and contact information for two scientific references to applications_walenteklab@gmx.de .
Antibodies are one of the most commonly used research reagents. However, due to their innate variability, finding the right antibody can be a challenge. Scientists devote a significant amount of time sifting through the literature to find antibodies that have been shown to work under specific experimental contexts matching their research interests. This process often takes several hours, sometimes even days, wasting valuable time that could otherwise be used more efficiently.
BenchSci has created a solution to this problem by developing a machine-learning algorithm that decodes primary research papers to identify the antibody used and the associated experimental contexts in each paper. Scientists can search their protein of interest on BenchSci’s open-access online platform, and find results displayed in the form of individual figures from scientific papers in which antibodies against that protein were used. These figures are easily filterable to allow users to narrow down their search results to the antibody use cases that best fit their experimental contexts and, ultimately, find the best antibodies for their experiments.
On the open-accessBenchSci platform, we have developed several features that can facilitate evidence-based antibody selection. Check them out below!
1. Search results can be viewed as “Figures” or “Products” list
Depending on your preference, you may wish to examine figures first then identify the antibody used, or you may wish to examine antibodies first then view associated figures that supported its use.
2. Figures and Products can be filtered by specific experimental contexts
Using filters such as Techniques, Tissue, and Cell Lines, and more, you can easily identify published figures and the antibody used that match your experimental interest in seconds.
3. Direct link to original paper and antibody supplier
If you found a figure or product of interest, you can directly link to the original paper or the supplier website, respectively.
4. Save Figures and/or Products to “My Bench”
For individual figures or products of your interest, you can track them by saving to folders in “My Bench”.
Within My Bench, you can organize the figures and products into different project folders.
5. Submit Reviews for your (least) favourite antibody
Data that proves an antibody didn’t work under certain contexts is equally important as data that showed the antibody worked. Unfortunately, this information is not captured anywhere else other than in your lab notebook.
The Review function is where you can let fellow scientists know that you have tested a certain antibody, and whether or not it worked as intended.
6. Sharing the knowledge
You can email individual figures or products to your colleagues, labs members, or collaborators with the click of a button.
We would like to invite you to create a free academic account at www.BenchSci.com, and experience how efficient evidence-based antibody selection can be!
For any questions, suggestions, or comments, please get in touch with Maurice (maurice@benchsci.com). We would love to hear from you.
In the very earliest stages of life, mammalian cells multiply and form the embryo. New research from the University of Copenhagen suggests that this process might be much simpler than we thought. The development of the embryo can be cut down to the cell’s ability to count their neighboring cells.
The article ‘Four simple rules that are sufficient to generate the mammalian blastocyst’ is a product of StemPhys, a new multi-disciplinary initiative between The Faculty of Health and Medical Sciences, University of Copenhagen and the Niels Bohr Institute funded by the Danish National Research Foundation. The work is published in the journal PLoS Biology.
See more here: http://danstem.ku.dk/news/the-earliest-stages-of-life-might-be-simpler-than-we-thought/
Each year at the International C. elegans Conference Ahna Skop organises a Worm Art Show with winners selected by the meeting participants (find out more about the history of the show here).
2017’s winners have just been announced – read about them over at the GSA’s Genes to Genomes blog(a great site for your bookmarks if you haven’t visited it already!).
The Best in Show this year was won by Beata Mierzwa’s Bond-themed image (Beata told us all about her awesome art last year)
This highly-detailed image of the central nervous system from a horned dung beetle (Onthophagus sagittarius) was captured with a laser-scanning confocal microscope. Imaged during the late pupa stage, this beetle was about to complete metamorphosis. The optic lobes (top) are in the process of growing and extending towards the outer surface of the head to form a pair of compound eyes. Different colored fluorescent labels were used to visualize the distribution of a structural protein (red), the neurotransmitter serotonin (green), and genetic material (blue). This image is from a National Science Foundation-supported research project on the evolution of novel and complex traits. By Eduardo Zattara, Armin Moczek, Jim Powers, Jonathan Cherry, and Matthew Curtis
o form new tissues and structures during development, populations of cells move, often over long distances. This movement, called cell migration, is highly coordinated across space and time. This zebrafish (Danio rerio) larva was labeled with red fluorescent molecules to identify the migrating cells that will compose the surface of the fish’s skin, or epithelium. Genetic material (blue) and, in a subset of cells, a structural protein (green) were also labeled. Although this image is of a fixed zebrafish, the research group is using live imaging to observe the movement of these cell populations in real time. Drs. Ruiz and Eisenhoffer are researching cell migration to better understand normal facial development as well as the genetic mutations in humans that lead to congenital birth defects such as cleft lip and palate. By Oscar Ruiz and George Eisenhoffer
Spinal cord injuries often lead to lifelong disabilities. To achieve functional recovery, the nerve pathways that were damaged must be reconnected. One potential solution is to induce the nerve stem cells already present in the adult spinal cord to reestablish these connections. This requires activating the stem cells to grow long extensions while simultaneously preventing the formation of scar tissue, which can block these extensions. This image from a NIH National Institute of Biomedical Imaging and Bioengineering-supported study shows a mouse nerve cell (blue/green) on a synthetic nanofiber gel (purple) designed to mimic healthy spinal cord tissue. The nerve cell has grown long extensions (green) into the gel. The researchers found that injecting these nanofibers at the site of a spinal cord injury reduced scar formation and helped to restore hind leg function in mice. By Mark McClendon, Zaida Alvarez Pinto, and Samuel I. Stupp
Proper bone and cartilage development is critical to support body structure and protect vital organs. For example, the skull supports and protects the brain while the ribs protect the heart, lungs, liver, and spleen. As seen in this image of mice at different developmental stages, bone (green) and cartilage (reddish-orange) formation begins during the embryonic period (far left) and continues throughout adolescence (far right). The NIH National Institute of Dental and Craniofacial Research supports this research program on genetic mutations that cause abnormal skeletal formation and underlie many congenital birth defects. By William Munoz, Karla Terrazas, and Paul Trainor
C-shaped rings of cartilage (red) give the trachea, or windpipe, its shape and strength. Because all oxygen that reaches the lungs must first pass through the trachea, its structural integrity is essential to human life. In conditions like tracheomalacia, malformation of the cartilage weakens the trachea, leading to airway collapse. The NIH National Heart, Lung and Blood Institute supports this research project on identifying the signals that prompt developing cartilage to segment into C-shaped rings. This image from a mouse is helping the investigators examine the organization of nerve cells (green) and their potential role in directing cartilage (red) formation. By Randee Young and Xin Sun
“Show us and the world the art of light microscopy and illustrate the details of life with your most beautiful image.”
Deadline for entries is 31st October
Royal Society Photography Competition
This competition is “open to scientists, and winning entries are chosen according to 2 key criteria: they should be aesthetically pleasing, and convey an interesting scientific phenomenon.” Deadline is 31st August, more details here.
Among the categories, ‘Micro-imaging’ is probably the best bet for developmental biologists! Here’s a couple of runners up of last year’s competition:
Runner up: Micro-imaging. “The spiralled snake axis” by Tyler Square. During early growth and development, most vertebrate animals look quite similar. Here, in this image of a one-day post-oviposition African house snake (Boaedon fuliginosus), we see many features that tie all vertebrates together: pharyngeal arches surrounding the mouth and throat (with gill slits between them), muscle segments (called somites) which will eventually contribute to the spine and musculature, and a chambered heart connected to a closed circulatory system to move oxygen and nutrients to tissues. During and after these stages, the novelties specific to a species or lineage begin to develop – here the 5mm long elongated body of the snake develops as a spiral to fit inside the egg.
Runner up: Evolutionary Biology. “Polychaetous worm with engine and wagons” by Fredrik Pleijel. This trainworm (Myrianida pinnigera), which is 35mm from head to tail, lives on the sea floor. Its front end, the trainworm’s engine, is followed by a row of carriages called ‘stolons’ that increase in size towards the worm’s tail end. The carriages are the worm’s swimming sexual organs. When the trainworm is mature, the last carriage in the train lets go and detaches. It swims up the water column to reproduce. The carriages, unlike the engine, all lack a gut and are full of either sperm or eggs. In the water column the well-developed sensory organs seek out another stolon to mate with. After mating the male stolons die. The females survive a short time to shelter the embryos, which are carried in their bellies. Meanwhile, the trainworm on the sea floor continues to produce stolon carriages.
 (No Ratings Yet)
 (1 votes)
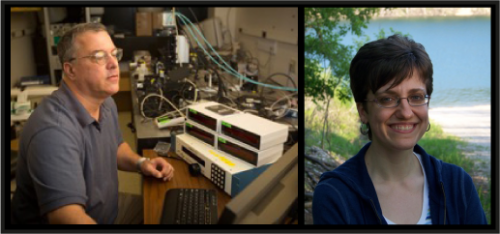


 Research into human development involves the use of human embryos and their derivative cells and tissues. How religions view the human embryo depends on beliefs about ensoulment and the inception of personhood, and science can neither prove nor refute the teaching of those religions that consider the zygote to be a human person with an immortal soul. In his
  MicroRNAs (miRNAs) contribute to the progressive changes in gene expression that occur during development. In their
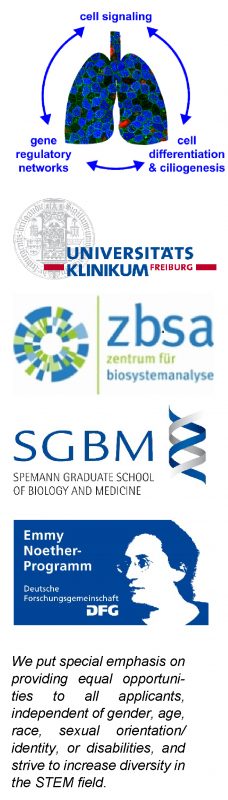


")