“Environmental Cues for Life Cycle Transitions” symposium – a perspective from EuroEvoDevo 2024
Posted by Elizabeth Williams, on 25 September 2024
Núria Ros-Rocher1, Júlia Ramon Mateu2, Elizabeth Williams3
1 Institut Pasteur, Université Paris-Cité, CNRS UMR3691, Evolutionary Cell Biology and Evolution of Morphogenesis Unit, 25-28 Rue du Dr. Roux, 75015 Paris (France)
2 Laboratoire de Biologie du Développement de Villefranche-sur-mer (LBDV), UMR7009 CNRS/UPMC, Institut de la mer de Villefranche, Quai de la Darse, 06234 Villefranche-sur-Mer Cedex, France
3 University of Exeter Biosciences, Streatham Campus, Stocker Rd, Exeter EX4 4QD, UK
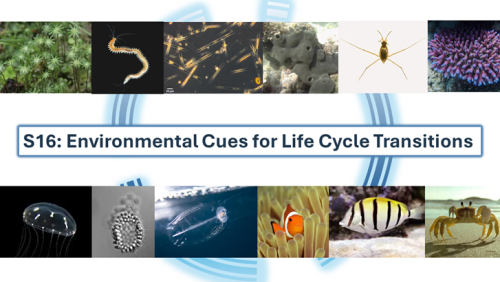
With some beautifully warm and sunny mid-summer weather, attendees of the EuroEvoDevo2024 gathered on Friday morning 28th June at the University of Helsinki for a symposium on ‘Environmental cues for life cycle transitions’. This was one of twenty-four symposia at this year’s meeting, with a record attendance of over 600 people. It was co-organized by Vincent Laudet (Okinawa Institute of Science and Technology, Japan and Academia Sinica, Taiwan) and Elizabeth Williams (University of Exeter, UK) and involved ten presenters. This symposium aimed to examine life cycle transitions and the influence of the environment on them from a broad perspective across organisms from different kingdoms of life. What aspects of the environment trigger changes in an organism’s form and physiology and how do organisms sense these?
Although starting early on the final morning of the conference, our enthusiastic late-night discussions at the nearby conference pub, the ‘Thirsty Scholar’, were offset by strong Finnish coffee, a selection of fresh vegetarian foods, the promise of the conference dinner and party later that evening, and our shared interest in the evolution of complex life cycles. The symposium brought together diverse researchers and topics, with study organisms ranging from liverwort to diatoms, choanoflagellates, insects, marine invertebrates, and fish. Environmental cues discussed ranged from abiotic factors such as light, temperature and salinity, to biotic cues including microbial biofilms, coralline algae, and food type and availability.
Overall, five different types of life cycle transition were discussed. Arild Husby, from Uppsala University (Sweden), presented recent work on morphological polyphenism in water striders, which is induced by changes in photoperiod. When exposed to more hours of light in the day, water striders will develop short-wing phenotype and under short day lengths will develop long-winged phenotypes. RNA sequencing followed by RNAi knockdown and ELISA measurements of the insect moulting hormone ecdysone indicated that this polyphenism is regulated by the Fat/Hippo pathway (Gudmunds et al. 2024), with a possible role for ecdysone signalling. The Fat/Hippo pathway controls organ size in animals and relates to a fundamental question in developmental biology: how does an organ know when to stop growing after reaching a particular size? The ecdysone signalling pathway was also the focus of work presented by Giulia Campli, from the University of Lausanne, Switzerland, who investigated the moulting gene repertoire across an impressive 153 proteome dataset, comprehensive of insect, crustacean and chelicerate arthropod species, highlighting changes and novelties in the molecular machinery driving the moulting process, a second type of life cycle transition for exoskeleton renewal (Campli et al. 2024).
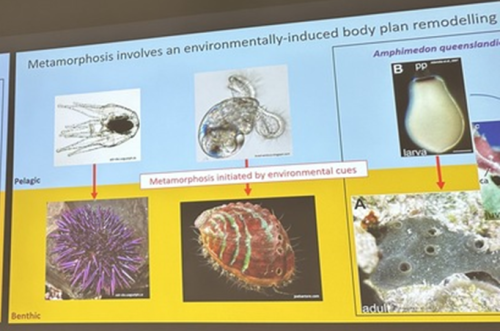
A third common type of life cycle transition among animals is metamorphosis from a larval to a juvenile form. Several speakers focused on this transition across a wide range of animals, from sponges to fish. Océane Blard, PhD student at the University of Queensland (Australia), presented remarkable brightfield timelapses and fluorescent confocal images illustrating the morphological and cellular changes observed during the first 6 hours of metamorphosis in the marine sponge Amphimedon queenslandica. She also tracked the fate of larval sensory-secretory cells, known as flask cells, which are proposed to detect cues from coralline algae to initiate settlement and metamorphosis (Nakanishi et al. 2015). These cells appear to be able to transdifferentiate, and future research will focus on understanding the molecular mechanisms underlying this process using single cell transcriptomics. Elizabeth Williams, research fellow at the University of Exeter (UK), focused on understanding how free-living larvae settle and metamorphose to become seafloor-dwelling juveniles. Elizabeth and colleagues found that microalgae biofilms, notably diatoms, induce a settlement response in the marine worm Platynereis dumerilii (Hird et al. 2024), they described similar sensory-neurosecretory cells across polychaete, cnidarian and mollusc larvae, potentially responsible for timing metamorphosis according to external environmental conditions. In future work, Elizabeth and colleagues will focus on the morphology, function and molecular signalling mechanisms of these cells.
Júlia Ramon Mateu, PhD student at the Laboratoire de Biologie du Développement (LBDV) in Villefranche-sur-mer, presented her PhD work on the cellular and molecular mechanisms of cnidarian settlement. She identified and characterized the cell types forming the aboral end (head) of the planula larva of three cnidarian species belonging to the two main clades of Cnidaria: the jellyfish Clytia hemisphaerica and the corals Astroides calycularis and Pocillopora acuta. To do so, she generated bulk RNA-seq data from the planula aboral end and single-cell RNA-seq data from the same larval stage for each species. Through a comparative analysis of transcriptomic profiles, morphology and distribution of aboral cell types between the larvae of Clytia and the two coral species, she defined the common cellular architecture of the planula aboral end featuring two broad cell-type classes: secretory-like and neural-like. Of particular interest, she identified genes related to taurine uptake and catabolism as a shared feature of specialized cells in the planula aboral end: associated with a neural cell type in Clytia and a specialized epidermal cell type in the two coral species. Using settlement assays developed for both Clytia and Astroides planulae, she could show that exogenous taurine delays or prevents settlement in both species. Júlia concluded her presentation with an updated model of the cells and molecules involved in cnidarian larval settlement, proposing taurine uptake as a key factor in the regulation of the settlement response.
Vincent Laudet (Okinawa Institute of Science & Technology, Japan and Academia Sinica, Taiwan) also investigates the environmental influences of larval metamorphosis and phenotypic disparity in coral reef fish. Like marine invertebrates, the environment can also modulate different aspects of fish metamorphosis from pelagic larvae to reef-associated juveniles. Vincent presented a case of environmental acclimation in fish populations living in the enclosed lagoon of Taiaro Atoll, an extreme environment in French Polynesia, (Reynaud et al. 2023). Compared to their natural habitat (beaches and mangroves), the lagoon displays higher salinity and temperature. Interestingly, fish living in the lagoon and their counterparts living in oceanic reefs were identical at the genetic level, despite differences in their habitat. To understand the molecular mechanisms of fish acclimation to high salinity, Vincent and colleagues compared their transcriptomic profiles and found that each population had particular differences in thyroid hormone regulation. Thyroid hormones are central hormone regulators triggering metamorphosis in vertebrates (Zwahlen et al. 2024). In fish, they regulate a major metabolic shift during metamorphosis from the juvenile to the adult phase, including changes in pigmentation and maturation of the nervous/sensory and digestive systems. Vincent and colleagues proposed a new view of the role of thyroid hormones: rather than functioning independently in metamorphosis, metabolism and seasonality, thyroid hormones perform a 3-in-1 function of timing a biphasic life cycle transition. Thus, local acclimation to the environment is an endocrine-driven process, conferring plasticity on fish from the time they undergo metamorphosis and enabling them to adapt to high salinity conditions.
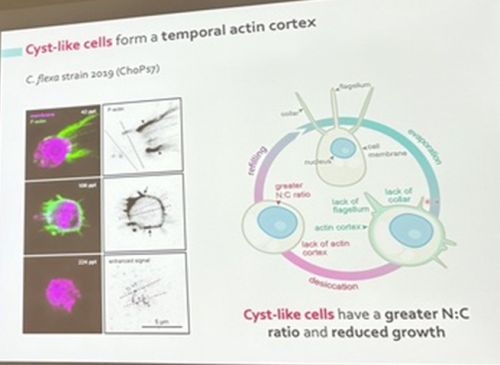
Núria Ros-Rocher, postdoctoral researcher at Institute Pasteur (Paris, France), presented another case of salinity-dependent life cycle transition in a microeukaryote. Núria showed that Choanoeca flexa, a facultatively multicellular choanoflagellate (Brunet et al. 2019;Reyes-Rivera et al. 2022), develops colonies by an unconventional mixed mode of clonal-aggregative multicellularity (Ros-Rocher and Reyes-Rivera et al. 2024). To further explore the ecological determinants of C. flexa clonal-aggregative multicellularity, Núria, Josean, and colleagues combined cell biology approaches in the laboratory with fieldwork experiments in the Caribbean island of Curaçao, the original site where this species was discovered (see Brunet et al. 2019). In the field, they surveyed 150 seawater-filled splash pools, the natural habitat of C. flexa, and explored the impact of splash pool evaporation and refilling cycles on C. flexa multicellularity. C. flexa colonies could only be observed in a narrow range of salinity and were never observed in higher salinities in the field, yet sometimes appeared in splash pools that got refilled by waves or splash after complete desiccation.
Surprisingly, multicellular C. flexa colonies could be recovered from soil samples collected from dry splash pools upon rehydration with seawater in the lab. Later experiments in the lab mimicking the evaporation of splash pools showed that colonies dissociate into quiescent single cells in high salinities, losing multicellularity. In those conditions, some single cells transitioned into a desiccation-resistant form, losing some of the stereotypical choanoflagellate features (a collar and a flagellum). Repeating similar rehydration experiments, Núria showed that those cells could return to their multicellular form upon rehydration. The authors hypothesized that this mixed clonal-aggregative strategy might represent a versatile adaptation to the ephemeral nature of splash pools where the simultaneous action of both mechanisms could allow for a faster re-establishment of multicellularity. In ongoing work, Núria, Josean and colleagues are exploring the genetic diversity of newly isolated strains from distinct splash pools. They are focusing on kin recognition capacities that may impact choanoflagellate survival in the field and provide insights into the adaptation of this organism in a highly fluctuating environment.
In addition to metamorphoses and multicellularity, three presenters also discussed later-in-life transitions related to reproduction. Mariella Ferrante, researcher at the Stazione Zoologica Anton Dohrn (Italy), presented recent work on centric and pennate diatoms exploring how these different single-celled microalgae switch between sexual and asexual reproduction. While sexual reproduction in centric diatoms can be triggered by environmental cues such as light and salinity, pennate diatoms do not appear to have a specific trigger for initiating sexual reproduction. However, planktonic pennate diatoms need to solve the challenging problem of locating a mate within the vast 3D ocean to undergo sexual reproduction before they drop below a critical size due to several rounds of asexual reproduction which cause them to decrease in size with each asexual division. Mariella and colleagues are using RNA-Seq and single-cell RNA-seq in different diatom species and reproductive stages to explore heterogeneity in diatom populations as well as to identify a panel of molecular markers for detecting diatom sex events at sea (Annunziata et al. 2022).
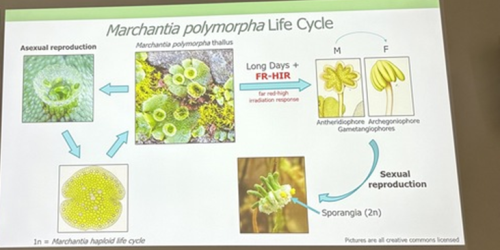
Alexandre Alié, researcher at the Laboratoire de Biologie du Développement (LBDV) in Villefranche-sur-Mer, is also using scRNA-Seq to understand asexual reproductive transitions in another organism that inhabits the pelagic oceans – Mediterranean salps, planktonic tunicates that form large chains through asexual reproduction. Alexandre and colleagues hope to use this information to understand more about how the stem cells in the stolons of the salps can bud off dozens of new individuals and how this process is influenced by environmental factors such as temperature and food availability. Finally, David Hoey introduced us to the molecular regulation of transformations for reproduction in the liverwort Marchantia polymorpha, which switches between sexual and asexual reproduction throughout the year depending on light quality, day length and drought conditions (Duckett et al. 2024). David generated knockout lines of a RAS gene and found that it is a regulator of asexual reproductive development in M. polymorpha. Remarkably, this gene is responsive to both light and drought cues.
Overall, a strong theme running through the symposium was the development of molecular lab techniques such as gene knockout and single-cell RNA-Seq for application in a variety of non-model organisms. Ongoing studies on all of these emerging models are advancing our understanding of how environmental cues are detected and lead to important transitions in a life cycle. We also found inspiration in the examples from several researchers of combining their molecular lab studies with field studies of their organism of interest, to place our understanding of organismal and life cycle diversity back into a broader ecological context. We anticipate that this will be a strong theme going forwards, and aligns with the emphasis on eco-evo-devo that was highlighted at this year’s conference by keynote speaker Scott Gilbert, who also drew attention to the importance of microbial ecology in shaping animal life cycles and symbioses. Could inter-species or inter-kingdom interactions be a future focal area to further inform life cycle evolution?
References
- Annunziata et al. 2022. Trade-off between sex and growth in diatoms: Molecular mechanisms and demographic implications. Science Advances 8:3, DOI: 10.1126/sciadv.abj9466
- Brunet et al. 2019. Light-regulated collective contractility in a multicellular choanoflagellate. Science 366: 6463, https://www.science.org/doi/10.1126/science.aay2346
- Campli et al. 2024. The moulting arthropod: a complete genetic toolkit review. Biological Reviews of the Cambridge Philosophical Society, https://doi.org/10.1111/brv.13123
- Duckett et al. 2024 The biology of Marchantia polymorpha subsp. ruderalis Bischl. & Boissel. Dub in nature. Frontiers in Plant Science, 15, https://doi.org/10.3389/fpls.2024.1339832
- Gudmunds et al. 2024. The Fat/Hippo pathway drives photoperiod-induced wing length polymorphism. BioRxiv https://doi.org/10.1101/2024.04.05.588279
- Hird et al. 2024. Microalgal biofilm induces larval settlement in the model marine worm Platynereis dumerilii. Royal Society Open Science, https://doi.org/10.1098/rsos.240274
- Nakanishi et al. 2015. Sensory flask cells in sponge larvae regulate metamorphosis via calcium signaling. Integrative and Comparative Biology 55(6): 1018-1027, DOI: 10.1093/icb/icv014
- Reynaud et al. 2023. The environment: A vector of phenotypic disparity during the settlement phase of coral reef fishes. Journal of Experimental Marine Biology and Ecology, 568: 151937, https://doi.org/10.1016/j.jembe.2023.151937
- Reyes-Rivera et al. 2022. Nitric oxide signaling controls collective contractions in a colonial choanoflagellate. Current Biology, 32(11): P2539-2547, DOI: 10.1016/j.cub.2022.04.017
- Ros-Rocher et al. 2024. Mixed clonal-aggregative multicellularity entrained by extreme salinity fluctuations in a close relative of animals. bioRxiv, https://doi.org/10.1101/2024.03.25.586565
- Zwhahlen et al. 2024. The ecological function of thyroid hormones. Philosophical Transactions of the Royal Society B, Biological Sciences, https://doi.org/10.1098/rstb.2022.0511
Acknowledgements
The Company of Biologists provided financial support for this symposium. We thank the organisers of the EED2024 conference in Helsinki, Finland, and all attendees of this symposium for contributing to discussions of this session. We also thank the symposium speakers for contributing to revision of this report.
 (No Ratings Yet)
 (4 votes)